

Abstract
Background
Hypoxia has been reported to be associated with the colonic inflammation observed in a chemically induced mouse model of self-limiting colitis suggesting that low tissue oxygen tension may play a role in the pathophysiology of inflammatory tissue injury. However, no studies have been reported evaluating whether tissue hypoxia is associated with chronic gut inflammation. Therefore, the objective of the present study was to determine whether hypoxia is produced within the colon during the development of chronic gut inflammation.
Methods
Adoptive transfer of CD4+ T-cells obtained from interleukin-10-deficient (IL-10−/−) mice into lymphopenic recombinase-activating gene-1-deficient (RAG−/−) mice induces chronic colonic inflammation, with the inflammation ranging from mild to severe as determined by blinded histological analyses. Colonic blood flow, hematocrit and vascular density were determined using standard protocols, whereas tissue hypoxia was determined using the oxygen-dependent probe pimonidazole.
Results
Adoptive transfer of IL-10−/− CD4+ T-cells into RAG−/− recipients induced chronic colonic inflammation that ranged from mild to severe at 8 weeks following T-cell transfer. The colitis was characterized by bowel wall thickening, goblet cell dropout, and inflammatory infiltrate. Surprisingly, we found that animals exhibiting mild colonic inflammation had increased hypoxia and decreased systemic hematocrit, whereas mice with severe colitis exhibited levels of hypoxia and hematocrit similar to healthy controls. In addition, we observed that the extent of hypoxia correlated inversely with hematocrit and vascular density.
Conclusions
Changes in hematocrit, vascular density, and inflammatory state appear to influence the extent of tissue oxygenation in the T-cell-mediated model of chronic gut inflammation.
Keywords: Crohn’s Disease, colitis, hypoxia, hematocrit, vascular density
INTRODUCTION
Ischemia and hypoxia have been proposed to be important in the pathogenesis of inflammatory bowel diseases (IBD; Crohn’s disease, ulcerative colitis) (1, 2). Hypoxia and the upregulation of hypoxia-inducible factors (HIFs) can be detrimental to tissue health and potentially exacerbate the inflammatory process; however, HIFs also can initiate protective defenses, as has been demonstrated in a chemically induced model of self-limiting colitis (3, 4). In these previous studies, hypoxia was assessed using the oxygen-dependent probe 2-nitroimidazole, the free base form of which is pimonidazole. Within the intracellular environment, pimonidazole interacts and forms irreversible adducts with thiol groups when oxygen tensions fall below 10 mmHg, which is typical for the superficial mucosal epithelium. However, Karhausen et al. (3) demonstrated that hypoxia may extend more deeply into the colonic mucosa in mice subjected to intrarectal administration of trinitrobenzene sulfonic acid dissolved in ethanol (TNBS).
To our knowledge, the extent of colonic hypoxia has not been investigated in an animal model of chronic intestinal inflammation. Previous work from our laboratory, using a modification of the classical CD45RBhigh T-cell transfer model of chronic colitis, demonstrate that adoptive transfer of IL-10−/− CD4+ T-cells into lymphopenic recipients induces chronic colitis in which the severity of disease ranges from mild to severe inflammation (5). Surprisingly, the more substantial changes in microvascular perfusion, as measured with a laser Doppler flow meter, occurred in the subset of mice exhibiting mild inflammation, with significantly lower values of colonic and ileal blood flow rates and red blood cell volumes than in the mice with severe colonic inflammation. Therefore, the development of hypoxia could be speculated to have been more likely in the mice with mild colonic inflammation, with this possibility forming part of the rationale of the current investigation. Using this T-cell transfer model of chronic colitis, we initiated a series of investigations to ascertain whether chronic intestinal inflammation is associated with tissue hypoxia. To do this we quantified intestinal blood flow, vascular density, hematocrit, and tissue hypoxia in mice with varying degrees of colitis. Our provocative findings may have important implications in terms of oxygen delivery and hypoxia-dependent signaling in the inflamed colon.
METHODS
Animals
Interleukin-10-deficient (IL-10−/−) and recombinase-activating gene-1 deficient (RAG−/−) mice were obtained from Jackson Laboratories (Bar Harbor, ME). Animals were maintained on 12/12-hour light/dark cycles in standard animal cages with filter tops under specific pathogen free (SPF) conditions in our animal care facility at Louisiana State University Health Sciences Center, Shreveport (LSUHSC-S). The mice were given standard laboratory rodent chow and water ad libitum. All experimental procedures involving the use of animals were reviewed and approved by the Institutional Animal Care and Use Committee of LSUHSC-S and performed according to the criteria outlined by the National Institutes of Health.
Induction of Chronic Intestinal Inflammation
Chronic colonic and ileal inflammation were induced in mice by the adoptive transfer of IL-10−/− CD4+ T-cells into RAG−/− recipients as previously described (5–8). Briefly, CD4+ T-cells obtained from IL-10−/− donor mice were enriched (>90%; from single cell suspensions of splenocytes) by negative selection using a commercially available kit (Dynal; Invitrogen; Carlsbad, CA) and injected (106 T-cells per mouse; i.p.) into RAG−/− recipients. The control group was identical except for the injection of vehicle (phosphate-buffered saline, PBS) alone instead of the T-cells (PBS ⇒ RAG−/− mice). We have previously shown that this control group demonstrates essentially no differences in microvascular and histologic measurements obtained from an alternative control group of adoptive transfer of CD45RBlow T-cells (5).
The IL-10−/− CD4+ ⇒ RAG−/− mice were maintained beyond the day of T-cell transfer for either 2–3 weeks (N=16) or 8 weeks (N=16), with time- and age-matched control PBS ⇒ RAG−/− mice maintained simultaneously (N=14 and N=12, respectively). The mice were used for measurements of tissue hypoxia, blood flow rate, systemic hematocrit, and tissue histology, including immunostaining for PECAM-1.
In Vivo Measurements
Mice were injected intramuscularly with 60 mg/kg pimonidazole (Hypoxyprobe-1™; National Pharmacia International Inc., Burlington, MA). One hour later, the mice were anesthetized with 150 mg/kg ketamine and 10 mg/kg xylazine, and the ileum and proximal colon were then exteriorized and kept moist with warmed saline. A Doppler flow probe (Vasamedics LaserFlo Blood Perfusion Monitor BPM2; St. Paul, MN) was positioned over the exposed tissue for measurements of blood flow rate (an average of 10 measurements). After obtaining a blood sample for values of hematocrit, the mice were euthanized (150–200 mg/kg pentobarbital) and the colons excised, weighed, and measured for a weight-to-length ratio.
Tissue Staining
The excised colons were placed in cold PBS, and processed as we have described previously (5, 9). Briefly, each colon was sectioned (lengthwise) into two halves with each half rolled from the proximal to the distal end forming a Swiss roll. One of the Swiss Rolls was fixed in buffered formalin and embedded in paraffin to be used for blinded histopathological evaluation and immunohistochemistry, whereas the other half was frozen and used for additional immunohistochemical determinations.
Frozen sections on the slides were washed in PBS plus 0.25% Triton X-100 (Sigma, St. Louis, MO) three times for five minutes each, then incubated with 10% normal goat serum in tris-buffered saline for two hours at room temperature to block non-specific binding. The sections were incubated overnight at 4°C with a 1:200 dilution of the primary antibody, rat antimouse CD31 (550274; BD Biosciences, Franklin Lakes, NJ), in PBS with 1% bovine serum albumin (BSA). As a negative control, sections also were incubated using an equal concentration of an isotype control rat IgG (559073; BD Biosciences). The sections were rinsed in PBS plus 0.25% Triton X-100 three times for five minutes each, then incubated for 1 hour at room temperature in the dark with FITC-conjugated secondary antibody, goat polyclonal antibody to rat IgG (ab7093-100, Abcam, Cambridge, MA) at a dilution of 1:250 in PBS and 1% BSA. After rinsing with PBS three times for five minutes each, the sections were mounted with a coverslip and Vectashield mounting medium containing propidium iodide as a nuclear counterstain. Pictures from the slides were taken with a NanoZoomer Digital Pathology System (Hamamatsu) with the help of Dr. David Burk at the Pennington Biomedical Research Center (Baton Rouge, LA). The number of pixels stained for PECAM-1 was divided by the number of pixels stained for propidium iodide for a tissue-normalized ratio.
The other half of the colon that was fixed in 10% buffered formalin was embedded in parafin and sectioned (5 µm sections). For histological scoring of injury and inflammation, the sections were stained with hematoxylin and eosin (H&E). The slides were scored by a blinded pathologist (S.Z.), who was unaware of the treatment groups, using our previously published scoring criteria (8), based on the degree of inflammatory infiltrate in the lamina propria (0–3 scale), Goblet cell loss (0–2), neutrophils per 40x field (0–4), abnormal crypt architecture (0–3), number of crypt abscesses (0–1), mucosal to frank erosion (0–1), and submucosal to transmural involvement (0–3) for a total score ranging from 0–17.
On fixed sections used to quantify the extent of hypoxia, Hypoxyprobe™ rabbit antiserum (PAb2627) was used as a primary antibody at a 1:3000 dilution; the secondary antibody was anti-rabbit immunoglobulin conjugated to horseradish peroxidase (DakoCytomation; Carpinteria, CA). Negative controls were performed in the absence of the primary antibody, with no staining present. Staining was normalized to the amount of tissue in a ratio dividing the number of brown pixels to blue pixels, with the brown/blue color-deconvolution performed with Image J software proved by NIH (version 1.40g).
Statistics
Student t-tests were used between two groups, and multiple groups were compared using analysis of variance (ANOVA) with Student-Newman-Keuls post-hoc corrections (GraphPad Instat software, San Diego, CA). Values are presented as means +/− standard error.
RESULTS
Figure 1 shows the mean colon weight-to-length ratios, pathology scores, and percent changes in body weight for the IL-10−/− CD4+ ⇒ RAG−/− mice as well as the PBS ⇒ RAG−/− control mice 2–3 weeks and 8 weeks following injection of T-cells (or PBS). We observed significant differences in colon weight-to-length ratios, histological pathology scores, and body weight changes by the end of the 8-week protocol. Although there were tendencies for T-cell transfer-induced changes in colon weight-to-length ratio and body weight following 2–3 weeks, these differences did not reach statistical significance. In contrast, the blinded histology scores gave a more sensitive indication of the changes that were already occurring soon after the reconstitution (Fig 1B).
Figure 1.
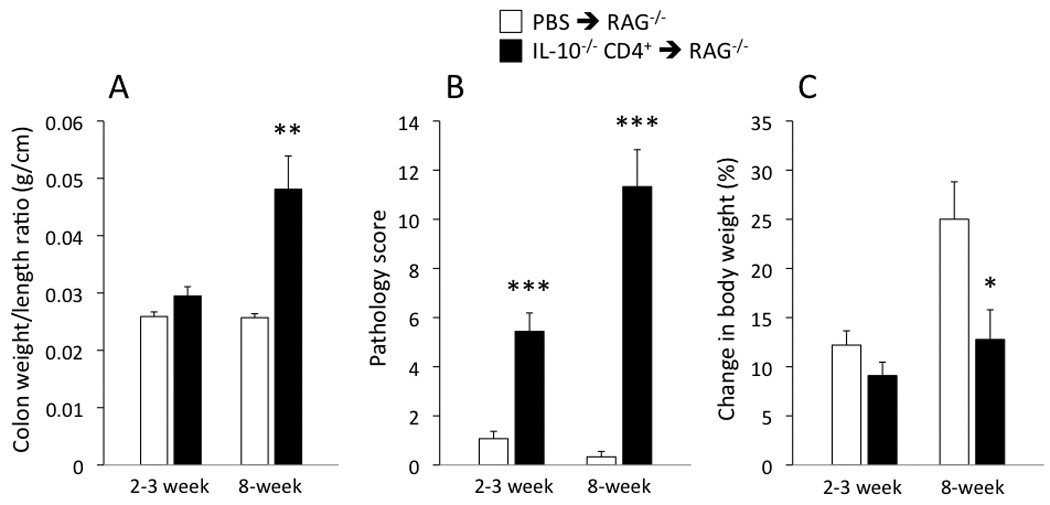
(A) Colon weight-to-length ratio, (B) pathology score, and (C) % change in body weight for the IL-10−/− CD4+ ⇒ RAG−/− mice and PBS ⇒ RAG−/− mice at the 2–3 and 8-week time points following injection. *p<0.05, **p<0.01, and *** p<0.001 vs time-matched PBS ⇒ RAG−/− mice. N=12–16 in all groups shown.
In addition to gross and microscopic evaluation of colonic inflammation, we also quantified colon blood flow in the different groups. We found that blood flow rates did not differ statistically among the groups of mice, with median values ranging between 24–33 ml/min/100 g for all four groups (2–3 and 8 weeks, in both PBS ⇒ RAG−/− mice and IL-10−/− CD4+ ⇒ RAG−/− mice). Figure 2 illustrates how colonic blood flow varied with the degree of inflammation (colon weight/length ratios) for the IL-10−/− CD4+ ⇒ RAG−/− mice at 2–3 weeks and 8 weeks post T-cell transfer. The few outlying higher flow rates were associated with more inflammation as quantified with the colon weight-to-length ratio.
Figure 2.
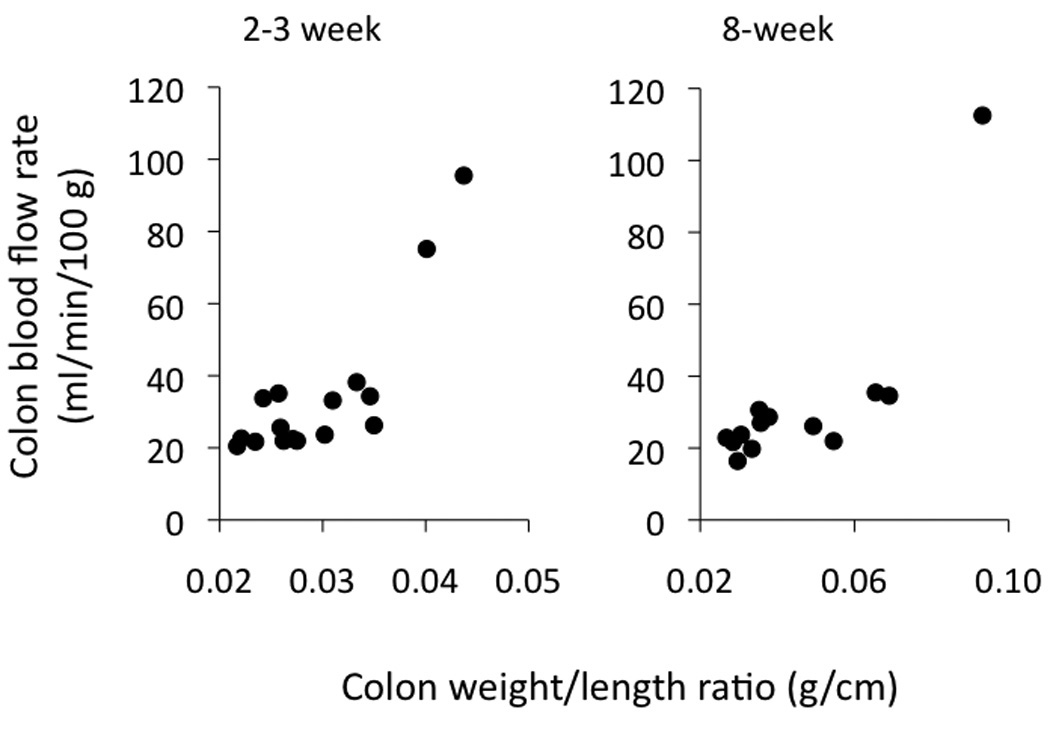
Colon blood flow rates in the IL-10−/− CD4+ ⇒ RAG−/− mice 2–3 and 8 weeks following reconstitution, as plotted vs the colon weight-to-length ratio on the x-axis. The occasional higher blood flow rates were found in the mice with higher weight-to-length ratios. Note the change in x-axis scale as the weight-to-length ratio increased with time.
In order to quantify tissue hypoxia, mice were injected (i.p.) with pimonidazole (Hypoxyprobe™) at 2–3 and 8 weeks following T cell transfer (or PBS injection). Animals were then euthanized and colon tissue sections stained for the intracellular product that is produced when the probe encounters oxygen tensions lower than 10 mmHg. As indicated in Figure 3A, no statistically significant differences were found among the four groups of mice, although the staining tended to be somewhat higher at 8 weeks. As shown in Figure 3B, the pimonidazole adducts formed more prominently in the more superficial area of the mucosa; although not shown in this example, staining was also present in the myenteric plexus of many sections.
Figure 3.
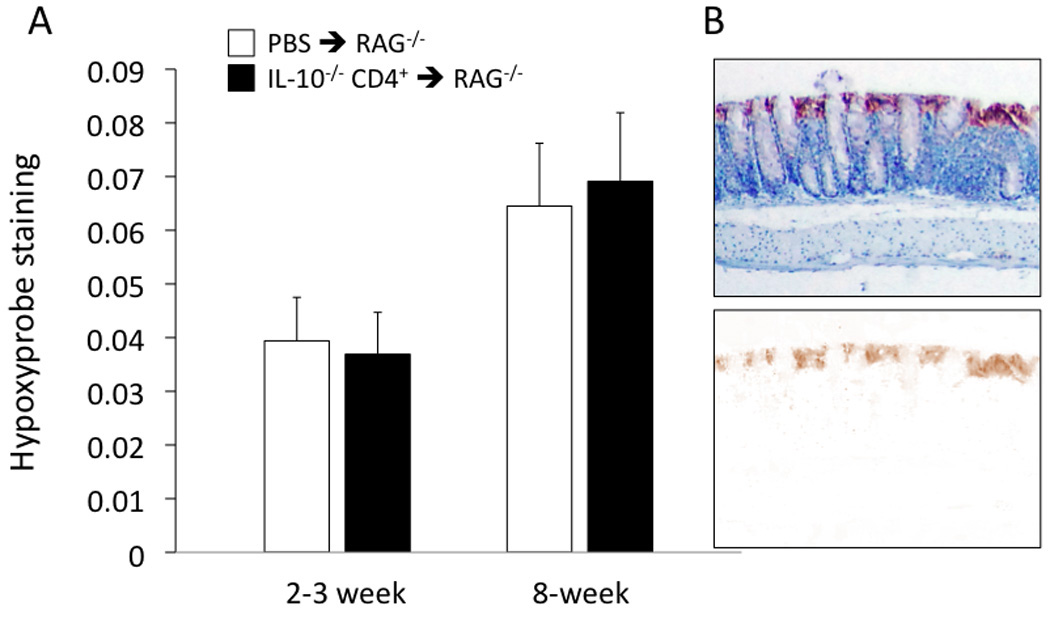
(A) Quantification of Hypoxyprobe™ staining in the colon of the IL-10−/− CD4+ ⇒ RAG−/− mice and PBS ⇒ RAG−/− mice at the 2–3 and 8-week time points following injection. No statistical differences among groups were found. N=14, 16, 11, and 15 from left to right. (B) Example of Hypoxyprobe™ staining along the mucosal surface, with blue hematoxylin used as a counterstain. In the lower picture, the blue counterstain is subtracted to reveal the brown color of the pimonidazole secondary antibody.
Interestingly, we observed significant animal-to-animal variability with respect to Hypoxyprobe™ staining within the 8-week IL-10−/− CD4+ ⇒ RAG−/− mice. In fact, further analysis revealed that this variability appeared to be dependent on both hematocrit and vascular density as shown in Figure 4, using immune-staining for endothelial cell-associated PECAM-1 as an index for colonic vascular density. The IL-10−/− CD4+ ⇒ RAG−/− mice were segregated into two equal groups consisting of lower PECAM-1 staining (unitless mean = 0.014 ± 0.002) and higher PECAM-1 staining (mean = 0.037 ± 0.009), with the latter being statistically greater compared with the low PECAM-1 subset and with the PBS ⇒ RAG−/− mice (mean = 0.017 ± 0.004). The mice with higher colonic vascular density had significantly less staining for hypoxia than the mice with lower vascular density (Fig 4A; p<0.05). A similar tendency was found in the mice with higher hematocrit vs those with a lower hematocrit. Multiple regression analysis confirmed the relationships between hypoxia and hematocrit (p<0.01) and between hypoxia and PECAM-1 staining (p<0.05), with a correlation coefficient r2 of 0.75 (Fig 4B).
Figure 4.
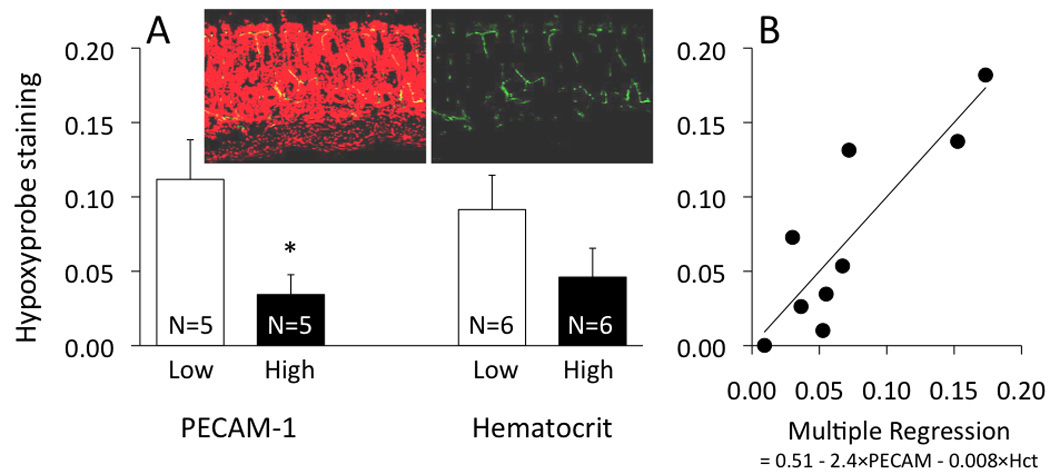
Hypoxyprobe™ staining in IL-10−/− CD4+ ⇒ RAG−/− mice at the 8-week time point, between (A) subsets of low and high PECAM-1 staining, and between subsets of low and high hematocrit, as well as (B) multiple regression with PECAM-1 and hematocrit as contributing factors (p<0.05 and p<0.01, respectively). In panel A, *p<0.05 between the low and high subset of PECAM-1 staining. The pictures inserted into panel A show PECAM-1 staining (green fluorescence) along with the nuclear counterstain propidium iodide (red fluorescence), with the red fluorescence subtracted in the picture on the right.
At 8 weeks following T-cell transfer, the remaining 16 IL-10−/− CD4+ ⇒ RAG−/− mice were euthanized and colons used for blinded histopathological evaluation and for Hypoxprobe™ determinations. Of these 16 mice reconstituted with IL-10−/− CD4+ T-cells, nine were found to have severe inflammation (scores 15–17); one expressed moderate inflammation (score of 9); and five had mild inflammation (scores of 3–4). (Fixed sections could not be obtained from the remaining mouse.) As shown in Figure 5, hypoxia was greatest (i.e., higher values of Hypoxyprobe™ staining; Fig 5A) and hematocrit was lowest (Fig 5B) in the mice with mild but not severe colitis.
Figure 5.
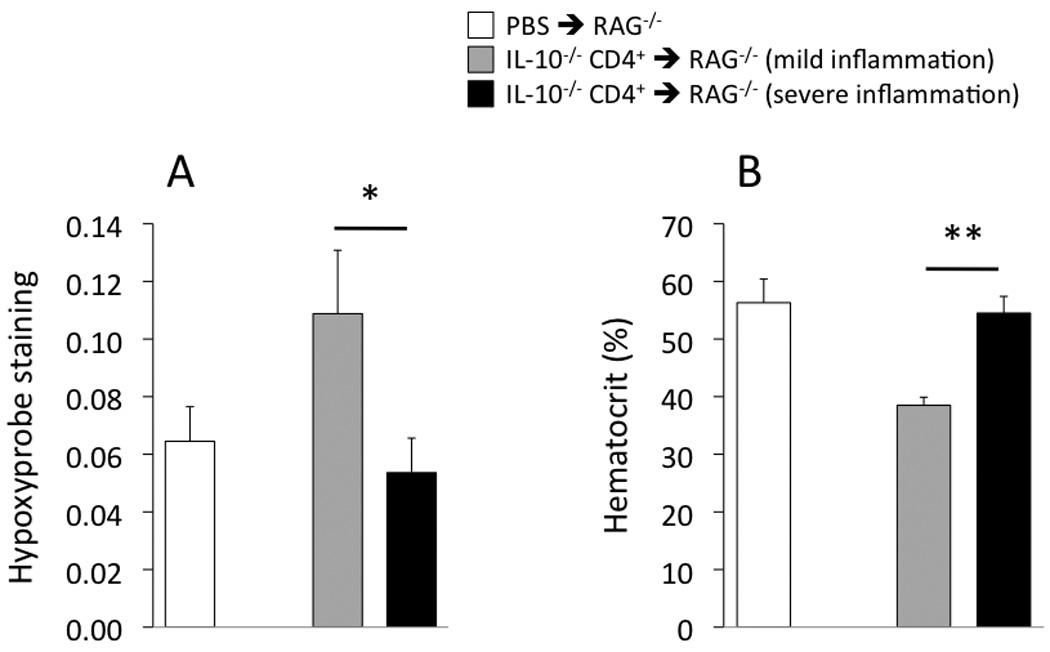
Hypoxyprobe™ staining in the colon (A) and systemic hematocrit (B) in the IL-10−/− CD4+ ⇒ RAG−/− mice and PBS ⇒ RAG−/− mice at the 8-week time point. *p<0.05 and **p<0.01 between the indicated groups. From left to right, N= 11, 5, 9 (panel A) and N= 11, 4, 8 (panel B).
DISCUSSION
To our knowledge, this is the first demonstration of colonic tissue hypoxia in a chronic T-cell transfer model of IBD. The enhanced hypoxia was observed primarily in the subset of mice with mild (rather than severe) inflammation, with the extent of hypoxia related to measures of vascular density and hematocrit, both of which are important for oxygen delivery.
The differences found between the mild and severe inflammation subsets of mice may have relevance to the clinical conditions of IBD, as described by Hulten et al. almost 30 years ago (10). In that study, the authors found colon blood flow to differ by an approximate factor of 5 between patients with severe colitis (higher flow) and mild colitis (lower flow). In a previous study with the T-cell transfer model of colitis (5), we similarly found colonic blood flow rates at the 4-week time point to differ by an approximate factor of 3 between mild and severe inflammation, with the lower flow rates found with mild inflammation. The subset of mice with mild inflammation had Doppler measures of red blood cell volume approximately one-half the values in control mice, suggesting the possibility of lower vascular density, vasoconstriction, and/or lower hematocrit. These data from our previous study, and the clinical data from Hulten et al. (10), might suggest a greater likelihood of hypoxiain the subsets of mice/humans in a mild inflammation phase of colitis.
The data from the current study tend to support this possibility, with evidence of a greater extent of hypoxia in the mild inflammation subset of mice than in the severe inflammation subset (Fig 5A). Two factors that appear to contribute to the extent of colonic oxygenation are hematocrit and vascular density (Fig 4). The reasons for lower hematocrit values in the mild inflammation subset of mice were not investigated, but could be of interest to pursue in a future study. Potential mechanisms could involve deficiencies in red blood cell production, shifts in body fluid toward the vasculature, or enhanced destruction of red blood cells. However, with respect to the latter, we did not observe free hemoglobin (red color) in the plasma samples of any of the mice in this study, which might be expected to accompany red cell destruction.
While this may be the first demonstration of enhanced hypoxia in a T-cell transfer model of colitis, previous reports indicate that the inflammatory response to rectal installation of TNBS also induces elevations in colonic hypoxia (3, 4), and also reduces capillary density and mucosal blood flow (11–13). In contrast to our T-cell transfer model, enhanced hypoxia with TNBS is not likely related to hematocrit, with the TNBS-induced increase in hematocrit speculated to be due to a fluid shift out of the circulation due to increased vascular permeability (12).
The elevations of HIFs in the TNBS model have been hypothesized to be a result of the enhanced hypoxia, and moreover, have been demonstrated to play a protective role. In mice deficient in HIF-1, TNBS-induced colitis has been found to be more severe, with the opposite seen in mice deficient in the HIF-destructive von Hippel-Lindau gene (3). Moreover, pharmacologic activation of HIF with aprolyl hydroxylase inhibitor provides protection in a murine TNBS model (4). Data from dextran sodium sulfate (DSS)-induced colitis in mice suggest a protective barrier-maintaining role for HIF-1α, at least in the early response to DSS (14). However, the authors of this latter study suggested that the sustained inflammation caused by DSS was mediated in part by HIF-2α-induced activation of the proinflammatory gene macrophage migration inhibitory factor (MIF).
In our study of chronic colitis, we saw less inflammation in the mice with elevated levels of hypoxia. This could be consistent with a hypothesis that hypoxia could stimulate protective mechanisms. However, it should be cautioned that our results are not necessarily cause-and-effect: the extent of inflammation may or may not be dependent on the state of hypoxia, and instead it could be that the extent of hypoxia is dependent on the state of inflammation. It is possible that the angiogenesis stimulated by severe inflammation may provide sufficient vasculature to prevent substantial increases in hypoxia. Future experiments may be necessary to clarify these possibilities.
In summary, the T-cell transfer model of chronic colitis induced subsets of mice with either mild colonic inflammation or severe colonic inflammation. Mice with mild inflammation were more likely to have enhanced tissue hypoxia, the measures of which were correlated significantly with hematocrit and capillary density.
ACKNOWLEDGEMENTS
Supported by the National Institute of Diabetes and Digestive and Kidney Diseases (P01DK043785; Projects 1 and 2 plus Cores B and C).
This work utilized the facilities of the Cell Biology and Bioimaging Core at the Pennington Biomedical Research Center in Baton Rouge, Louisiana, which are supported in part by COBRE (NIH P20-RR021945) and CNRU (NIH 1P30-DK072476) center grants from the National Institutes of Health.
References
- 1.Hatoum OA, Binion DG, Otterson MF, et al. Acquired microvascular dysfunction in inflammatory bowel disease: Loss of nitric oxide-mediated vasodilation. Gastroenterology. 2003;125:58–69. doi: 10.1016/s0016-5085(03)00699-1. [DOI] [PubMed] [Google Scholar]
- 2.Thornton M, Solomon MJ. Crohn's disease: in defense of a microvascular aetiology. Int J Colorectal Dis. 2002;17:287–297. doi: 10.1007/s00384-002-0408-5. [DOI] [PubMed] [Google Scholar]
- 3.Karhausen J, Furuta GT, Tomaszewski JE, et al. Epithelial hypoxia-inducible factor-1 is protective in murine experimental colitis. J Clin Invest. 2004;114:1098–1106. doi: 10.1172/JCI21086. [DOI] [PMC free article] [PubMed] [Google Scholar]
- 4.Robinson A, Keely S, Karhausen J, et al. Mucosal protection by hypoxia-inducible factor prolyl hydroxylase inhibition. Gastroenterology. 2008;134:145–155. doi: 10.1053/j.gastro.2007.09.033. [DOI] [PMC free article] [PubMed] [Google Scholar]
- 5.Harris NR, Carter PR, Lee S, et al. Association between blood flow and inflammatory state in a T-cell transfer model of inflammatory bowel disease in mice. Inflamm Bowel Dis. 2010;16:776–782. doi: 10.1002/ibd.21126. [DOI] [PMC free article] [PubMed] [Google Scholar]
- 6.Rennick DM, Fort MM, Davidson NJ. Studies with IL-10−/− mice: an overview. J Leukoc Biol. 1997;61:389–396. doi: 10.1002/jlb.61.4.389. [DOI] [PubMed] [Google Scholar]
- 7.Yen D, Cheung J, Scheerens H, et al. IL-23 is essential for T cell-mediated colitis and promotes inflammation via IL-17 and IL-6. J Clin Invest. 2006;116:1310–1316. doi: 10.1172/JCI21404. [DOI] [PMC free article] [PubMed] [Google Scholar]
- 8.Ostanin DV, Bao J, Koboziev I, et al. T cell transfer model of chronic colitis: concepts, considerations, and tricks of the trade. Am J Physiol Gastrointest Liver Physiol. 2009;296:G135–G146. doi: 10.1152/ajpgi.90462.2008. [DOI] [PMC free article] [PubMed] [Google Scholar]
- 9.Lee S, Carter PR, Watts MN, et al. Effects of the endothelin-converting enzyme inhibitor SM-19712 in a mouse model of dextran sodium sulfate-induced colitis. Inflamm Bowel Dis. 2009;15:1007–1013. doi: 10.1002/ibd.20877. [DOI] [PMC free article] [PubMed] [Google Scholar]
- 10.Hulten L, Lindhagen J, Lundgren O, et al. Regional intestinal blood flow in ulcerative colitis and Crohn's disease. Gastroenterology. 1977;72:388–396. [PubMed] [Google Scholar]
- 11.Kruschewski M, Foitzik T, Perez-Canto A, et al. Changes of colonic mucosal microcirculation and histology in two colitis models: an experimental study using intravital microscopy and a new histological scoring system. Dig Dis Sci. 2001;46:2336–2343. doi: 10.1023/a:1012334727509. [DOI] [PubMed] [Google Scholar]
- 12.Kruschewski M, Anderson T, Buhr HJ, et al. Selective COX-2 inhibition reduces leukocyte sticking and improves the microcirculation in TNBS colitis. Dig Dis Sci. 2006;51:662–670. doi: 10.1007/s10620-006-3189-9. [DOI] [PubMed] [Google Scholar]
- 13.Kruschewski M, Anderson T, Loddenkemper C, et al. Endothelin-1 receptor antagonist (LU-135252) improves the microcirculation and course of TNBS colitis in rats. Dig Dis Sci. 2006;51:1461–1470. doi: 10.1007/s10620-005-9019-7. [DOI] [PubMed] [Google Scholar]
- 14.Shah YM, Ito S, Morimura K, et al. Hypoxia-inducible factor augments experimental colitis through an MIF-dependent inflammatory signaling cascade. Gastroenterology. 2008;134:2036–2048. doi: 10.1053/j.gastro.2008.03.009. [DOI] [PMC free article] [PubMed] [Google Scholar]