

Summary
The highly conserved ESCRT-III complex is responsible for deformation and cleavage of membranes during endosomal trafficking and other cellular activities. In humans, dominant mutations in the ESCRT-III subunit CHMP2B cause fronto-temporal dementia (FTD). The decade-long process leading to this cortical degeneration is not well understood. One possibility is that, akin to other neurodegenerative diseases, the pathogenic protein affects the integrity of dendritic spines and synapses before any neuronal death. Using confocal microscopy and 3D reconstruction, we examined whether expressing the FTD-linked mutants CHMP2Bintron5 and CHMP2BΔ10 in cultured hippocampal neurones modified the number or structure of spines. Both mutants induced a significant decrease in the proportion of large spines with mushroom morphology, without overt degeneration. Furthermore, CHMP2BΔ10 induced a drop in frequency and amplitude of spontaneous excitatory post-synaptic currents, suggesting that the more potent synapses were lost. These effects seemed unrelated to changes in autophagy. Depletion of endogenous CHMP2B by RNAi resulted in morphological changes similar to those induced by mutant CHMP2B, consistent with dominant negative activity of pathogenic mutants. Thus, CHMP2B is required for spine growth. Taken together, these results demonstrate that a mutant ESCRT-III subunit linked to a human neurodegenerative disease can disrupt the normal pattern of spine development.
Keywords: ESCRT, FTLD, neurodegeneration, synapse, spine head, NeuronStudio
Introduction
The Endosomal Sorting Complexes Required for Transport are a set of four cytoplasmic protein complexes (ESCRT -0 to III), conserved from yeast to human. ESCRTs are central to a growing range of cellular activities, including the delivery of down-regulated surface proteins to the lumen of late endosomes (Hurley and Emr, 2006; Slagsvold et al., 2006), the release of viruses at the plasma membrane (von Schwedler et al., 2003), cytokinesis of dividing cells (Carlton and Martin-Serrano, 2007), and autophagy of protein aggregates (Filimonenko et al., 2007). All of these diverse processes involve the budding and fission of cellular membranes, which appear to be directly catalysed by ESCRTs. Recent results show that ESCRTs are sequentially recruited to the cytosolic side of endosomal or plasma membrane microdomains, until ESCRT-III subunits locally polymerise into filaments. Transient assembly of ESCRT-III filaments on the membrane is a physical agent of membrane deformation and vesiculation (Fabrikant et al., 2009; Hanson et al., 2008; Lata et al., 2008; Muziol et al., 2006; Saksena et al., 2009; Wollert et al., 2009; Wollert and Hurley, 2010). Hence, ESCRT-III polymers are pivotal effectors of cellular membrane restructuring.
In keeping with its potent effects, the polymerisation of ESCRT-III is normally under tight regulation. The core subunits of ESCRT-III form a family of highly related proteins, the Charged Multivesicular body Proteins (CHMP) 1–7, all of which contain a conserved oligomerisation and lipid binding interface (the ESCRT-III or SNF-7 domain), linked to a C-terminal regulatory region (see Fig. 1). This latter mediates both intramolecular inhibition of the ESCRT-III domain and intermolecular interaction with subunit-specific factors that regulate filament dynamics (Bajorek et al., 2009; Muziol et al., 2006; Stuchell-Brereton et al., 2007; Zamborlini et al., 2006). Deletion of the regulatory region converts ESCRT-III subunits into dominant negative mutants, able to block ESCRT-dependent processes such as the release of HIV-1 virions from infected cells (Zamborlini et al., 2006).
Fig. 1.

A: primary structure of CHMP2B constructs used in this study. The ESCRT-III domain is the conserved sequence domain common to all members of the Charged Multivesicular body Proteins (CHMP 1–7) superfamily. Positively (blue) and negatively (red) charged alpha helices (1 to 5) are located along the sequence according to the 3D structure of the closely related CHMP3 protein (Muziol et al., 2006). MIM: MIT (Microtubule Interacting and Transport domain) Interacting Module, required for binding to the SKD1/Vps4 ATPase responsible for dissociation of CHMP polymers. V: a single valine residue replaces the normal C terminus in CHMP2Bintron5. The green line in CHMP⊗10 indicates the aberrant C terminus carried by this mutant. Ellipses indicate tags fused to the N terminus (2×9 and 1×10 residues respectively). Sequence lengths are those of the untagged proteins.
B: subcellular distribution of tagged CHMP2B proteins. Neurones were transfected with the indicated plasmids, processed for immunofluorescence staining with anti-tag antibody, and imaged by confocal microscopy. Two representative cells are shown for each plasmid. Top: CHMP2Bwt diffuses throughout the entire neuron, including the heads of dendritic spines (arrows). Middle: CHMP2Bintron5 forms multiple small clusters in the soma and dendrites, and occasional larger aggregates. Bottom: CHMP2BΔ10 has a clustered distribution similar to that of CHMP2Bintron5.
Among ESCRT-III subunits, CHMP2B has received particular attention following the discovery that mutations in the CHMP2B gene underlie a dominantly heritable form of frontotemporal dementia (called FTD-3), a presenile brain disease due to selective degeneration of cortical neurones (Skibinski et al., 2005). In a thoroughly studied Danish kindred, the FTD phenotype was tightly linked to a single point mutation at the splice acceptor site of CHMP2B exon 6. The mutation generates two distinct aberrant transcripts, CHMP2Bintron5 and CHMP2BΔ10, both of which encode proteins with a defective C terminus (Skibinski et al., 2005) (see Fig. 1). Neurodegeneration has been hypothesized to result from perturbation of neuronal autophagy by these mutants subunits (Rusten and Simonsen, 2008). Consistent with the loss of the regulatory domain, in heterologous cells, both CHMP2Bintron5 and CHMP2BΔ10 form insoluble polymers, often coating endosomes, and cause dominant-negative inhibition of ESCRT-dependent processes including autophagosome maturation (Filimonenko et al., 2007; Lee et al., 2007; Skibinski et al., 2005). In cultured cortical neurones, overexpression of CHMP2Bintron5 was shown to induce retraction of dendritic arbors and subsequent cell death, partly through toxic build-up of autophagosomes (Lee et al., 2007; Lee and Gao, 2009). Surprisingly, however, CHMP2BΔ10 failed to increase neuronal death, even though in heterologous cells, its effects on autophagy are similar to those of CHMP2Bintron5 (Filimonenko et al., 2007). Furthermore, knock-down of CHMP2B by RNAi did not modify neuronal viability. These observations suggest that disease-linked CHMP2B mutations may affect neuronal physiology by ways other than lethal malfunction of autophagic mechanisms.
Accumulating evidence indicates that in various neurodegenerative diseases neuronal death is a late event, preceded by early disruption of dendritic spines and synapses, which itself is a pivotal pathogenic step (Morfini et al., 2009; Wei et al., 2009; Wishart et al., 2006). In FTD, extensive synaptic loss and reduction of spines have been documented in diseased cortex (Ferrer, 1999; Lipton et al., 2001). Given its role in endosomal traffic and plasma membrane deformation, ESCRT-III may plausibly control aspects of synaptic biology. Here, we examine the possible impact of CHMP2B mutants and CHMP2B depletion on the development of dendritic spines. CHMP2Bintron5 and CHMP2BΔ10 could be expressed in hippocampal neurones without causing apparent anomalies in endosomal morphology, autophagosome amount, or cell viability. The mutants potently suppressed the growth of spine heads, strongly lowering the proportion of mushroom spines. Very similar effects were obtained with an siRNA targeting endogenous CHMP2B, consistent with dominant-negative action of the mutants. Physiologically, CHMP2BΔ10 caused a drop in the frequency and amplitude of spontaneous excitatory synaptic currents, with selective disappearance of large currents. We propose that CHMP2B and potentially ESCRT-III are required for the maturation of dendritic spines, and that pathogenic CHMP2B mutants perturb this process. To the extent that maturation correlates with functional potentiation, these results implicate ESCRT-III in synaptic plasticity. In the protracted course of FTD, CHMP2B mutations may affect synaptic homeostasis and plasticity long before inducing massive neuronal death.
Materials and Methods
Plasmids and antibodies
The mCherry plasmid was a kind gift from P. Dournaud (INSERM, Paris). The LC3-GFP plasmid was a kind gift from T. Yoshimori (National Institute of Genetics, Mishima, Japan). The GFP plasmid was pEGFP-C1 (Clontech). The wild-type human CHMP2B cDNA was cloned from HeLa cells by RT-PCR, in frame with an N-terminal dimeric HA tag, using the following primer pair: 5′ CTCTCGAGGCCACCATGTACCCATACGACGTCCCAGACTACGCTTACCCATACGA CGTCCCAGACTACGCTGCGTCCCTCTTCAAGAAGAA 3; and 5; TACTCGAGCTGCAGTCACTAATCTACTCCTAAAGCCTTGAGT 3;. The CHMP2Bintron5 mutant cDNA was amplified from the same cDNA preparation, using an alternate rearward primer (5; TACTCGAGTCACACCTTTCCAGAAATTTCAAT 3;). The two cDNAs were subcloned in pcDNA3.1 between the XhoI sites. To obtain the CHMP2BΔ10 cDNA, the C-terminal part was first synthesized in vitro using megaprimers (5; ATGCCCAGGATATTGTGAATCAAGTTCTTGATGAAATTGGAATTGAAATTTCTGGAAAGGTGTTGCACCAACTTCTAGAAGCTTACC 3; and 5; TAATCTTGAATTGCCATTTAGACGCTTCATCTGTGATGTAGACGTTGTAGTAAAGGTAAATGGTAAGCTTCTAGAAGTTGGTGCAAC 3;) and then fused with the CHMP2Bintron5 cDNA. The cDNAs was subcloned in pcDNA3.1 between the EcoRV and NotI sites. The pSuper-mCherry plasmid was constructed by removing GFP from pSuper-Neo-GFP (Oligoengine) and replacing it with mCherry. The shRNA targeted the rat CHMP2B sequence at positions 578–596 (5; GACACTACAAACAATGCAG 3;) according to (Lee et al., 2007), and the encoding oligonucleotide was cloned between the Hind III and Bgl II sites of pSuper-mCherry. The RNAi resistant CHMP2B cDNA was generated by introducing four silent mutations in the target sequence (yielding 5; GACGTTACAGACGATGCAA 3;) by means of the Quick-Change mutagenesis kit (Stratagene). All plasmids were verified by sequencing (Cogenics, Meylan, France) and initially tested in transfected BHK cells by immunoblotting and immunofluorescence with anti-tag antibody. The following polyclonal antibodies were purchased from Abcam (Cambridge, UK): anti-CHMP2B, anti-EEA1, anti-LAMP1. Anti-HA tag antibody was from Cell Signaling Technology (Beverly, Massachussets); anti-myc tag antibody from Santa Cruz (California); and anti-actin antibody from Chemicon.
Neuronal culture and transfection
Primary cultures of hippocampal neurones were prepared according to a modification of the procedure described in (Banker and Goslin, 1998). Handling and sacrifice of animals were in conformity with European law (EEC Directive n° 86/609) and the internal regulations of INSERM. Hippocampi were dissected out from E19 rat embryos, digested with trypsin, and hippocampal cells were seeded at a density of 12,000 per cm2 onto acid-washed glass coverslips (13 mm diameter, Marienfeld, Germany) that had been precoated with 50 μg/ml poly-D-lysine (Sigma). Cultures were maintained in serum-free Neurobasal medium containing 2 mM glutamine, 1 mM sodium pyruvate, 10 μg/ml penicillin and streptomycin, and 2% B27 supplement (Invitrogen). For transfection, all plasmids were purified using the Endotoxin-free purification kit (Quiagen, Hilden, Germany). Preliminary experiments established that CHMP2Bintron5 toxicity was minimal when transfected at the dose used here. The conditioned culture medium was removed and saved and coverslips were placed in 2 ml Minimal Essential Medium (Invitrogen) containing 2 mM glutamine, 1 mM sodium pyruvate, 15 mM Hepes: NaOH (pH 7.35). 0.5 μg CHMP2B plasmid (or control vector) was mixed with 2.5 μg mCherry, GFP, or LC3-GFP plasmid, diluted into 250 μl transfection medium, and combined with 1.5 μl of “Plus” Reagent and then 4 μl Lipofectamine LTX (Invitrogen). The mixture was incubated for 25 min at room temperature, then added to the dishes, which were left to incubate at 37°C for 1h. The transfection solution was removed and the conditioned medium was returned to the dishes. 20–60 neurones per coverslip were usually transfected.
Fixation and immunostaining
The coverslips were rinsed in PBS and incubated for 8 min in PBS containing freshly prepared 4% p-formaldehyde and 4% sucrose at room temperature (RT). After 3–4 washes in PBS, the cells were permeabilised by incubating in PBS containing 0.3% Triton X-100 for 10 min at RT. After washing, coverslips were pre-incubated in blocking solution (PBS containing 2% goat preimmune serum and 1% bovine serum albumin (Sigma-Aldrich)) for 1 h, then in blocking solution containing 0.5–1 μg/ml primary antibody (or antibody mixture) at RT. After washing, incubation with secondary antibody conjugated to Alexa488 or Alexa594 (Molecular Probes, 0.2 μg/ml) and final washes, coverslips were gently dried, and mounted on slides in Mowiol medium. The specificity of immunofluorescence was routinely verified by staining control cultures that had been transfected with empty pcDNA vector (for anti-tag antibodies) or by omitting the primary antibody in control incubations. The specificity of CHMP2B antibody was further confirmed by RNAi-mediated extinction of immunofluorescence.
Microscopy
Images of fluorescent neurones were acquired with a Leica SP-E laser scanning confocal microscope equipped with a 100× Leica Neofluar objective with NA=1.3. Laser power was adjusted to maximize the dynamic range of each sample. For dual-colour samples, the adjustable spectral window of fluorescence collection was set for each channel with a singly coloured control sample, so that cross-contamination between channels was avoided. Stacks of 0.2 μm-spaced optical sections were acquired (averaging over 4 scans per pixel, 512 × 512 pixels) with the required electronic magnification. For spine analysis, any neuron showing signs of neuritic swellings or retraction was excluded. Dendritic segments located at approximately equivalent distances from the soma were selected, and each of those was scanned at 1.5× electronic zoom.
Image analysis
Image files were processed with Metamorph (Molecular Imaging). All figures show maximal intensity projections. For analysis of spines, serial image files corresponding to z-stacks of 20–30 optical sections per dendritic segment were directly processed with Neuron-Studio, a software package specifically designed for spine detection and analysis (Rodriguez et al., 2008; Rodriguez et al., 2006)(http://www.mssm.edu/cnic/tools.html). Voxel size was 0.143 × 0.143 × 0.200 μm. The fluorescence threshold for inclusion in objects was dynamically set for each local sampling of the dendrite surface by the Isodata segmentation algorithm implemented in NeuronStudio. The seed location for automatic dendrite tracing was typically set near the base of a major proximal dendrite. At bifurcation points, the attach ratio was 1.5 and neurites shorter than 5 μm were not retained. After modelling of the dendrite surface, protrusions with a minimum volume of 5 voxels (0.020 μm3), length comprised between 0.2 μm and 3 μm, and a maximal width of 3 μm were retained as spines. Following defaults settings of the program and the empirical classification rule defined by (Rodriguez et al., 2008), spines with minimum head diameter of 0.35 μm and minimum head vs. neck ratio of 1.1 were classified as mushroom spines. Non-mushroom spines with minimum volume of 10 voxels (0.040 μm3) were classified as stubby spines. All other spines were considered thin. The typical percentages of the three spine types which we obtained were close to those found by (Rodriguez et al., 2008). Measurements obtained by NeuronStudio were transferred to a spreadsheet (Excel or Gnumeric) for analysis. Sholl analysis was also performed with NeuronStudio, using single-plane, lower magnification views centred on the cell soma. For each neurone, a series of 2 μm-spaced concentric circles centred on the soma were drawn as reference marks, starting with a circle just large enough to enclose the cell body. The total length of neurites comprised within two consecutive circles was measured, and the measurement was repeated for increasingly large circle radii. Stepwise increases in neuritic length were plotted as a function of radial distance from the soma.
Cell degeneration assay
Neurones were transfected with 0.5 μg CHMP2B plasmid and 2.5 μg mCherry as above. After fixation and mounting onto slides, neurones were observed under an epifluorescence microscope (Zeiss Axiovert 200M) with a 63× objective (1.3 NA) and a rhodamine filter, and scored as dead or alive according to morphological criteria (see text). The actual presence of co-expressed CHMP2B was verified by immunofluorescent staining with anti-tag antibody, using the GFP filter.
Electrophysiology
Spontaneous tetrodotoxin-resistant miniature excitatory postsynaptic currents (mEPSCs) were recorded by means of the whole-cell configuration of the patch clamp method (Hamill et al 1981). The recording medium contained (in mM): 136 NaCl, 5 KCl, 2 CaCl2, 1 MgCl2, 10 HEPES, 10 glucose, 0.0005 TTX, 0.025 D-APV, pH 7.4 (NaOH). Patch pipettes were made with the DMZ Universal Pipette puller (Zeitz Instruments, Germany) from thick wall borosilicate glass capillaries (1.5 mm o.d. × 0.86 mm i.d) (Clark Electromedical Instruments, Phymep, France). Filled with a medium consisting of (in mM): 130 Cs-gluconate, 5 EGTA, 1 MgCl2, HEPES, 4 Na2-ATP, pH 7.2 (CsOH), they had a resistance of 3 to 4 MΩ. Glass coverslips were put on the stage of an upright Olympus microscope (BX51WI, Olympus, France) equipped with a water immersion objective lens (×20, N.A. 0.95, Olympus, France). GFP-expressing cells were voltage clamped at a holding potential of −70 mV and the mEPSCs were recorded and then analyzed off-line by means of the pClamp software (Molecular Devices, Dipsi, France). Synaptic currents, filtered at 1 kHz, were sampled at 10 kHz on an Axoclamp 200B amplifier (Molecular Devices, Dipsi, France). The experiments were conducted at room temperature (20–22°C).
Western immunoblotting
Neurones were plated in plating medium at a density of 24, 000 cells per cm2 onto 35 mm plastic dishes (Nunc) that had been pre-coated with 50 μg/ml poly-D-lysine, and grown as described for coverslips. Sister dishes were withdrawn at the indicated time points and cells were lysed in lysis buffer containing 1% Triton-X100, 0.2 % SDS, 10 mM NaF, 10 mM β-glycerophosphate (pH=7.5) and protease inhibitor mixture (Complete, Roche Molecular), and frozen. All lysates from a given culture were loaded on the same 10% SDS-polyacrylamide gel (10μg total protein per lane) and analysed by electrophoresis and immunoblotting with anti-CHMP2B antibody and anti-actin antibody. Bands were revealed by chemiluminescence (Pierce Femto reagent). Luminographs were scanned (300 dpi, 8-bit scale) and the resulting image files were analysed with Metamorph. Grey levels measured for CHMP2B bands were normalized to the corresponding actin bands.
Statistical analysis
The statistical significance of overall variations within sets of conditions was determined by one-way ANOVA. The significance of pair-wise differences between conditions was then assessed by post-hoc one-tailed t tests using the Bonferroni method. Unless indicated otherwise, all the reported p values refer to the difference with the control condition. We verified that criteria for robust ANOVA were satisfied; moreover Kruskal-Wallis analysis of mean rank variance yielded the same qualitative results as ANOVA. For analysis of mEPSC frequency, the significance of the transfection effect was confirmed by two-way ANOVA on a balanced subset of mEPSCs, separating the effect of plasmid identity from intrinsic neurone-to-neurone variation due to the variability of innervation in the culture. The significance of differences between multiple frequency distributions was assessed with the χ2 test. A post-hoc test of pairwise differences used the Marascuilo procedure (NIST Handbook of statistics, http://www.itl.nist.gov/div898/handbook//). For Sholl analysis, curves were compared by two-way ANOVA, separating the effect of plasmid identity from that of radial distance. Post-hoc comparisons between curves were performed by the Bonferroni method. All calculations were performed with the statistics-oriented spreadsheet Gnumeric (http://projects.gnome.org/gnumeric/) or with OpenStat (http://statpages.org/miller/openstat/). All error bars show S.E.M.
Results
Expression of CHMP2B variants in hippocampal neurones
To study the neuronal effects of CHMP2B proteins, hippocampal neurones were transfected at 10 DIV with plasmids encoding N-terminally tagged CHMP2Bwt, CHMP2Bintron5, or CHMP2BΔ10 (Fig. 1). Using immunofluorescent staining with anti-tag antibody, expression of these plasmids could be reliably detected up to 5 days after transfection. The subcellular distribution of the mutant proteins clearly differed from that of wild-type (Fig. 1B; Fig. 2, left; Fig. 3, left). Wild-type CHMP2B was homogeneously distributed throughout the entire neuronal cytoplasm, including axons, dendrites and dendritic spines (Fig. 1B, arrows). By contrast, both CHMP2Bintron5 and CHMP2BΔ10 formed varying numbers of small bright puncta, found in the soma and proximal dendrites. Larger aggregates were occasionally observed in the soma. To determine whether expression of CHMP2B mutants perturbed autophagy in our system, we performed co-transfection experiments with LC3-GFP as an autophagosome marker. In a vast majority of neurones, expression of either CHMP2BΔ10 or CHMP2Bintron5 failed to induce clustering of LC3-GFP (Fig. 2, b2, c2). In support of this, despite evaluation by two independent investigators, we could not detect any autophagy-associated drop in the diffuse pool of LC3-GFP. Thus in the present setting, pathogenic CHMP2B mutants did not significantly enhance autophagosome accumulation. Furthermore, to determine whether the mutant CHMP2B puncta observed in transfected neurones were related to endosomes, transfected neurones were doubly stained with anti-tag antibody, and antibodies raised against the early endosomal marker EEA-1 (Fig. 3, a2–c2) or the late endosomal/lysosomal protein LAMP-1 (Fig. 3, d2–f2), respectively. No colocalisation was observed with these markers. These data suggest that the CHMP2B aggregates which form under our transfection conditions are not associated with endosomes.
Fig. 2.

lack of LC3-GFP clustering in neurones expressing mutant CHMP2B. Neurones were co-transfected at 10 DIV with the indicated CHMP2B plasmids (left), together with the autophagosomal marker LC3-GFP. The cells were fixed 5 days later and processed for immunofluorescence staining with anti-tag antibody and Alexa594-coupled secondary antibody. Confocal images were acquired in both the immunofluorescence and GFP channels. Diffuse LC3-GFP localisation predominated upon cotransfection with CHMP2Bwt (a1,a2), CHMP2BΔ10 (c1,c2) and in a large majority of cases with CHMP2Bintron5 (b1,b2). Autophagosome accumulation was seen in rare cells transfected with CHMP2Bintron5 (b3, b4, arrow). Arrowhead: no autophagosomes were detected in the dendrites. Scale bars: 10 μm.
Fig. 3.

non-endosomal localisation of exogenously expressed CHMP2B proteins in hippocampal neurones. The neurones were doubly stained with monoclonal anti-tag antibody (a1– f1) together with polyclonal antibody against the respective marker (a2-f2), as indicated. Immunofluorescence was recorded by dual-channel confocal microscopy. Arrows indicate CHMP2B puncta. Note that they do not coincide with EEA1 (a2–c2) or LAMP1 (d2–f2) puncta. Scale bar: 10 μm.
To visualize the morphology of neurones that had been expressing mutant CHMP2B for several days, the cells were co-transfected with CHMP2B constructs and a plasmid encoding fluorescent protein mCherry, allowing staining of the whole cytosol. Five days after transfection, 75–80 % of neurones co-transfected with empty vector, CHMP2Bwt, or CHMP2BΔ10, and 55% of neurones co-transfected with CHMP2Bintron5 were healthy as judged from the overall integrity of their neurites and the absence of neuritic swellings (Fig. S1). These percentages did not change much after 10 days, and were largely sufficient to allow meaningful analysis of dendritic arbors and spines. Only healthy neurones were retained for further analysis. The effect of CHMP2B constructs on dendritic arborisation was determined by Sholl analysis of neuronal morphology. For this, we measured the rate of increase in total neuritic length as a function of radial distance from the cell body (Fig. S2). CHMP2Bwt and CHMP2BΔ10 had no significant effect on arborisation. CHMP2Bintron5 induced a moderate (25%) decrease in average branching rate, but not the large-scale retraction of dendrites that accompanies lethal perturbations of ESCRT-III (Lee et al., 2007).
CHMP2B mutants affect dendritic spine density and morphology
The dendritic morphology of neurones co-transfected with mCherry and CHMP2B plasmids was examined in detail by 3D confocal imaging of mCherry fluorescence. Fig. 4A(a–d) shows representative views of neurones transfected with the different CHMP2B constructs. Stacks of serial optical sections were produced for each neuron and the NeuronStudio software package (Rodriguez et al., 2008; Rodriguez et al., 2006) was then used to generate three-dimensional reconstructions of dendritic arbors and spines, and to count, measure and classify spines (see Materials and Methods). Fig. 4B shows a reconstructed dendritic segment obtained from a typical control neurone, and the results of automated identification of spine types. The volumes of the reconstructed spines followed a statistical distribution which closely resembled that described in a recent study of hippocampal spine dynamics (Yasumatsu et al., 2008) (Fig. S3). Furthermore, the peak of our distribution (between 0.050 and 0.075 μm3) was in the same range as published values (0.058+/−0.034 μm3) previously obtained by electron microscopy for the spines of hippocampal neurones in dissociated culture at 14 DIV (Boyer et al., 1998). The distribution of spine lengths was also similar to previously published values (Fig. 4G). These data indicate that analysis by NeuronStudio correctly detected the spine population in our cultured neurones.
Fig. 4.

detection and classification of dendritic spines in transfected hippocampal neurones. A: neurones were co-transfected with the indicated constructs, together with mCherry, fixed 5 days later, and images of mCherry fluorescence were acquired by confocal microscopy. The figure shows maximal intensity projections of confocal image stacks. Control: empty pcDNA3 vector. The boxed regions in a–d (scale bar: 10 μm) were scanned at higher magnification in a1–d1 (scale bar: 5 μm). B: stacks of optical slices acquired in A served to generate 3D models of the dendrite, using the surface-defining Ray Burst algorithm implemented in NeuronStudio (Rodriguez et al., 2006). The dimensions of the modelled structures were automatically measured as described by (Rodriguez et al., 2006), and used to identify and classify spines. Left: surface rendering of a segment from the dendrite shown in b1. Middle: maximal intensity projection of optical sections from the same segment. Right: automated spine detection and classification. Appropriately coloured dots are superimposed onto the spines. Yellow (t): thin spines; red(m): mushroom spines; blue (s): stubby spines.
The density of spines (pooling all spine types) detected by this technique was determined for each neurone (Fig. 5A, B). Over-expression of tagged, wild-type CHMP2B did not change the average density compared to control (cotransfection with empty vector). By contrast, expression of CHMP2Bintron5 raised the average density of spines by 64% compared to control (Fig. 5A, col.3). However, many of these additional spines were very small (see below). Neurones expressing the CHMP2BΔ10 mutant also had a tendency to increase the density of their protrusions (average density 24% higher), but this trend did not reach significance (Fig. 5A, col. 4). To investigate the possible effect of CHMP2B mutants on spine dimensions, we determined the mean length of spines and the mean diameter of spine heads for each neuron. None of the CHMP2B constructs modified spine length (Fig. 5C,D). Wild-type CHMP2B did not change spine head diameter either. By contrast, mutant proteins strongly affected spine diameter. Expression of CHMP2Bintron5 induced a 40% reduction in average spine diameter while CHMP2BΔ10 reduced average diameter by 32% (Fig. 5E,F). These changes in average spine dimensions reflect the selective loss of large-headed spines. Fig. 5G,H shows the normalised distributions of spine lengths and spine head diameters in neurones transfected with each of the four plasmids. Both mutants had a clear, comparable effect on the distribution of spine diameters (Fig. 5H). In control neurones, thin spines (diameter <0.2μm) predominated on top of a distinct population of larger spines, represented as a shoulder and tail in the distribution (interquartile range (IQR), 5.98 μm). This subset of larger spines was still present in neurones transfected with CHMP2Bwt (IQR, 6.00 μm), but strongly reduced following transfection with either CHMP2Bintron5 (IQR, 2.89 μm) or CHMP2BΔ10 (IQR, 3.12 μm). As spines with similar head width may differ in their neck, with important consequences for their physiology (Noguchi et al., 2005), we determined how CHMP2B mutants affected the basic morphological categories of spines. Fig. 5I shows that neurones expressing either mutant had an abnormally low fraction of mushroom spines, identified by their head vs. neck width ratio. The fraction of spines with mushroom morphology was decreased by ~50% with both CHMP2Bintron5 and CHMP2BΔ10, as they were replaced by an enlarged proportion of thin spines. Stubby spines were also reduced, but to a smaller extent, by expression of CHMP2Bintron5. The average diameter of spines in the mushroom spine subset (0.56 μm) did not significantly change in cells transfected with the mutants, confirming the consistency of morphotype identification. Taken together, these data indicate that expression of a mutant ESCRT-III subunit linked to a human neurodegenerative disease can strongly affect the density and morphology of dendritic spines, and disrupt the normal pattern of spine development.
Fig. 5.
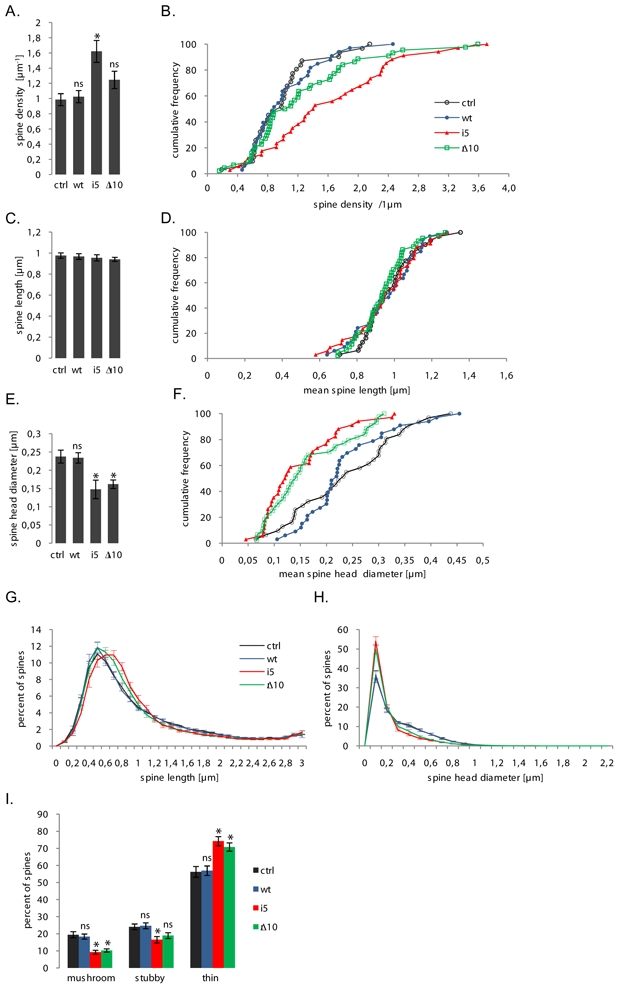
effects of FTD-linked CHMP2B mutants on the density and dimensions of spines. All parameters were measured on the same sets of neurones (pooled from 3 independent cultures). Ctrl: control plasmid (n=31 neurones); wt: tagged wild-type CHMP2B (n=33 neurones); i5: CHMP2Bintron5 (n=34 neurones); Δ10: CHMP2BΔ10 (n=44 neurones). Measurements were obtained from 700–1500 μm dendrite and 600–1200 spines per neurone. A: mean spine counts per μm dendrite in neurones co-transfected with mCherry and the indicated plasmids. CHMP2Bintron5 increases the total density of spines (*p = 0.0005). The increase caused by CHMP2BΔ10 remains non-significant (ns) with p=0.09. B: cumulative frequency histogram of spine densities per neurone, corresponding to the dataset in A. C: mean length of spines per neurone. No significant difference was observed between conditions. D: cumulative frequency histogram of mean spine length per neuron, corresponding to dataset in C. E: Mean diameter of spine heads per neurone. Both mutants cause an overall shrinkage of spine heads (*p=0.0005 for both mutants). F: cumulative frequency histogram of mean spine head diameters per neuron, corresponding to the dataset in E. G: normalized distribution of spine lengths per neuron. Spine length histograms obtained for each neuron (0.1 μm-wide bins) were normalized to 100 total counts. The distribution shows the mean normalized values of each bin, for the respective neurone group. Error bars: S.E.M. for each bin. H: normalized distribution of spine head diameters per neurone. Spine diameter histograms obtained from each neuron were normalized and averaged as in F. Note the coincidence of the control and wild-type distributions, and that of the two mutant distributions. I: effects of FTD-linked CHMP2B mutants on the morphological type of spines. Histogram shows the mean percentages per neurone of spines with mushroom-like, stubby and thin morphologies. Both mutants potently reduce the mushroom spine fraction (*p<0.000001 for both mutants). CHMP2Bintron5 also reduces the fraction of stubby spines (*p=0.005) but CHMP2BΔ10 does not (p=0.09). Conversely, both mutants increase the thin spine fraction (*p=0.0001 for both mutants).
A CHMP2B mutant affects miniature excitatory synaptic currents
To determine whether the effects of mutant CHMP2B on spine morphology correlated with functional changes at synapses, we recorded excitatory synaptic currents from cultured hippocampal neurones that had been co-transfected with GFP together with empty vector, or with vectors encoding wild-type CHMP2B or CHMP2BΔ10. Transfected cells were identified by GFP fluorescence. We monitored the frequency and amplitude of miniature excitatory postsynaptic currents (mEPSCs) as an indicator of possible effects of plasmids on synaptic strength. In total, 16 out of 18 transfected neurones were synaptically active; the two inactive neurones were discarded from analysis. Sample traces representative of each transfection condition are shown in Fig. 6A. A sequence of 128 consecutive mEPSCs was randomly picked from each recording, and the sequences were pooled according to the transfected plasmid. Mean inter-event intervals were calculated for each pool. Intervals were significantly longer between mEPSCs observed in neurones expressing CHMP2BΔ10 than in controls (Fig. 6B). Thus, the mean frequency of mEPSCs was lower in CHMP2BΔ10–expressing cells than in control cells (1.47 vs. 1.94 Hz), indicating a decrease in synaptic activity (Fig. 6B). The mean amplitude was slightly lower in mEPSCs of cells transfected with CHMP2BΔ10 than in those of control- or CHMP2Bwt-transfected neurones (12.6 vs. 13.6 pA) (Fig. 6C). However, cumulative amplitude histograms indicated that CHMP2BΔ10 caused a significant reduction in the frequency of large amplitude events, i.e. those belonging to the top quintile (Fig. 6D). mEPSCs with amplitude larger than 20 pA (approximately twice the median amplitude), which represent up to 19% of mEPSCs in control neurones, were reduced by a third in neurones expressing CHMP2BΔ10. Conversely, in these latter cells the proportion of small amplitude events (<5pA) raised from 6.8% to 10% (Fig. 6E). The drop in the frequency of large currents was not observed in neurones that overexpressed CHMP2Bwt. In view of the known correlation between spine head size and amplitude of AMPA receptor-mediated synaptic currents (Matsuzaki et al., 2001), these data are consistent with the morphologically observed reduction in mushroom spines. Mutant CHMP2B may cause a reduction in the proportion of the more potent synapses, and an increase in the proportion of weak synapses.
Fig. 6.

electrophysiological effects of wild-type and mutant CHMP2B. Miniature excitatory currents were recorded from transfected neurones under voltage clamp in the whole-cell configuration, in the presence of tetrodotoxin and D-APV to isolate AMPA receptor-mediated spontaneous synaptic currents (control: n=4 cells; CHMP2Bwt: n=6 cells; CHMP2BΔ10: n=6 cells). A: representative sample traces from neurones co-transfected with GFP and control plasmid (top), CHMP2Bwt (middle), and CHMP2BΔ10 (bottom). B: mean duration of inter-event intervals along sequences of mEPSCs pooled from equivalently transfected neurones (control: n=516 events; CHMP2Bwt: n=768 events; CHMP2BΔ10: n=768 events). Compared to control, intervals were significantly longer in mEPSCs from CHMP2BΔ10-expressing neurones (*p=0.00001), but not from CHMP2Bwt neurones (p=0.05, alpha=0.017). C: mean amplitude of mEPSCs from the different transfection groups. The overall variation of mean amplitude as a function of transfected plasmid was significant (ANOVA: F2,2049 = 3.04, p=0.048); the specific difference between the means of CHMP2BΔ10 and control was barely below threshold (*p=0.026 with Bonferroni-corrected alpha=0.025). D: cumulative histogram of mEPSC amplitudes; same dataset as in C. * indicates significant reduction in the top quintile in the case of CHMP2BΔ10 (see text and panel E). F: histogram of mEPSC amplitudes showing the specific reduction in the proportion of large currents (>20 pA) and the increase in small currents. S, i < 5pA; M, 5 <= i <=20 pA; L, i>20 pA. The two dashed lines refer to the respective proportions of large and small currents in the control neurones. The proportion of large currents was lower in neurones transfected with CHMP2BΔ10 (*p<0.05).
Endogenous CHMP2B is required for maturation of dendritic spines
As dysregulated CHMP2B mutants affect spine morphogenesis, the question arises whether the endogenous normal protein plays some role in this process. Endogenous CHMP2B was clearly detectable in extracts from cultured neurones at 8 DIV, and increased in older cultures, in which synaptogenesis and spine maturation are known to take place (Fig. 7). Immunofluorescent staining of the neurones with the anti-CHMP2B antibody showed the protein to be widely distributed throughout soma, axons and dendrites, similar to data obtained with the tagged wild-type protein (Fig. 8). To disrupt endogenous CHMP2B expression, we transfected cultured hippocampal neurones at 10 DIV with a pSuper-based plasmid vector encoding a previously described CHMP2B-specific shRNA (Lee et al., 2007). The efficiency of RNAi was ascertained by Western blotting of transfected BHK cells (Fig. 8A). Transfected neurones could be tracked and outlined by mCherry, co-expressed from the same plasmid. Immunofluorescent staining with anti-CHMP2B antibody confirmed the efficient down-regulation of endogenous CHMP2B expression in transfected neurones (Fig. 8B, middle panel). In agreement with published results (Lee et al., 2007), the CHMP2B shRNA did not affect neuronal viability. To verify the target specificity of RNAi, control experiments were performed in which CHMP2B shRNA was co-expressed with an RNAi-resistant CHMP2B mRNA (called CHMP2B*) (Fig. 8B, lower panel). Confocal imaging of mCherry and spine analysis were performed as in the case of mutant CHMP2B (Fig. 8C, Fig. 9).
Fig. 7.

endogenous CHMP2B increases during neuronal maturation in culture. Sister cultures of hippocampal neurones maintained in plastic dishes were lysed at the indicated timepoints. The lysates were analysed by SDS-polyacrylamide gel electrophoresis and Western immunoblotting with anti-CHMP2B antibody. The blots were reprobed with anti-actin antibody to normalize for loading error. A: representative blot. Leftmost lane: rat brain lysate, showing the pattern of CHMP2B in vivo. B: films were scanned and the optical density of the CHMP2B band was measured in grey levels for each lane. Band intensities were normalized by dividing each value by the intensity of the actin band in the same lane. Care was taken to obtain immunodetection in the linear range. The graph shows mean normalized intensities at 3 timepoints (n=3 cultures). Error bar: S.E.M.
Fig. 8.

knock-down of endogenous CHMP2B in hippocampal neurones. A: to verify the efficacy of the shRNA-encoding plasmid, the indicated plasmids were transfected in rodent (BHK) cells and equal protein amounts of transfected cell lysates were analysed by Western immunoblotting with anti-CHMP2B antibody, or with anti-actin as a control. Lane 1: empty pSuper-mCherry plasmid; lane 2: shRNA-expressing plasmid; lane 3: shRNA-expressing plasmid cotransfected with vector encoding CHMP2B* (native CHMP2B cDNA with silent mutations at the siRNA target site). Note that the CHMP2B protein remaining after transfection of the shRNA plasmid largely originates from non-transfected cells in the culture. B: neurones were transfected at 10 DIV with the plasmids indicated on the left, fixed at 15 DIV, and stained with anti-CHMP2B antibody and Alexa488-labelled secondary antibody. Confocal images were acquired in both the Alexa488 and mCherry channels. Representative images of transfected neurones are displayed. Control: empty pSuper-mCherry vector. Note the drop in immunofluorescence in the shRNA-expressing neuron (arrow), compared to surrounding cells; and the decreased green vs. red ratio (overlay), compared to control or rescued cells. Scale bar: 10 μm. C: maximal intensity projections of image stacks, showing representative dendritic segments visualized by mCherry fluorescence in neurones transfected with the indicated plasmids.
Fig. 9.

effects of CHMP2B depletion on the density and morphology of dendritic spines. All parameters were measured as in Figs. 3 and 4. Ctrl: n=42 cells; shRNA: n=48 cells; shRNA together with rescuing CHMP2B: n=25 cells. A: the mean density of spines varied as a function of CHMP2B depletion (ANOVA: F 2,112 = 3.80, p = 0.025) although pairwise differences with control remained below significance (*p=0.021 vs. rescued cells). B: cumulative frequency histogram of spine densities per neurone (normalized in percent), same data as in A. C: CHMP2B depletion had no effect on the mean spine length per neuron. D: cumulative frequency histogram of spine lengths. E: mean spine head diameter per neurone. The CHMP2B shRNA induces a highly significant decrease (*p<0.001) which is rescued by re-expression of CHMP2B (ns, p=0.19). F: cumulative frequency histogram of spine head diameters. G: normalized distribution of spine head diameters. Note the superposition of “control” and “rescued” curves, and the recovery of larger spines in the “rescued” profile. H: proportions of basic spine types. The CHMP2B shRNA potently decreases the mushroom spine fraction (*p<0.001) and the effect is suppressed in the rescued cells (ns, p=0.028, corrected alpha = 0.017).
Depletion of endogenous CHMP2B increased the average density of spines, and the increase was fully reversed upon rescue by CHMP2B* (Fig. 9A,B). CHMP2B depletion did not significantly affect the length of spines (Fig. 9C, D). In contrast, a highly significant reduction in mean spine diameter per neurone was observed in shRNA-transfected cells compared to controls; this was rescued to a near-normal value upon co-expression of CHMP2B* (Fig. 9E,F). Similar to the case of neurones transfected with mutant CHMP2B, the size distribution of spine heads showed a loss of the large spine subset; this loss was largely reversed by rescue with RNAi-resistant CHMP2B (Fig. 9G). Spine classification revealed a two-fold drop in the average proportion of mushroom spines, from 17% in control neurones to 9% in shRNA-transfected cells (Fig. 9H). This effect is equivalent to that observed upon expression of mutant CHMP2B. Upon co-expression of CHMP2B*, the average proportion of mushroom spines could be rescued to 13%, at which level the difference with control neurones was no longer significant (Fig. 9H). This demonstrates the specificity of CHMP2B shRNA effects. Taken together, these results indicate that CHMP2B is required for spine head expansion, a basic structural aspect of synaptic plasticity. Furthermore, the data suggest that human disease- linked CHMP2B mutants act as dominant negatives with respect to CHMP2B function in spine morphogenesis.
To determine whether mutant CHMP2B could perturb the subcellular distribution of the normal endogenous protein, neurones transfected with tagged CHMP2Bintron5 or CHMP2BΔ10 were immunostained with both anti-CHMP2B and anti-tag antibodies (Fig. 10). For this, we took advantage of the fact that the anti-CHMP2B antibody was raised against the wild-type C-terminal region, and therefore does not recognise the mutant proteins. The larger CHMP2Bintron5 aggregates recruited conspicuous amounts of the endogenous protein, inducing it to form abnormal clusters (upper panel, arrow). Faint clusters of CHMP2B also occasionally overlapped with CHMP2BΔ10 puncta (lower panel). However, the major, diffuse pool of endogenous CHMP2B remained unaffected. These results suggest that a fraction of native CHMP2B molecules may be perturbed in their biochemical function by interaction with mutant protein.
Fig. 10.
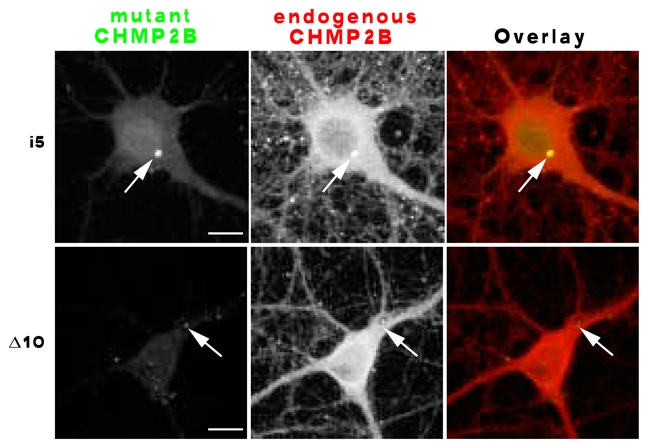
effect of mutant CHMP2B on the subcellular distribution of the normal protein. Hippocampal neurones were transfected with the indicated mutant, and processed for dual immunofluorescent staining with anti-tag and anti-endogenous CHMP2B antibodies. Confocal images were acquired in both channels. Co-clustering of endogenous CHMP2B with mutant protein (arrows) was evident in some of the CHMP2Bintron5 aggregates (upper panel), and faintly discernible in some of the CHMP2BΔ10 puncta (lower panel). Scale bars: 10 μm.
Discussion
Here we found that in cultured hippocampal neurones, two FTD-linked CHMP2B mutants strongly perturbed the normal pattern of dendritic spine development. Both mutants caused a striking decrease in the proportion of large spines with mushroom morphology, i.e. those associated with potentiated synapses. This outcome was not associated with cell death. In keeping with these results, CHMP2BΔ10 induced a loss of large mEPSCs, namely those reflecting the activity of the strongest synapses. Consistent with the view that CHMP2B mutants act as dominant negatives, depletion of endogenous CHMP2B by RNAi resulted in changes which were very similar to those induced by mutant CHMP2B, and which could be largely suppressed by co-expression of rescuing protein. Together, these data show that normal spine morphogenesis requires CHMP2B, and that abnormal stoichiometry or pathological dysregulation of the protein can deeply affect the structure and function of spines.
Overexpression of CHMP2Bintron5 in neurones has previously been shown to trigger a specific toxic process, leading to dramatic retraction of dendritic trees, followed by cell death after 2–3 days; this lethality has been linked to excessive accumulation of autophagosomes (Lee et al., 2007; Lee and Gao, 2009). However, several lines of evidence indicate that the impairment in spine maturation described here occurs through a mechanism distinct from this toxic process. First, the changes in spine morphology were observed in healthy neurones. In particular, expression of CHMP2BΔ10 or knock-down of endogenous CHMP2B potently affected spines, even though these perturbations of CHMP2B activity did not diminish neuronal viability, as expected from published data. Second, alterations of spines did not correlate with changes in dendritic complexity. CHMP2BΔ10 elicited no detectable loss of dendritic branching, and in our conditions CHMP2Bintron5 only induced a 25% decrease in branching rate. This reduction remained modest compared with the 80% shortening of total dendritic length shown to occur in the early phase of CHMP2Bintron5-induced cell death (Lee et al., 2007). The CHMP2B shRNA caused a reduction in dendritic branching, but this may have been an off-target effect, as unlike the reduction in mushroom spines it was not suppressed by co-expression of an RNAi-insensitive CHMP2B cDNA (A. Belly et al, data not shown). Third, when expressed in hippocampal neurones, neither of the CHMP2B mutants caused a clear-cut increase in LC3-GFP condensation onto autophagosomes. By contrast, a lethal degree of CHMP2Bintron5 overexpression has been shown to induce strong clustering of LC3-GFP; furthermore, preventing autophagosome formation retarded the neuronal death due to CHMP2Bintron5 (Lee et al., 2007; Lee and Gao, 2009). Beyond some threshold level of expression, the ability of CHMP2B mutants to block the ESCRT-dependent fusion of autophagosomes to lysosomes (Filimonenko et al., 2007; Urwin et al., 2010) may favour the proliferation of toxic autophagosomes. The difference with our results may arise in part from the relatively low level of mutant CHMP2B expression we used in hippocampal neurones. Indeed, with four-fold higher amounts of CHMP2Bintron5 plasmid, leading to higher expression, we observed toxicity similar to that described by Lee et al. (2007) (although comparison is difficult, as Lee et al. (2007) did not mention the amounts of plasmid in their transfection assays). The non-endosomal location of mutant CHMP2B proteins in our experiments also seem at first sight to be at variance with previously published results from other cell types. However, HA-tagged CHMP2Bintron5 did accumulate around endosomes when overexpressed in BHK cells (A. Belly, unpublished data). It should also be noted that even in heterologous cells, a fraction of CHMP2Bintron5 and CHMP2BΔ10 aggregates consistently fail to co-localise with endosomal markers (Skibinski et al., 2005; A.B., unpublished). In transfected hippocampal neurones, presumably similar non-endosomal aggregates largely predominated. The occurrence of non-endosomal CHMP2B clusters is also consistent with the fact that in vitro, activated ESCRT-III subunits can form large polymers in the absence of lipids (Lata et al., 2008). Our attempts to identify further components of the mutant CHMP2B clusters have so far been unsuccessful, except for the finding that endogenous CHMP2B is sometimes concentrated in CHMP2Bintron5 granules. This suggests that native CHMP2B can be trapped in polymeric structures together with the mutant. Since much of the endogenous CHMP2B appeared to remain outside of the mutant CHMP2B puncta, sequestering of the native protein in the aggregates is unlikely to explain the apparent dominant negative effect of the mutants, especially in the case of CHMP2BΔ10. Mutant molecules may instead perturb or displace their native counterparts in supramolecular structures that cannot be detected by simple light microscopy.
The mechanism(s) through which mutant CHMP2B proteins and CHMP2B depletion affect the morphology of spines will require elucidation. Given the endosomal trafficking function of ESCRT-III, one possibility is that disabling CHMP2B may interfere with the endocytic recycling of some membrane protein critical for spine growth. Examples of such proteins include the EphB and TrkB receptor tyrosine kinases and the GluR2 subunit of AMPA receptors (Henkemeyer et al., 2003; Passafaro et al., 2003). Of note, perturbation of a neurotrophin receptor such as TrkB would have implications for both spine morphogenesis and long-term survival of specific neurones. Alternatively, spine growth may require direct deformation of the dendritic plasma membrane by CHMP2B-containing ESCRT-III filaments (Hanson et al., 2008; Sweeney et al., 2006), or coupling of the actin cytoskeleton to ESCRT-III (Sevrioukov et al., 2005; Vaccari et al., 2009). Identification of CHMP2B-binding dendritic proteins and observation of ESCRT-III dynamics in live neurones may shed light on these possibilities.
Looking for a functional correlate of the CHMP2BΔ10 effect, we found that this mutant significantly decreased the frequency of mEPSCs. This result indicates that CHMP2BΔ10 elicits a decrease in synaptic activity. Moreover, the mutant induced a significant drop (32%) in the proportion of large mEPSCs. The two observations are in keeping with the loss of mature post-synaptic spines. In view of the general correlation between spine size and synaptic potency (Matsuzaki et al., 2001), the change in synaptic properties is consonant with the reduction in the proportion of mushroom spines induced by CHMP2BΔ10. This result raises the intriguing possibility that pathogenic CHMP2B mutants might directly prevent synaptic potentiation and/or weaken previously strong synapses and thereby perturb the functional connectivity of neurones. Further experiments are required to determine the role of CHMP2B and the impact of CHMP2B mutants on activity-dependent changes of spine structure, such as the enlargement associated with long-term potentiation.
While lethal perturbation of autophagy may explain the loss of cortical neurones at the symptomatic stage of FTD-3 (Lee and Gao, 2009; Urwin et al., 2010), the protracted course of the disease, the lack of toxicity displayed by disease-linked mutants such as CHMP2BΔ10, and the low level of mutant CHMP2B mRNA in patients’ brain lead one to argue that CHMP2B mutants may initially have pathogenic effects other than dysfunctional autophagy leading to cell death. Our results suggest that in FTD-3 as in Alzheimer’s disease, the pathogenic proteins may perturb synaptic plasticity and microstructure, long before overt cell death. A synaptotoxic mechanism would be consistent with observations of synapse loss in FTD (Ferrer, 1999; Lipton et al., 2001) and the widespread abnormalities in spine density and morphology seen in diverse neurodegenerative diseases (Fiala et al., 2002; Wishart et al., 2006). Understanding how defects in the highly conserved CHMP2B protein specifically lead to cortical degeneration may shed light on fundamental mechanisms of normal and pathological neurobiology.
Supplementary Material
survival of hippocampal neurones after transfection of CHMP2B mutants. Neurones were co-transfected at 10 DIV with the indicated plasmids, together with mCherry. For each plasmid, coverslips from the same transfected dish were fixed and examined by fluorescence microscopy at 15 and 20 DIV (n= 4 coverslips, 85 neurones, 2 cultures per timepoint). Transfected neurones were visualised by mCherry fluorescence, and scored as healthy or dying/dead based on the absence or presence of morphological signs of degeneration (neuritic varicosities or retractions, “exploded” aspect). The percentage of surviving cells among transfected neurones was calculated at each timepoint. Error bar: S.E.M.
effect of CHMP2B mutants on dendritic arborisation. Sholl analysis was applied to projection images of neurones that had been transfected with the indicated plasmids (n=7 neurones per plasmid; visualised by co-transfected mCherry). The graph shows the average (+/− S.E.M.) increments in total neurite length as a function of stepwise increases in distance from the soma. The positive slope in the lefthand part of the curve reports the degree of branching. The only significant difference was that between the CHMP2Bintron5 curve and the other three curves (p=0.00014).
distribution of spine volumes in a typical control neurone transfected with mCherry (n= 652 spines, range: 0.020 – 2.22 μm3, median: 0.090 μm3, mean: 0.210 μm3). Serial optical sections were acquired and used as input for NeuronStudio to reconstruct a 3-dimensional model of dendritic segments and attached spines. Spine volumes were estimated from the actual number of voxels retained for each spine by the spine reconstruction procedure.
Acknowledgments
A. Belly was supported by the Fondation France Alzheimer. G. Bodon was supported by the Ministère de l’Enseignement Supérieur et de la Recherche. Work funded by INSERM, Université Joseph Fourier, and Fondation France Alzheimer. We thank D. Béal for technical assistance, A. Petiot for advice on autophagy assays, D. Ehlenberger for help with NeuronStudio, T. Yoshimori for the gift of LC3-GFP, P. Dournaud for the gift of mCherry, W. Weissenhorn for discussions, J. H. Henley for critical reading of the manuscript, two anonymous reviewers for suggestions, and all members of the lab for support.
References
- Bajorek M, Schubert HL, McCullough J, Langelier C, Eckert DM, Stubblefield WM, Uter NT, Myszka DG, Hill CP, Sundquist WI. Structural basis for ESCRT-III protein autoinhibition. Nat Struct Mol Biol. 2009;16:754–62. doi: 10.1038/nsmb.1621. [DOI] [PMC free article] [PubMed] [Google Scholar]
- Banker G, Goslin K. MIT Press; 1998. [Google Scholar]
- Boyer C, Schikorski T, Stevens CF. Comparison of Hippocampal Dendritic Spines in Culture and in Brain. J Neurosci. 1998;18:5294–5300. doi: 10.1523/JNEUROSCI.18-14-05294.1998. [DOI] [PMC free article] [PubMed] [Google Scholar]
- Carlton JG, Martin-Serrano J. Parallels between cytokinesis and retroviral budding: a role for the ESCRT machinery. Science. 2007;316:1908–12. doi: 10.1126/science.1143422. [DOI] [PubMed] [Google Scholar]
- Fabrikant G, Lata S, Riches JD, Briggs JAG, Weissenhorn W, Kozlov MM. Computational Model of Membrane Fission Catalyzed by ESCRT-III. PLoS Comput Biol. 2009;5:e1000575. doi: 10.1371/journal.pcbi.1000575. [DOI] [PMC free article] [PubMed] [Google Scholar]
- Ferrer I. Neurons and their dendrites in frontotemporal dementia. Dement Geriatr Cogn Disord. 1999;10(Suppl 1):55–60. doi: 10.1159/000051214. [DOI] [PubMed] [Google Scholar]
- Fiala JC, Spacek J, Harris KM. Dendritic spine pathology: cause or consequence of neurological disorders? Brain Res Brain Res Rev. 2002;39:29–54. doi: 10.1016/s0165-0173(02)00158-3. [DOI] [PubMed] [Google Scholar]
- Filimonenko M, Stuffers S, Raiborg C, Yamamoto A, Malerod L, Fisher EM, Isaacs A, Brech A, Stenmark H, Simonsen A. Functional multivesicular bodies are required for autophagic clearance of protein aggregates associated with neurodegenerative disease. J Cell Biol. 2007;179:485–500. doi: 10.1083/jcb.200702115. [DOI] [PMC free article] [PubMed] [Google Scholar]
- Hanson PI, Roth R, Lin Y, Heuser JE. Plasma membrane deformation by circular arrays of ESCRT-III protein filaments. J Cell Biol. 2008;180:389–402. doi: 10.1083/jcb.200707031. [DOI] [PMC free article] [PubMed] [Google Scholar]
- Henkemeyer M, Itkis OS, Ngo M, Hickmott PW, Ethell IM. Multiple EphB receptor tyrosine kinases shape dendritic spines in the hippocampus 10.1083/jcb.200306033. J Cell Biol. 2003;163:1313–1326. doi: 10.1083/jcb.200306033. [DOI] [PMC free article] [PubMed] [Google Scholar]
- Hurley JH, Emr SD. The ESCRT complexes: structure and mechanism of a membrane-trafficking network. Annu Rev Biophys Biomol Struct. 2006;35:277–98. doi: 10.1146/annurev.biophys.35.040405.102126. [DOI] [PMC free article] [PubMed] [Google Scholar]
- Lata S, Schoehn G, Jain A, Pires R, Piehler J, Gottlinger HG, Weissenhorn W. Helical structures of ESCRT-III are disassembled by VPS4. Science. 2008;321:1354–7. doi: 10.1126/science.1161070. [DOI] [PMC free article] [PubMed] [Google Scholar]
- Lee JA, Beigneux A, Ahmad ST, Young SG, Gao FB. ESCRT-III dysfunction causes autophagosome accumulation and neurodegeneration. Curr Biol. 2007;17:1561–7. doi: 10.1016/j.cub.2007.07.029. [DOI] [PubMed] [Google Scholar]
- Lee JA, Gao FB. Inhibition of autophagy induction delays neuronal cell loss caused by dysfunctional ESCRT-III in frontotemporal dementia. J Neurosci. 2009;29:8506–11. doi: 10.1523/JNEUROSCI.0924-09.2009. [DOI] [PMC free article] [PubMed] [Google Scholar]
- Lipton AM, Cullum CM, Satumtira S, Sontag E, Hynan LS, White CL, III, Bigio EH. Contribution of Asymmetric Synapse Loss to Lateralizing Clinical Deficits in Frontotemporal Dementias 10.1001/archneur.58.8.1233. Arch Neurol. 2001;58:1233–1239. doi: 10.1001/archneur.58.8.1233. [DOI] [PubMed] [Google Scholar]
- Matsuzaki M, Ellis-Davies GC, Nemoto T, Miyashita Y, Iino M, Kasai H. Dendritic spine geometry is critical for AMPA receptor expression in hippocampal CA1 pyramidal neurons. Nat Neurosci. 2001;4:1086–92. doi: 10.1038/nn736. [DOI] [PMC free article] [PubMed] [Google Scholar]
- Morfini GA, Burns M, Binder LI, Kanaan NM, LaPointe N, Bosco DA, Brown RH, Jr, Brown H, Tiwari A, Hayward L, et al. Axonal Transport Defects in Neurodegenerative Diseases 10.1523/JNEUROSCI.3463-09.2009. J Neurosci. 2009;29:12776–12786. doi: 10.1523/JNEUROSCI.3463-09.2009. [DOI] [PMC free article] [PubMed] [Google Scholar]
- Muziol T, Pineda-Molina E, Ravelli RB, Zamborlini A, Usami Y, Gottlinger H, Weissenhorn W. Structural basis for budding by the ESCRT-III factor CHMP3. Dev Cell. 2006;10:821–30. doi: 10.1016/j.devcel.2006.03.013. [DOI] [PubMed] [Google Scholar]
- Noguchi J, Matsuzaki M, Ellis-Davies GC, Kasai H. Spine-neck geometry determines NMDA receptor-dependent Ca2+ signaling in dendrites. Neuron. 2005;46:609–22. doi: 10.1016/j.neuron.2005.03.015. [DOI] [PMC free article] [PubMed] [Google Scholar]
- Passafaro M, Nakagawa T, Sala C, Sheng M. Induction of dendritic spines by an extracellular domain of AMPA receptor subunit GluR2. Nature. 2003;424:677–681. doi: 10.1038/nature01781. [DOI] [PubMed] [Google Scholar]
- Rodriguez A, Ehlenberger DB, Dickstein DL, Hof PR, Wearne SL. Automated Three-Dimensional Detection and Shape Classification of Dendritic Spines from Fluorescence Microscopy Images. PLoS ONE. 2008;3:e1997. doi: 10.1371/journal.pone.0001997. [DOI] [PMC free article] [PubMed] [Google Scholar]
- Rodriguez A, Ehlenberger DB, Hof PR, Wearne SL. Rayburst sampling, an algorithm for automated three-dimensional shape analysis from laser scanning microscopy images. 2006;1:2152–2161. doi: 10.1038/nprot.2006.313. [DOI] [PubMed] [Google Scholar]
- Rusten TE, Simonsen A. ESCRT functions in autophagy and associated disease. Cell Cycle. 2008;7:1166–72. doi: 10.4161/cc.7.9.5784. [DOI] [PubMed] [Google Scholar]
- Saksena S, Wahlman J, Teis D, Johnson AE, Emr SD. Functional reconstitution of ESCRT-III assembly and disassembly. Cell. 2009;136:97–109. doi: 10.1016/j.cell.2008.11.013. [DOI] [PMC free article] [PubMed] [Google Scholar]
- Sevrioukov EA, Moghrabi N, Kuhn M, Kramer H. A mutation in dVps28 reveals a link between a subunit of the endosomal sorting complex required for transport-I complex and the actin cytoskeleton in Drosophila. Mol Biol Cell. 2005;16:2301–12. doi: 10.1091/mbc.E04-11-1013. [DOI] [PMC free article] [PubMed] [Google Scholar]
- Skibinski G, Parkinson NJ, Brown JM, Chakrabarti L, Lloyd SL, Hummerich H, Nielsen JE, Hodges JR, Spillantini MG, Thusgaard T, et al. Mutations in the endosomal ESCRTIII-complex subunit CHMP2B in frontotemporal dementia. 2005;37:806–808. doi: 10.1038/ng1609. [DOI] [PubMed] [Google Scholar]
- Slagsvold T, Pattni K, Malerød L, Stenmark H. Endosomal and non-endosomal functions of ESCRT proteins. Trends in Cell Biology. 2006;16:317–326. doi: 10.1016/j.tcb.2006.04.004. [DOI] [PubMed] [Google Scholar]
- Stuchell-Brereton MD, Skalicky JJ, Kieffer C, Karren MA, Ghaffarian S, Sundquist WI. ESCRT-III recognition by VPS4 ATPases. 2007;449:740–744. doi: 10.1038/nature06172. [DOI] [PubMed] [Google Scholar]
- Sweeney NT, Brenman JE, Jan YN, Gao FB. The Coiled-Coil Protein Shrub Controls Neuronal Morphogenesis in Drosophila. Current Biology. 2006;16:1006–1011. doi: 10.1016/j.cub.2006.03.067. [DOI] [PubMed] [Google Scholar]
- Urwin H, Authier A, Nielsen JE, Metcalf D, Powell C, Froud K, Malcolm DS, Holm I, Johannsen P, Brown J, et al. Disruption of endocytic trafficking in frontotemporal dementia with CHMP2B mutations. Hum Mol Genet. 2010 doi: 10.1093/hmg/ddq100. in press. [DOI] [PMC free article] [PubMed] [Google Scholar]
- Vaccari T, Rusten TE, Menut L, Nezis IP, Brech A, Stenmark H, Bilder D. Comparative analysis of ESCRT-I, ESCRT-II and ESCRT-III function in Drosophila by efficient isolation of ESCRT mutants. J Cell Sci. 2009;122:2413–23. doi: 10.1242/jcs.046391. [DOI] [PMC free article] [PubMed] [Google Scholar]
- von Schwedler UK, Stuchell M, Müller B, Ward DM, Chung HY, Morita E, Wang HE, Davis T, He GP, Cimbora DM, et al. The Protein Network of HIV Budding. Cell. 2003;114:701–713. doi: 10.1016/s0092-8674(03)00714-1. [DOI] [PubMed] [Google Scholar]
- Wei W, Nguyen LN, Kessels HW, Hagiwara H, Sisodia S, Malinow R. Amyloid beta from axons and dendrites reduces local spine number and plasticity. Nat Neurosci. 2009 doi: 10.1038/nn.2476. [DOI] [PMC free article] [PubMed] [Google Scholar]
- Wishart TM, Parson SH, Gillingwater TH. Synaptic vulnerability in neurodegenerative disease. Journal of Neuropathology and Experimental Neurology. 2006;65:733–739. doi: 10.1097/01.jnen.0000228202.35163.c4. [DOI] [PubMed] [Google Scholar]
- Wollert T, Wunder C, Lippincott-Schwartz J, Hurley JH. Membrane scission by the ESCRT-III complex. Nature. 2009;458:172–7. doi: 10.1038/nature07836. [DOI] [PMC free article] [PubMed] [Google Scholar]
- Wollert T, Hurley JH. Molecular mechanism of multivesicular body biogenesis by ESCRT complexes. Nature. 2010;464:864–9. doi: 10.1038/nature08849. [DOI] [PMC free article] [PubMed] [Google Scholar]
- Yasumatsu N, Matsuzaki M, Miyazaki T, Noguchi J, Kasai H. Principles of long-term dynamics of dendritic spines. J Neurosci. 2008;28:13592–608. doi: 10.1523/JNEUROSCI.0603-08.2008. [DOI] [PMC free article] [PubMed] [Google Scholar]
- Zamborlini A, Usami Y, Radoshitzky SR, Popova E, Palu G, Gottlinger H. Release of autoinhibition converts ESCRT-III components into potent inhibitors of HIV-1 budding. Proc Natl Acad Sci U S A. 2006;103:19140–5. doi: 10.1073/pnas.0603788103. [DOI] [PMC free article] [PubMed] [Google Scholar]
Associated Data
This section collects any data citations, data availability statements, or supplementary materials included in this article.
Supplementary Materials
survival of hippocampal neurones after transfection of CHMP2B mutants. Neurones were co-transfected at 10 DIV with the indicated plasmids, together with mCherry. For each plasmid, coverslips from the same transfected dish were fixed and examined by fluorescence microscopy at 15 and 20 DIV (n= 4 coverslips, 85 neurones, 2 cultures per timepoint). Transfected neurones were visualised by mCherry fluorescence, and scored as healthy or dying/dead based on the absence or presence of morphological signs of degeneration (neuritic varicosities or retractions, “exploded” aspect). The percentage of surviving cells among transfected neurones was calculated at each timepoint. Error bar: S.E.M.
effect of CHMP2B mutants on dendritic arborisation. Sholl analysis was applied to projection images of neurones that had been transfected with the indicated plasmids (n=7 neurones per plasmid; visualised by co-transfected mCherry). The graph shows the average (+/− S.E.M.) increments in total neurite length as a function of stepwise increases in distance from the soma. The positive slope in the lefthand part of the curve reports the degree of branching. The only significant difference was that between the CHMP2Bintron5 curve and the other three curves (p=0.00014).
distribution of spine volumes in a typical control neurone transfected with mCherry (n= 652 spines, range: 0.020 – 2.22 μm3, median: 0.090 μm3, mean: 0.210 μm3). Serial optical sections were acquired and used as input for NeuronStudio to reconstruct a 3-dimensional model of dendritic segments and attached spines. Spine volumes were estimated from the actual number of voxels retained for each spine by the spine reconstruction procedure.