


Abstract
DOMINE is a comprehensive collection of known and predicted domain–domain interactions (DDIs) compiled from 15 different sources. The updated DOMINE includes 2285 new domain–domain interactions (DDIs) inferred from experimentally characterized high-resolution three-dimensional structures, and about 3500 novel predictions by five computational approaches published over the last 3 years. These additions bring the total number of unique DDIs in the updated version to 26 219 among 5140 unique Pfam domains, a 23% increase compared to 20 513 unique DDIs among 4346 unique domains in the previous version. The updated version now contains 6634 known DDIs, and features a new classification scheme to assign confidence levels to predicted DDIs. DOMINE will serve as a valuable resource to those studying protein and domain interactions. Most importantly, DOMINE will not only serve as an excellent reference to bench scientists testing for new interactions but also to bioinformaticans seeking to predict novel protein–protein interactions based on the DDIs. The contents of the DOMINE are available at http://domine.utdallas.edu.
INTRODUCTION
Protein domains are defined as structural or functional subunits that make up proteins. They have the ability to fold into a stable structure, evolve and function independently of the rest of the protein that contains them. Domains have evolved to combine into different arrangements to form multi-domain proteins with varying functions. Proteins seldom function alone to carry out their functions. They almost always interact either stably or transiently with other proteins (as in a protein complex or a biological pathway) to perform housekeeping as well as critical cellular functions including cell signaling, trafficking and stress response.
Given that a majority of proteins are multi-domain proteins (1) and that an interaction between two proteins most often involves only a pair of constituent domains (one from each protein), understanding protein interactions at the domain level becomes critical to understanding not only the binding interfaces but also, most importantly, the causes of deleterious mutations at these interfaces. While the former can help discover unrecognized protein–protein interactions (2), the latter can help in the development of drugs to inhibit pathological interactions (3). For these simple reasons, understanding interaction between proteins at the domain level seems to be a logical step toward understanding interactions at the residue level.
Experimentally determined high-resolution three-dimensional (3D) structures are a prime resource for understanding how interactions between domains/proteins are mediated (4,5). However, the number of domain–domain interactions (DDIs) inferred from structures can only explain ∼5% of protein protein–protein interactions (PPIs) in yeast and ∼19% of PPIs in human (6). To expedite the discovery of previously unrecognized DDIs, computational approaches based on correlated sequence signatures and sequence co-evolution (7–9), gene-fusion (10,11), phylogenetic profiling (12), gene ontology (11,13), statistical/probabilistic frameworks (11,14–17), parsimonious principle (18,19) and machine learning (20–22) have been proposed. While these approaches have immensely contributed to the discovery of novel DDIs, the ever increasing sets of predictions make it difficult for bench scientists to access, analyze and integrate data sets scattered under a variety of formats. There was a need for an accessible online resource containing all available DDIs, known as well as predicted, under a single roof facilitating scientists to best use their time dissecting these data sets for clues on structural and evolutionary aspects of protein and domain interactions.
DOMINE (23), a comprehensive collection of known and predicted DDIs from 10 different sources, was launched in 2007 as an online database server to serve as a reference to experimental biologists testing for new interactions and to provide a rich set of DDIs to bioinformaticans seeking to understand interaction interfaces and predict novel PPIs based on DDIs. Over the last year, the database has been updated to include DDIs predicted by five new computational approaches published over the past 3 years. Updates to the 3did database, which infers the set of known DDIs from high-resolution 3D structures, has added 2285 new known interactions to DOMINE, confirming 168 of the previously predicted DDIs. The updated version now contains 6634 known interactions and 21 620 predicted interactions, and features a new classification scheme to assign confidence levels to predicted DDIs.
DATA SOURCES
The DOMINE database contains DDIs gathered from 15 different sources listed in Table 1. The set of known DDIs, inferred from experimentally characterized high-resolution 3D structures, were obtained from iPfam (4) and 3did (5). Updates to 3did since the launch of DOMINE has added over 2000 new known interactions to DOMINE. DDIs predicted by 13 computational approaches (8,10–13,15–22), including over 2600 novel predictions from five new methods—GPE (19), DIPD (22), K-GIDDI (13), Insite (17), DomainGA (20)—were obtained from respective publications. In cases where significance cutoff values had to be chosen to define the set of predicted DDIs, appropriate cutoffs were selected based on input from the authors. The set of all DDIs from the 15 different sources add up to 26 219 unique DDIs among 5140 unique Pfam domains in the updated version, a 23% increase compared to 20 513 unique DDIs among 4346 unique Pfam domains in the previous version.
Table 1.
Sources of DOMINE database contents
| Method/source | Number of DDIs | Description |
|---|---|---|
| iPfam | 4030 | iPfam contains a collection of DDIs that are observed in PDB entries. Data, dated 17 February 2007, were used. |
| 3dida | 6066 | 3did is a collection of DDIs in proteins for which high-resolution 3D structures are known. Data, downloaded in September 2010, were used. |
| ME | 2391 | ME refers to a Bayesian approach that integrates DDIs predicted using a maximum likelihood estimation approach on yeast, worm, fruit fly and human PPI networks with gene ontology and domain fusion data. |
| RCDP | 960 | The RCDP approach uses sequence coevolution to predict the domain pair that is most likely to mediate a given PPI. Given a PPI, RCDP predicts the domain pair with the highest degree of co-evolution to be the mediating domain pair. Set of DDIs predicted from 1180 yeast PPIs (Raghavachari data set) was used. |
| P-value | 596 | P-value refers to the statistical approach that assigns P-values to pairs of SCOP domain superfamilies based on the strength of evidence within a set of PPIs. These P-values for domain pairs were used to predict 705 DDIs between SCOP domains from protein complexes in the Protein Quaternary Structure (PQS) database, which were converted to 596 DDIs between Pfam domains. |
| Fusion | 2768 | DDIs inferred using domain fusion hypothesis as reported in the Interdom database (v1.1) were used. |
| DPEA | 1812 | DPEA is a statistical approach to infer DDIs from PPI networks from many organisms. It uses an expectation–maximization algorithm to obtain probability of interaction for each potentially interacting domain pair, and computes the change in likelihood, expressed as a log odds score, by excluding this domain pair from being considered as a potentially interacting domain pair. DPEA was applied on PPI networks from 69 organisms (Riley data set), and the set of DDIs only between Pfam-A domains with log odds score ≥3.0 was used. |
| PE | 2588 | PE is an optimization approach based on the assumption that the set of true DDIs are well approximated by the minimum set of DDIs that can justify every PPI in a PPI network. Given a PPI network, the PE approach uses linear programming to compute the LP score for every domain pair that could possibly justify interaction between two proteins, and a P-score to account for false positives in the PPI network. PE was applied on the Riley data set, and the set of DDIs only between Pfam-A domains with LP score ≥0.5 and P-score ≤0.1 was used. |
| GPEb | 1563 | GPE builds upon the PE approach by unifying domains that always occur together in a protein as a singular ‘supra-domain', and uses the linear programming framework as used by PE. GPE was applied on the redefined Riley data set (Guimaraes data set), and the set of DDIs only between Pfam-A domains with LP score ≥0.60 and pw-score ≤0.01 was used. Supra-domains were expanded back to individual Pfam-A domains. |
| DIPDb | 2157 | DIPD constructs feature vectors for each protein pair within the sets of PPIs (Riley data set) and non-PPIs, and uses a discriminative classifier to identify the minimum set of domain pairs/triplets that can discriminate PPIs and non-PPIs. Each selected feature (domain pair) is a putative DDI. The sets of predictions on Raghavachari, Riley and Guimaraes data sets were used. |
| RDFF | 2475 | Chen and Liu's Random Decision Forest Framework (RDFF) approach explores all possible DDIs and predicts PPIs based on protein domains. The decision tree-based model is used to infer DDIs for each correctly predicted PPI. The set of DDIs only between Pfam-A domains was used. |
| K-GIDDIb | 386 | K-GIDDI uses gene ontology information to construct an initial DDI network using the top s% of DDIs inferred from cross-species PPI networks, and then expands the DDI network by predicting additional DDIs using a graph theoretical approach based on a parameter b. The latter allows for prediction of DDIs that are otherwise not predictable by methods that rely solely on PPI data. The set of DDIs predicted using s = 10 and b = 50 was used. |
| Insiteb | 2408 | Insite uses a naïve Bayes model to build upon features in DPEA. Its novel formulation of evidence models for PPIs and DDIs helps address noise (false positives) generated by high-throughput assays. |
| DomainGAb | 459 | DomainGA is a genetic algorithm-type machine learning approach based on multi-parameter optimization. It uses the available PPI data to compute a score for domain pairs, which are then used to predict PPIs. Yeast PPI data set was used to identify 867 putative DDIs between domains defined based on information derived from the Interpro database. The set of 459 DDIs only between Pfam domains was used. |
| DIMA | 8012 | DIMA predicts DDIs based on phylogenetic profiling of presence/absence of domains in many organisms. |
aUpdated dataset.
bNew dataset.
NEW CLASSIFICATION SCHEME
In addition to the 5706 new DDIs, the updated version of DOMINE features a new classification scheme replacing the old one, which we had used to classify predicted DDIs as either high-confidence, medium-confidence or low-confidence predictions (HCP, MCP or LCP, respectively). In the inaugural version of DOMINE, we had simply classified a DDI to be HCP if it were predicted using multiple sources of information or by at least two sufficiently different methods, MCP if the domains share a GO term and LCP otherwise. In search of a classification scheme that is better than the old one, we first sought to characterize the predicted DDIs obtained from various sources in an effort to assign some sort of weight to each method. This would facilitate computing a confidence score for each predicted DDI by essentially summing the weights assigned to each of the method predicting this DDI, which could then be used to classify DDIs into one of the three confidence classes.
Assigning weights to methods is not an easy task because it would require a fair and objective comparison of the methods' performances. The set of known DDIs obtained from iPfam and/or 3did has long been used as a gold standard set of positives. Nearly all of the computational approaches in Table 1 used this set of known DDIs to assess their performance/accuracy. Since a majority of these methods used different datasets and/or different types of data (proteomic, genomic, evolutionary, gene fusion, gene ontology, etc.) to make predictions, it is nearly impossible to perform a direct comparison of the performances of these approaches. Testing all the methods on a benchmark data set is not possible because some of the methods impose unique set of constraints on the input data set: for example, RCDP (8) considers only those PPIs with both proteins having orthologous counterparts in 10 or more genomes. Typically, the percentage of predictions known to be true has been used as a metric to make indirect comparison of different methods. Assessing the performance of an approach solely based on the set of known DDIs potentially forces authors to benchmark their predictions or fine-tune their methods to maximize the percentage of predictions known to be true in an effort to demonstrate their method's superior performance. An incentive to predict what is already known sadly makes predicting novel DDIs less of a priority.
Pair-wise comparison of DDIs predicted by various methods revealed that there is little agreement even among methods such as DPEA, PE, DIPD, GPE and Insite, which used the exact same or a nearly identical data set for making predictions with the exception of DPEA and PE (Supplementary Table S1 and Supplementary Figure S1). The fact that 96.5% of DDIs predicted by DPEA were also predicted by PE could only mean one of the following three things: (a) DPEA and PE are so accurate that they both are predicting essentially what are true DDIs, (b) the input data set used to predict DDIs is in some way biased resulting in predictions that are similar regardless of the approach being used and (c) DPEA and PE methodologies are somewhat similar. Given that only about 12% of predictions by DPEA and PE are known to be true (23), reasoning (a) might not be realistic. Since DIPD on the exact same input data set makes predictions that differ from those made by DPEA and PE (Supplementary Figure S1), (b) cannot be considered a good reasoning. This leaves (c) as the only plausible explanation. The trivial scheme such as the one used previously to classify DDIs as either HCP, MCP or LCP (i) can be easily fooled into classifying DDIs predicted by nearly identical methods as HCP and (ii) will fail to account for biases in the input data set that is used to make predictions. In the inaugural version of DOMINE, the former issue was taken care of by taking the union of predictions by DPEA and PE (was referred to as LP) as a single set of predictions. We knew at that time that this was rather arbitrary and subjective, and recognized the need to formulate a reasonable scheme for classification of predicted DDIs in the updated version of DOMINE.
We decided to assign weights to methods based on how well their predictions are confirmed by others. For every pair of methods x and y, Jaccard index (or Jaccard similarity coefficient), measuring how well the set of predictions (Px) by x overlap with those (Py) of y, was computed as
Pair-wise Jaccard index scores are depicted as heat-map in Figure 1. For every method x, the ‘prediction overlap index’ is defined as
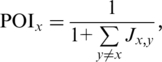 |
ranging from >0 to 1. For instance, a method whose predictions do not overlap with those of any of the other methods will receive a POI of one, whereas a method whose predictions overlap completely with those of at least one other method will receive a POI not more than 0.5. The POI is not indicative of a method's performance as it merely captures the degree to which the predictions made by a method overlaps with those made by the other methods. The confidence score S for each predicted DDI is defined as the sum of the POIs of methods predicting this DDI. The scoring scheme based on POIs is rather counterintuitive since predictions by a method with higher (or lower) POI are less (more) likely to have been predicted by many other methods resulting in them getting lower (higher, respectively) confidence scores.
Figure 1.

Unsupervised hierarchical clustering of Jaccard index values for every pair of methods, based on the overlap of their predictions, is shown as a heat-map. Data used for generating this heatmap are available as Supplementary Table S2.
Based on the above described strategy for computing confidence scores for predicted DDIs, we have now redefined the confidence levels of predicted DDIs using the new scheme shown in Figure 2A. A DDI is classified as an HCP if its confidence score S is at least two, or at least one with the domains involved sharing a gene ontology (GO) term, or if it is predicted by the integrated ME approach (Table 1). A DDI that is not an HCP is a MCP if its score is at least one, or domains involved share a GO term. DDIs not classified as HCP or MCP are grouped as LCPs. Figure 2B shows the number of DDIs with a confidence score S or above (black histogram; primary y-axis), and a fraction of them that are known to be true (green histogram; secondary y-axis). The latter shows that the higher the confidence score of a DDI, the more likely it is known to be true (R2 = 0.98), providing credibility to the strategy used to compute the confidence scores. The stacked histogram in Figure 2C shows, for each method, the fraction of its predictions classified as HCP, MCP and LCP. DOMINE's contents are summarized in Figure 3.
Figure 2.

DOMINE construction and data characteristics. (A) Schematic overview of the DOMINE database construction. (B) Histograms showing the number of predicted DDIs with a confidence score S or above (black histogram; primary y-axis), and a fraction of them that are known to be true (green histogram; secondary y-axis). (C) Stacked histogram showing the fraction of predicted DDIs by each method classified as HCP, MCP or LCP.
Figure 3.

DOMINE database contents (top panel), and percentage of HCP, MCP and LCP that are known to be true (bottom panel).
DATABASE AVAILABILITY
The DOMINE database is freely available at http://domine.utdallas.edu. A user-friendly web interface was developed and tested on Linux and Windows environments using Internet Explorer, Firefox and Safari web browsers. The database is stored using MySQL. ‘Browse' option can be used to view DDIs by Pfam domain name. Users may also browse domains based on GO classification. The powerful ‘search' option can be used to search for one or more domains using keywords (e.g. kinase), Pfam ID (e.g. HSP90) or accession (e.g. PF00061), Interpro ID (e.g. IPR004825) or GO term (e.g. transcription or GO:0006468). Clicking on a domain name (Pfam ID) takes the user to the results page displaying DDIs involving this domain (Figure 4). Each DDI is annotated with Interpro and GO IDs as well as source of origin and whether or not it is known to be true, etc. The entire database can be downloaded as a zip-compressed file, which includes a README file. Data within the files are tab- or ‘|'-separated.
Figure 4.

Screen shot of query result for HSP90 domain.
CONCLUSION AND OUTLOOK
The DOMINE database is a comprehensive collection of known and predicted DDIs from 15 different sources. It also serves as a one-stop resource for domain-specific information with links provided to popular databases including Pfam, Interpro and GO. Currently, DOMINE only supports DDIs based on Pfam domain definitions. In the future, we plan on making it support other popular domain definitions including the CDD and the SCOP.
SUPPLEMENTARY DATA
Supplementary Data are available at NAR Online.
FUNDING
This work was supported by the Intramural Research Program of the National Institute of Environmental Health Sciences, National Institute of Health (Project number Z01ES102625-02 to R.J.).
Conflict of interest statement. None declared.
ACKNOWLEDGEMENT
We thank Sarah Hunter from EBI for the latest Pfam-GO-Interpro mappings.
REFERENCES
- 1.Apic G, Gough J, Teichmann SA. Domain combinations in archaeal, eubacterial and eukaryotic proteomes. J. Mol. Biol. 2001;310:311–325. doi: 10.1006/jmbi.2001.4776. [DOI] [PubMed] [Google Scholar]
- 2.Shoemaker B, Panchenko A, Bryant S. Finding biologically relevant protein domain interactions: conserved binding mode analysis. Protein Sci. 2006;15:352–361. doi: 10.1110/ps.051760806. [DOI] [PMC free article] [PubMed] [Google Scholar]
- 3.Pawson T, Nash P. Assembly of cell regulatory systems through protein interaction domains. Science. 2003;300:445. doi: 10.1126/science.1083653. [DOI] [PubMed] [Google Scholar]
- 4.Finn R, Marshall M, Bateman A. iPfam: visualization of protein-protein interactions in PDB at domain and amino acid resolutions. Bioinformatics. 2005;21:410. doi: 10.1093/bioinformatics/bti011. [DOI] [PubMed] [Google Scholar]
- 5.Stein A, Panjkovich A, Aloy P. 3did update: domain-domain and peptide-mediated interactions of known 3D structure. Nucleic Acids Res. 2009;37:D300. doi: 10.1093/nar/gkn690. [DOI] [PMC free article] [PubMed] [Google Scholar]
- 6.Schuster-Bockler B, Bateman A. Reuse of structural domain-domain interactions in protein networks. BMC bioinformatics. 2007;8:259. doi: 10.1186/1471-2105-8-259. [DOI] [PMC free article] [PubMed] [Google Scholar]
- 7.Sprinzak E, Margalit H. Correlated sequence-signatures as markers of protein-protein interaction. J. Mol. Biol. 2001;311:681–692. doi: 10.1006/jmbi.2001.4920. [DOI] [PubMed] [Google Scholar]
- 8.Jothi R, Cherukuri P, Tasneem A, Przytycka T. Co-evolutionary analysis of domains in interacting proteins reveals insights into domain-domain interactions mediating protein-protein interactions. J. Mol. Biol. 2006;362:861–875. doi: 10.1016/j.jmb.2006.07.072. [DOI] [PMC free article] [PubMed] [Google Scholar]
- 9.Kann M, Jothi R, Cherukuri P, Przytycka T. Predicting protein domain interactions from coevolution of conserved regions. Proteins. 2007;67:811–820. doi: 10.1002/prot.21347. [DOI] [PubMed] [Google Scholar]
- 10.Ng S, Zhang Z, Tan S. Integrative approach for computationally inferring protein domain interactions. Bioinformatics. 2003;19:923. doi: 10.1093/bioinformatics/btg118. [DOI] [PubMed] [Google Scholar]
- 11.Lee H, Deng M, Sun F, Chen T. An integrated approach to the prediction of domain-domain interactions. BMC Bioinformatics. 2006;7:269. doi: 10.1186/1471-2105-7-269. [DOI] [PMC free article] [PubMed] [Google Scholar]
- 12.Pagel P, Wong P, Frishman D. A domain interaction map based on phylogenetic profiling. J. Mol. Biol. 2004;344:1331–1346. doi: 10.1016/j.jmb.2004.10.019. [DOI] [PubMed] [Google Scholar]
- 13.Liu M, Chen XW, Jothi R. Knowledge-guided inference of domain-domain interactions from incomplete protein-protein interaction networks. Bioinformatics. 2009;25:2492–2499. doi: 10.1093/bioinformatics/btp480. [DOI] [PMC free article] [PubMed] [Google Scholar]
- 14.Deng M, Mehta S, Sun F, Chen T. Inferring domain-domain interactions from protein-protein interactions. Genome Res. 2002;12:1540. doi: 10.1101/gr.153002. [DOI] [PMC free article] [PubMed] [Google Scholar]
- 15.Nye T, Berzuini C, Gilks W, Babu M, Teichmann S. Statistical analysis of domains in interacting protein pairs. Bioinformatics. 2005;21:993. doi: 10.1093/bioinformatics/bti086. [DOI] [PubMed] [Google Scholar]
- 16.Riley R, Lee C, Sabatti C, Eisenberg D. Inferring protein domain interactions from databases of interacting proteins. Genome Biol. 2005;6:R89. doi: 10.1186/gb-2005-6-10-r89. [DOI] [PMC free article] [PubMed] [Google Scholar]
- 17.Wang H, Segal E, Ben-Hur A, Li QR, Vidal M, Koller D. InSite: a computational method for identifying protein-protein interaction binding sites on a proteome-wide scale. Genome Biol. 2007;8:R192. doi: 10.1186/gb-2007-8-9-r192. [DOI] [PMC free article] [PubMed] [Google Scholar]
- 18.Guimaraes K, Jothi R, Zotenko E, Przytycka T. Predicting domain-domain interactions using a parsimony approach. Genome Biol. 2006;7:R104. doi: 10.1186/gb-2006-7-11-r104. [DOI] [PMC free article] [PubMed] [Google Scholar]
- 19.Guimaraes K, Przytycka T. Interrogating domain-domain interactions with parsimony based approaches. BMC Bioinformatics. 2008;9:171. doi: 10.1186/1471-2105-9-171. [DOI] [PMC free article] [PubMed] [Google Scholar]
- 20.Singhal M, Resat H. A domain-based approach to predict protein-protein interactions. BMC Bioinformatics. 2007;8:199. doi: 10.1186/1471-2105-8-199. [DOI] [PMC free article] [PubMed] [Google Scholar]
- 21.Chen X, Liu M. Prediction of protein-protein interactions using random decision forest framework. Bioinformatics. 2005;21:4394. doi: 10.1093/bioinformatics/bti721. [DOI] [PubMed] [Google Scholar]
- 22.Zhao XM, Chen L, Aihara K. A discriminative approach for identifying domain-domain interactions from protein-protein interactions. Proteins. 2010;78:1243–1253. doi: 10.1002/prot.22643. [DOI] [PubMed] [Google Scholar]
- 23.Raghavachari B, Tasneem A, Przytycka TM, Jothi R. DOMINE: a database of protein domain interactions. Nucleic Acids Res. 2008;36:D656–D661. doi: 10.1093/nar/gkm761. [DOI] [PMC free article] [PubMed] [Google Scholar]