Abstract
Tomato Functional Genomics Database (TFGD) provides a comprehensive resource to store, query, mine, analyze, visualize and integrate large-scale tomato functional genomics data sets. The database is functionally expanded from the previously described Tomato Expression Database by including metabolite profiles as well as large-scale tomato small RNA (sRNA) data sets. Computational pipelines have been developed to process microarray, metabolite and sRNA data sets archived in the database, respectively, and TFGD provides downloads of all the analyzed results. TFGD is also designed to enable users to easily retrieve biologically important information through a set of efficient query interfaces and analysis tools, including improved array probe annotations as well as tools to identify co-expressed genes, significantly affected biological processes and biochemical pathways from gene expression data sets and miRNA targets, and to integrate transcript and metabolite profiles, and sRNA and mRNA sequences. The suite of tools and interfaces in TFGD allow intelligent data mining of recently released and continually expanding large-scale tomato functional genomics data sets. TFGD is available at http://ted.bti.cornell.edu.
INTRODUCTION
Tomato (Solanum lycopersicum) is an economically important vegetable/fruit crop throughout the world with significant importance for human health and nutrition. It has long served as a model system for fleshy fruit development, plant genetics, pathology and physiology. Currently the entire genome of tomato is being sequenced by an international consortium, resulting in a wealth of genomics resources including BAC and fosmid libraries and their end sequences, high density genetic and physical maps, a large set of molecular markers and a number of powerful computational pipelines for sequence analysis and genome annotation (1). Meanwhile, numerous large-scale functional genomics resources for tomato have been developed over the past several years with new resources accumulating at a rapid rate. A large collection of tomato Expressed Sequence Tags (ESTs) that currently represents approximately 40 000 unigenes derived from more than 300 000 ESTs has been generated (http://www.sgn.cornell.edu). In addition a collection of more than 11 000 tomato full-length cDNA sequences has been released (2). Several publicly available microarray platforms have been created based on the tomato EST collection and some have been used extensively by the community to investigate the dynamics of the tomato transcriptome in different biological processes, resulting in large amounts of gene expression data. Recently, comprehensive profiles of numerous tomato metabolites have been generated and integrated with phenotypic trait data and transcript profiles to identify metabolic regulatory networks for the purpose of improving fruit quality (3,4). Profiles of fruit flavor and nutrition-related metabolites from well-defined tomato introgression lines (ILs) have also been generated in order to identify loci or genes affecting flavor and nutrition through systems analysis of genotype, metabolite and gene expression data (5,6). In the past several years, large numbers of tomato small RNA (sRNA) sequences have been accumulated and are exponentially expanding due to rapid advances in sequencing technologies (7–9). Understanding functions of these tomato sRNAs represents an emerging and relatively unexploited opportunity to provide novel insights into the regulatory mechanisms of biologically and agriculturally important processes amenable to the tomato system including fruit development and ripening.
We previously described the Tomato Expression Database (TED), which serves as a central repository of tomato expression data and contains a suite of data presentation and analysis tools to assist in the development and testing of biological hypotheses (10). With the rapid accumulation of large-scale metabolite profile and sRNA data in tomato, we have expanded the database into what we now term the Tomato Functional Genomics Database (TFGD). Besides the newly added tomato metabolite and sRNA data sets, TFGD has been significantly improved with a number of new features and analysis tools. Furthermore, we have developed computational pipelines to process and analyze raw tomato microarray expression, metabolite profile and sRNA data sets, respectively, to ensure uniformity of the analyzed results for cross-experiment comparisons.
DATABASE CONTENTS AND FUNCTIONS
TFGD is a comprehensive collection of tomato functional genomics data. Currently, the database contains three major data components: gene expression, metabolite profiles and sRNAs. All the data were collected from the public domain with regular updates and retrieval of newly released data. The database is tightly linked to the Solanaceae Genomics Network (SGN, http://www.sgn.cornell.edu), a community database containing comprehensive genomics information for solanaceous species including the tomato genome sequence (11).
Annotations of microarray probes
Currently three microarray platforms are publicly available for tomato: TOM1 cDNA array, TOM2 oligonucleotide array and Affymetrix genome array. Probes on these three array platforms were annotated by comparing their corresponding consensus or SGN unigene sequences against GenBank nr, SwissProt/TrEMBL and Arabidopsis protein databases. Gene Ontology (GO) terms were then assigned to array probes using the Gene Ontology Annotation Database (12) based on their top Swiss-Prot/TrEMBL hits. GO terms assigned to each probe were then mapped to a set of plant specific GO slims using a Perl script, map2slim.pl, available at the Gene Ontology website (http://www.geneontology.org/GO.slims.shtml). Array probes were further assigned to tomato metabolic pathways based on the LycoCyc database (tomato metabolic pathway database) available at SGN.
Updates on tomato gene expression data
Tomato microarray data sets have been collected from public repositories including NCBI Gene Expression Omnibus (13) and EBI ArrayExpress (14), in addition to those directly submitted to TFGD. All array data sets are archived in TFGD following MIAME guidelines (15). Currently TFGD contains a total of 1308 hybridizations from 43 experiments, of which 773 248 and 287 are from TOM1 cDNA, TOM2 oligonucleotide and Affymetrix genome arrays, respectively (Table 1).
Table 1.
Statistics of tomato microarray experiments in TFGD
| Array platform | No. of experiments | No. of hybridizationsa | No. of distinct hybridizations |
|---|---|---|---|
| TOM1 cDNA array | 20 | 773 | 132 |
| TOM2 oligonucleotide array | 8 | 248 | 38 |
| Affymetrix genome array | 15 | 287 | 100 |
| Total | 43 | 1308 | 270 |
aIncluding biological and technical replicates.
To ensure uniformity of the analyzed results for cross-experiment comparisons, we have implemented computational pipelines to process the microarray data sets archived in our database. Briefly, for data sets generated using spotted arrays (TOM1 and TOM2), raw data were normalized using the print-tip LOWESS normalization strategy (16). Spots flagged by image quantification programs as poor quality and spots that were not expressed in both channels were filtered out. Probes with at least two replicated data points were included in downstream statistical analysis. Significance of differential gene expression was determined using Patterns from Gene Expression (PaGE) (17). For data sets generated using the Affymetrix array, raw array data (CEL files) were normalized at the probe level using the gcRMA algorithm (18) and significance of differential gene expression was determined with the LIMMA package (19). All raw and analyzed array data can be downloaded from the database without restriction.
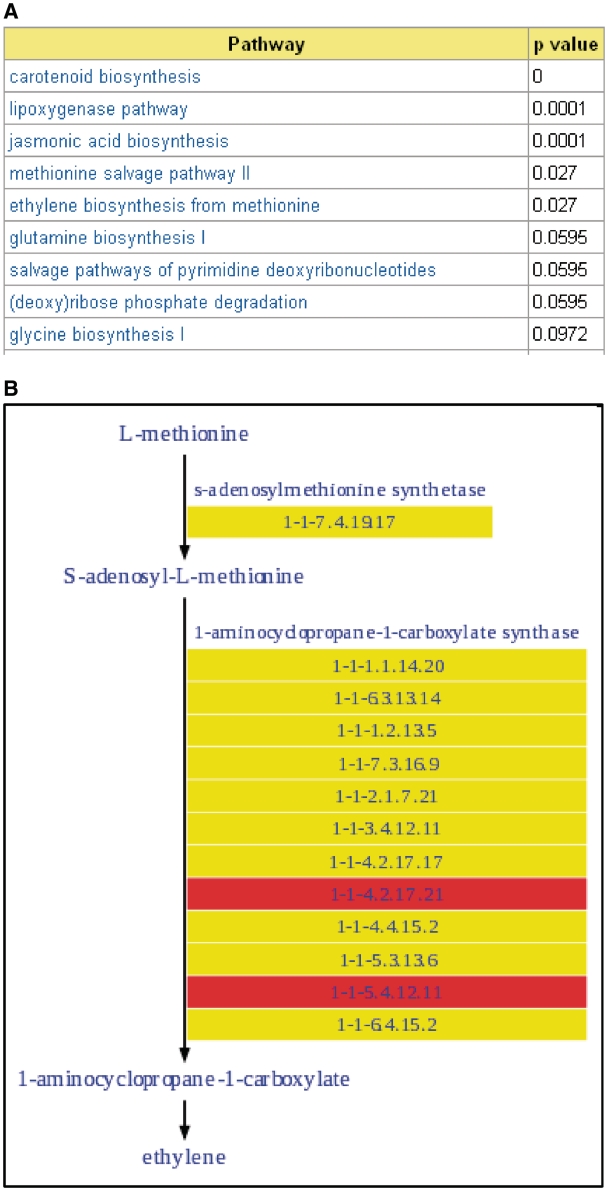
In addition to query interfaces and tools described in our previous report (10), a number of new tools to facilitate mining and analyzing the array results have been implemented. A co-expression analysis tool that can identify genes whose expression profiles are highly positively or negatively correlated with that of a given gene was implemented in TFGD. This tool can help to identify genes with similar functions since co-expressed genes are often involved in same or related pathways and biological processes. Microarray experiments typically produce a list of hundreds or thousands of interesting genes based on defined statistical criteria. Condensing and translating such a list into biologically meaningful and manageable information is required to better understand the underlying biological phenomena of interest. To achieve this goal, we implemented GO term enrichment analysis and biochemical pathway analysis tools in the database. Both tools were adopted from Plant MetGenMAP (20). The GO term enrichment tool, which was implemented based on the GO::TermFinder Perl module (21), can identify a set of over-represented GO terms reflecting highly affected biological processes from a list of user input genes or a microarray data set archived in the database. The pathway analysis tool can rapidly retrieve a list of significantly altered biochemical pathways (Figure 1A) and provide intuitive visualization of transcriptional events within a pathway with genes highlighted in different colors to reflect their expression level changes (Figure 1B). The results obtained from these analyses can provide insight into the mechanisms that underlie targeted biological phenomena or biochemical changes associated with them at the molecular level.
Figure 1.
Pathway analysis in the database. (A) Screenshot of an example result returned by the pathway analysis tool in TFGD which lists altered pathways identified from a gene expression data set. (B) Visualization of detailed transcript expression changes in a pathway.
One of the major tasks in gene expression data analysis is to sort a list of genes into different functional categories as a means of furthering downstream analysis. In TFGD, we implemented a tool that uses plant specific GO slims, which are a list of high level GO terms providing a broad overview of the ontology content (http://www.geneontology.org/GO.slims.shtml), to functionally classify a list of user input genes.
Tomato metabolite data
During the last decade, analyses of mRNA at the whole-genome level have proven central to most functional genomics initiatives. Recently, metabolite profiling has emerged as an additional layer of phenotypic information to more fully inform gene functional interpretation and has the potential not only to provide deeper insight into complex regulatory processes but also to determine biochemical and downstream phenotypes directly (22). Currently TFGD contains profiles of numerous flavor and nutrition-related metabolites. Fruit flavor and nutrition composition have clear positive human benefit. However flavor and nutrition are difficult traits to modify via either traditional breeding or transgenic approaches due to their generally complex biosynthetic and regulatory pathways. Recent advances in genomics, bioinformatics and high-throughput technologies provide an opportunity to dissect the regulatory mechanisms of fruit nutrition and flavor through systems biology to reveal key regulatory steps and thus putative targets for breeding or engineering. Profiles of a total of more than 60 flavor and nutrition-related metabolites from multiple seasons in the ripe fruit tissues of a collection of 76 S. pennellii-derived ILs (23) and a collection of 89 S. habrochaites-derived ILs (24), in addition to their corresponding parental control lines, have been generated (5,6) and archived in TFGD. These ILs represent overlapping single introgressions of the S. pennellii and S. habrochaites genomes, respectively, into the S. lycopersicum genome. Metabolite profiles from multiple seasons were analyzed using two-way ANOVA tests followed by post hoc Dunnett’s tests to identify lines with significant metabolite content changes compared to parental controls. Based on these metabolite profiles, multiple loci affecting fruit nutrition and flavor have been identified (5,6).
All the analyzed metabolite profile data were included in the database. Interfaces which allow users to efficiently retrieve profiles of a specific metabolite across all ILs in addition to metabolite profiles of a specific IL were implemented. Tools to identify ILs that display significant changes in a specific metabolite as well as ILs with specific metabolite properties were also implemented in the database.
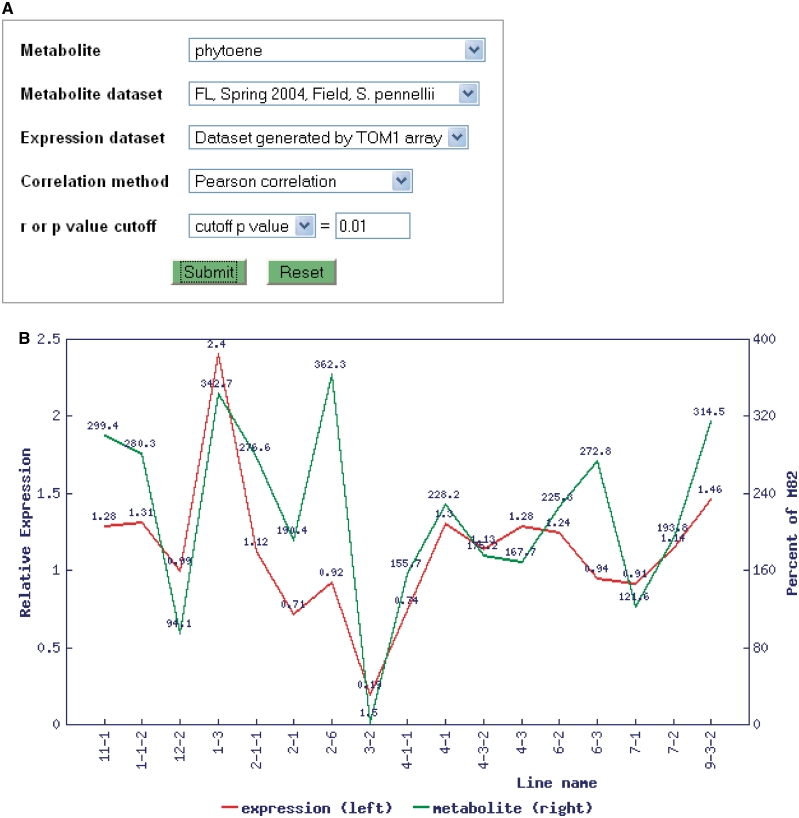
Transcriptome profiles of S. pennellii-derived ILs from the same tissue samples used for flavor and nutrition-related metabolite profile generation are all available in TFGD. Inclusion of both data types with tools that link them allows identification of novel genes involved in or regulating specific metabolic pathways using an integrated systems approach. To this end, a tool to correlate metabolite and transcript profiles by employing the Pearson or Spearman rank correlation coefficient to measure the similarity of profiles was implemented (Figure 2A). Using this tool, several meaningful and significant correlations between metabolite and gene expression profiles were identified (Figure 2B). In addition, a number of novel correlations have been observed. Based on these correlations, we have successfully identified a number of transcription factors associated with fruit metabolite levels and have functionally verified at least one which influences fruit ripening and carotenoid levels when repressed in transgenic tomato fruits (Lee and Giovannoni, submitted).
Figure 2.
Correlation analysis between gene expression and metabolite profiles in TFGD. (A) Interface of the correlation analysis. (B) An example of known correlations identified in the database: correlation between profiles of phytoene (green) and phytoene synthase (red) across 17 ILs (r = 0.655, P = 0.00432).
Tomato sRNA data
In the past few years, small RNAs (sRNAs) have been found to act as key regulators of cellular processes. They regulate gene expression by acting either on DNA to guide sequence elimination and chromatin remodeling or on RNA to guide cleavage and translation repression (25). Advances in high-throughput sequencing technologies have greatly accelerated the discovery and characterization of new classes of sRNAs including miRNA, ta-siRNA and nat-siRNA, as well as identification of their novel regulatory roles in diverse biological processes.
Recently several large-scale sRNA data sets have been generated for tomato (7–9; http://smallrna.udel.edu). TFGD provides a central repository with tools to disseminate these sRNAs and assist in their analysis. Currently, the database contains approximately 15.4 million sRNA sequences that are mainly derived from fruit, leaf and flower tissues, representing more than 5.3 million unique sRNAs. The sRNAs were first annotated by comparing them to rRNA, tRNA and tomato repeat sequence databases. miRNA candidates were then identified using an in-house pipeline. In short, highly abundant sRNAs were first aligned to tomato genome sequences and the flanking sequences (200 bp on each side) of sRNAs were extracted and folded in silico using the RNAfold program (26). Resulting folded structures were then checked with miRcheck (27) to identify potential miRNA candidates. These miRNA candidates were further compared to miRBase (28) to identify conserved miRNAs. In addition, potential miRNA star sequences for each miRNA candidate were also identified from the tomato sRNA data set. Finally, miRNA targets were identified using a program we developed according to the scoring matrix described in Jones-Rhoades and Bartel (29). Expression profiles of the target genes, if available, were provided in the database by linking to the gene expression module.
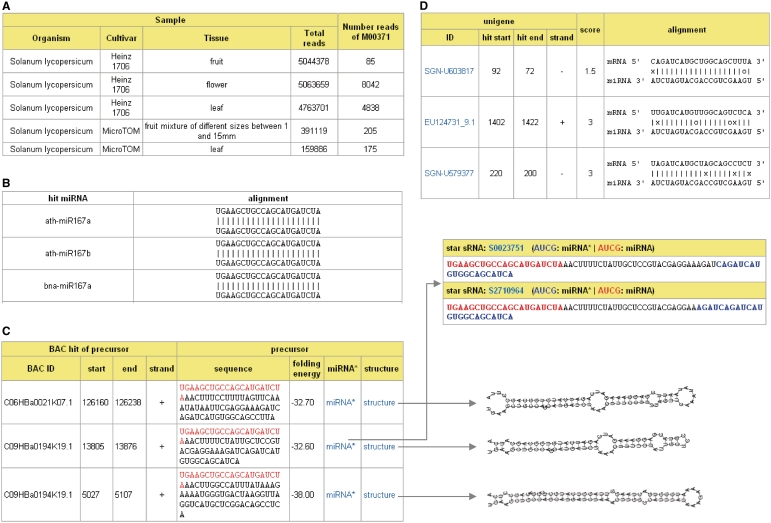
TFGD provides sRNA sequence data, annotations, their digital expression in each sample, and candidate miRNA information. For each candidate miRNA, the database provides several lines of evidence to determine the confidence that a given miRNA candidate is a true miRNA. Potential evidence includes the abundance of the candidate, whether the candidate is conserved with known miRNAs, and whether the miRNA candidate has corresponding miRNA star sequences, and predicted targets (Figure 3). Several query interfaces and tools have been developed to assist in exploring and analyzing the tomato sRNAs and miRNA candidates. Users can retrieve a specific family of miRNA candidates, as well as the most abundant sRNAs in each tissue. The database also allows users to compare their own sRNA sequences against the sRNAs archived in the database. Finally, a very useful tool to identify potential miRNA targets of user-supplied miRNA sequences and to identify tomato miRNAs that potentially target specific transcript sequences was developed and added to the database.
Figure 3.
Tomato miRNA candidate information in TFGD. (A) Abundances of a miRNA candidate in each sample. (B) Conservation between the miRNA candidate and known miRNAs. (C) miRNA candidate precursors and their secondary structures and corresponding miRNA star sequences. (D) Predicted miRNA targets.
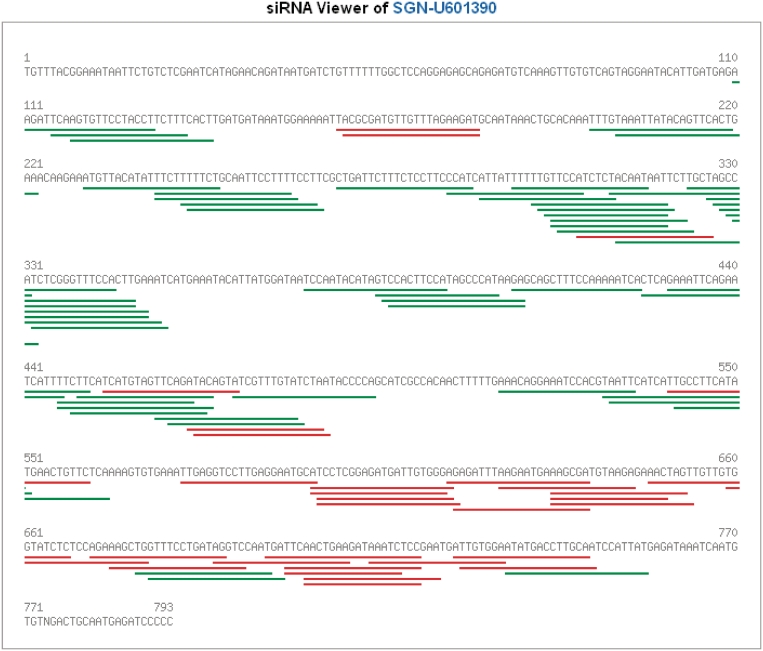
Tomato sRNAs were further aligned to EST/mRNA sequences, in order to identify small interference RNAs (siRNAs). A siRNA viewer was developed in the database which shows the distribution of siRNAs in each tomato gene (Figure 4). Expression profiles of siRNAs and their corresponding genes can be compared, which also helps in designing siRNAs to efficiently silence their target genes. In short, we have merged our sRNA and EST/gene expression functions to facilitate prediction and likelihood analysis of sRNA involvement in regulation of specific genes via a user driven interface.
Figure 4.
siRNA viewer in TFGD. siRNAs in red were aligned to mRNA in the forward direction while those in green were in the reverse direction.
FUTURE DIRECTIONS
The complex functions of a living cell are carried out through the concerted activity of many genes and gene products. This activity is often coordinated by the organization of the genome into regulatory modules, or sets of co-regulated genes that share a common function. Identifying these regulatory modules is crucial for understanding important cellular processes. For this purpose, we are identifying tomato regulatory modules using large-scale expression data sets archived in the database. In addition, with the recent completion of the tomato genome sequence, we are in the process of mapping probes on tomato arrays to the genome and extracting promoter sequences for every probe. Tools are being developed in the database to assist in the identification of regulatory motifs from sets of co-regulated genes. We will continue to collect and archive publicly available tomato microarray, metabolite profile and sRNA data sets, as well as incorporating emerging RNA-seq, proteomics and phenotypic data sets to insure capture and utilization of the full complement of public tomato genomics resources developed and released in the plant science community.
FUNDING
National Science Foundation (IOS-0501778 and IOS-0923312). Funding for open access charge: National Science Foundation.
Conflict of interest statement. None declared.
REFERENCES
- 1.Mueller L, Lankhorst RK, Tanksley SD, Giovannoni JJ, White R, Vrebalov J, Fei Z, van Eck J, Buels R, Mills AA, et al. A snapshot of the emerging tomato genome sequence. Plant Genome. 2009;2:78–92. [Google Scholar]
- 2.Aoki K, Yano K, Suzuki A, Kawamura S, Sakurai N, Suda K, Kurabayashi A, Suzuki T, Tsugane T, Watanabe M, et al. Large-scale analysis of full-length cDNAs from the tomato (Solanum lycopersicum) cultivar Micro-Tom, a reference system for the Solanaceae genomics. BMC Genomics. 2010;11:210. doi: 10.1186/1471-2164-11-210. [DOI] [PMC free article] [PubMed] [Google Scholar]
- 3.Carrari F, Baxter C, Usadel B, Urbanczyk-Wochniak E, Zanor MI, Nunes-Nesi A, Nikiforova V, Centero D, Ratzka A, Pauly M, et al. Integrated analysis of metabolite and transcript levels reveals the metabolic shifts that underlie tomato fruit development and highlight regulatory aspects of metabolic network behavior. Plant Physiol. 2006;142:1380–1396. doi: 10.1104/pp.106.088534. [DOI] [PMC free article] [PubMed] [Google Scholar]
- 4.Schauer N, Semel Y, Roessner U, Gur A, Balbo I, Carrari F, Pleban T, Perez-Melis A, Bruedigam C, Kopka J, et al. Comprehensive metabolic profiling and phenotyping of interspecific introgression lines for tomato improvement. Nat Biotechnol. 2006;24:447–454. doi: 10.1038/nbt1192. [DOI] [PubMed] [Google Scholar]
- 5.Tieman DM, Zeigler M, Schmelz EA, Taylor MG, Bliss P, Kirst M, Klee HJ. Identification of loci affecting flavour volatile emissions in tomato fruits. J. Exp. Bot. 2006;54:887–896. doi: 10.1093/jxb/erj074. [DOI] [PubMed] [Google Scholar]
- 6.Mathieu S, Dal Cin V, Fei Z, Li H, Bliss P, Taylor M, Klee H, Tieman D. Flavor compounds in tomato fruits: identification of loci and potential pathways affecting volatile composition. J. Exp. Bot. 2009;60:325–337. doi: 10.1093/jxb/ern294. [DOI] [PMC free article] [PubMed] [Google Scholar]
- 7.Pilcher RL, Moxon S, Pakseresht N, Moulton V, Manning K, Seymour G, Dalmay T. Identification of novel small RNAs in tomato (Solanum lycopersicum) Planta. 2007;226:709–717. doi: 10.1007/s00425-007-0518-y. [DOI] [PubMed] [Google Scholar]
- 8.Itaya A, Bundschuh R, Archual AJ, Joung JG, Fei Z, Dai X, Zhao PX, Tang Y, Nelson RS, Ding B. Small RNAs in tomato fruit and leaf development. Biochim Biophys Acta. 2008;1779:99–107. doi: 10.1016/j.bbagrm.2007.09.003. [DOI] [PubMed] [Google Scholar]
- 9.Moxon S, Jing R, Szittya G, Schwach F, Pilcher RLR, Moulton V, Dalmay T. Deep sequencing of tomato short RNAs identifies microRNAs targeting genes involved in fruit ripening. Genome Res. 2008;18:1602–1609. doi: 10.1101/gr.080127.108. [DOI] [PMC free article] [PubMed] [Google Scholar]
- 10.Fei Z, Tang X, Alba R, Giovannoni J. Tomato Expression Database (TED): a suite of data presentation and analysis tools. Nucleic Acids Res. 2006;34:D766–D770. doi: 10.1093/nar/gkj110. [DOI] [PMC free article] [PubMed] [Google Scholar]
- 11.Mueller LA, Solow TH, Taylor N, Skwarecki B, Buels R, Binns J, Lin C, Wright MH, Ahrens R, Wang Y, et al. The SOL Genomics Network: a comparative resource for Solanaceae biology and beyond. Plant Physiol. 2005;138:1310–1317. doi: 10.1104/pp.105.060707. [DOI] [PMC free article] [PubMed] [Google Scholar]
- 12.Camon E, Magrane M, Barrell D, Lee V, Dimmer E, Maslen J, Binns D, Harte N, Lopez R, Apweiler R. The Gene Ontology Annotation (GOA) Database: sharing knowledge in Uniprot with Gene Ontology. Nucleic Acids Res. 2004;32:D262–D266. doi: 10.1093/nar/gkh021. [DOI] [PMC free article] [PubMed] [Google Scholar]
- 13.Barrett T, Troup DB, Wilhite SE, Ledoux P, Rudnev D, Evangelista C, Kim IF, Soboleva A, Tomashevsky M, Marshall KA, et al. NCBI GEO: archive for high-throughput functional genomic data. Nucleic Acids Res. 2009;37:D885–D890. doi: 10.1093/nar/gkn764. [DOI] [PMC free article] [PubMed] [Google Scholar]
- 14.Parkinson H, Kapushesky M, Kolesnikov N, Rustici G, Shojatalab M, Abeygunawardena N, Berube H, Dylag M, Emam I, Farne A, et al. ArrayExpress update-from an archive of functional genomics experiments to the atlas of gene expression. Nucleic Acids Res. 2009;37:D868–D872. doi: 10.1093/nar/gkn889. [DOI] [PMC free article] [PubMed] [Google Scholar]
- 15.Brazma A, Hingamp P, Quackenbush J, Sherlock G, Spellman P, Stoeckert C, Aach J, Ansorge W, Ball CA, Causton HC, et al. Minimum information about a microarray experiment (MIAME)–toward standards for microarray data. Nat. Genet. 2001;29:365–371. doi: 10.1038/ng1201-365. [DOI] [PubMed] [Google Scholar]
- 16.Yang YH, Dudoit S, Luu P, Lin DM, Peng V, Ngai J, Speed TP. Normalization for cDNA microarray data: a robust composite method addressing single and multiple slide systematic variation. Nucleic Acids Res. 2002;30:e15. doi: 10.1093/nar/30.4.e15. [DOI] [PMC free article] [PubMed] [Google Scholar]
- 17.Grant GR, Liu J, Stoeckert CJ., Jr A practical false discovery rate approach to identifying patterns of differential expression in microarray data. Bioinformatics. 2005;11:2684–2690. doi: 10.1093/bioinformatics/bti407. [DOI] [PubMed] [Google Scholar]
- 18.Wu Z, Irizarry RA, Gentleman R, Martinez Murillo F, Spencer F. A model based background adjustment for oligonucleotide expression arrays. J. Am. Stat. Assoc. 2004;99:909–917. [Google Scholar]
- 19.Smyth GK. Linear models and empirical Bayes methods for assessing differential expression in microarray experiments. Stat. Appl. Genet. Mol. Biol. 2004;3:1–29. doi: 10.2202/1544-6115.1027. [DOI] [PubMed] [Google Scholar]
- 20.Joung JG, Corbett AM, Fellman SM, Tieman DM, Klee HJ, Giovannoni JJ, Fei Z. Plant MetGenMAP: an integrative analysis system for plant systems biology. Plant Physiol. 2009;151:1758–1768. doi: 10.1104/pp.109.145169. [DOI] [PMC free article] [PubMed] [Google Scholar]
- 21.Boyle EI, Weng S, Gollub J, Jin H, Botstein D, Cherry JM, Sherlock G. GO::TermFinder-open source software for accessing Gene Ontology information and finding significantly enriched Gene Ontology terms associated with a list of genes. Bioinformatics. 2004;20:3710–3715. doi: 10.1093/bioinformatics/bth456. [DOI] [PMC free article] [PubMed] [Google Scholar]
- 22.Fiehn O, Kopka J, Dörmann P, Altmann T, Trethewey RN, Willmitzer L. Metabolite profiling for plant functional genomics. Nat. Biotechnol. 2000;18:1157–1161. doi: 10.1038/81137. [DOI] [PubMed] [Google Scholar]
- 23.Eshed Y, Zamir D. A genomic library of Lycopersicon pennellii in L. esculentum: A tool for fine mapping of genes. Euphytica. 1994;79:175–179. [Google Scholar]
- 24.Monforte A, Tanksley S. Development of a set of near isogenic and backcross recombinant inbred lines containing most of the Lycopersicon hirsutum genome in a L. esculentum genetic background: a tool for gene mapping and gene discovery. Genome. 2000;43:803–813. [PubMed] [Google Scholar]
- 25.Vaucheret H. Post-transcriptional small RNA pathways in plants: mechanisms and regulations. Genes Dev. 2006;20:759–771. doi: 10.1101/gad.1410506. [DOI] [PubMed] [Google Scholar]
- 26.Hofacker IL. Vienna RNA secondary structure server. Nucleic Acids Res. 2003;31:3429–3431. doi: 10.1093/nar/gkg599. [DOI] [PMC free article] [PubMed] [Google Scholar]
- 27.Rajagopalan R, Vaucheret H, Trejo J, Bartel DP. A diverse and evolutionarily fluid set of microRNAs in Arabidopsis thaliana. Genes Dev. 2006;20:3407–3425. doi: 10.1101/gad.1476406. [DOI] [PMC free article] [PubMed] [Google Scholar]
- 28.Griffiths-Jones S, Saini HK, van Dongen S, Enright AJ. miRBase: tools for microRNA genomics. Nucleic Acids Res. 2008;36:D154–D158. doi: 10.1093/nar/gkm952. [DOI] [PMC free article] [PubMed] [Google Scholar]
- 29.Jones-Rhoades MW, Bartel DP. Computational identification of plant microRNAs and their targets, including a stress-induced miRNA. Mol. Cell. 2004;14:787–799. doi: 10.1016/j.molcel.2004.05.027. [DOI] [PubMed] [Google Scholar]


