Abstract
The aerial parts of the plant are generated by groups of rapidly dividing cells called shoot apical meristems. To analyze cell behavior in these structures, we developed a technique to visualize living shoot apical meristems using the confocal microscope. This method, combined with green fluorescent protein marker lines and vital stains, allows us to follow the dynamics of cell proliferation, cell expansion, and cell differentiation at the shoot apex. Using this approach, the effects of several mitotic drugs on meristem development were studied. Oryzalin (depolymerizing microtubules) very rapidly caused cell division arrest. Nevertheless, both cell expansion and cell differentiation proceeded in the treated meristems. Interestingly, DNA synthesis was not blocked, and the meristematic cells went through several rounds of endoreduplication in the presence of the drug. We next treated the meristems with two inhibitors of DNA synthesis, aphidicolin and hydroxyurea. In this case, cell growth and, later, cell differentiation were inhibited, suggesting an important role for DNA synthesis in growth and patterning.
INTRODUCTION
The aerial parts of the plant are generated by small groups of rapidly dividing cells called shoot apical meristems (SAMs). These are highly organized, stable structures divided into morphologically distinct domains (for reviews, see Steeves and Sussex, 1989; Lyndon, 1998; Traas and Doonan, 2001). These domains appear to have different functions. Thus, the central zone at the tip of the well-characterized angiosperm meristem is involved in meristem maintenance and provides a permanent source of stem cells. This group of cells is surrounded by the so-called peripheral zone, where new primordia are generated continuously. Although the meristem itself is extremely stable and capable of functioning for prolonged periods, its individual cells are dividing, expanding, and differentiating. Somehow, these highly dynamic cells must be coordinated in the meristem, because cell behavior at the shoot apex is very stereotypic. Cells in the central zone, for example, divide more slowly than those at the periphery, cell division planes are strictly oriented, and cells are recruited to form primordia at very specific positions at the meristem periphery.
These observations suggest very strict spatial control of cell behavior by the factors that coordinate meristem function. There is some evidence for such a scenario. Mutations in several regulators of meristem function also affect cell division and expansion patterns. The transcription factor AINTEGUMENTA (ANT), for instance, is involved in primordium outgrowth (Elliott et al., 1996; Mizukami and Fischer, 2000). Detailed cellular analysis has shown that the protein plays a role in the definition of cell numbers in all primordia (Mizukami and Fischer, 2000). Accordingly, its inactivation by mutation reduces the number of cells, whereas its ectopic expression increases cell numbers and organ size. This is correlated with the ectopic activation of the cell cycle gene cycD3.
For most of the meristem regulatory genes, however, the link with cell behavior remains unclear and sometimes even contradictory. This is typically illustrated by the homeodomain protein SHOOT MERISTEMLESS, a transcription factor involved in meristem maintenance that can have a positive or a negative effect on cell proliferation depending on the domain in which it is expressed (Long et al., 1996; Long and Barton, 1998). Indeed, some of the evidence contradicts the idea that cell behavior needs to be strictly controlled. Substantial changes in mitotic activity, for example, do not seem to alter dramatically the overall developmental patterns, as was shown for plants overexpressing KIP-related proteins, which are inhibitors of cell division (De Veylder et al., 2001a). Similarly, tonneau mutants, which are perturbed in division plane alignment and show important modifications in number of cell layers and organ shape, still present a normal overall body plan (Traas et al., 1995). The overexpression of a dominant-negative version of the cell cycle regulator CDK1 (cdc2aAt) in tobacco significantly perturbs cell division without having a major effect on organ size and development (Hemerly et al., 1995). Therefore, the role of meristem regulators in coordinating cell behavior remains unclear, and even the requirement for a strict coordination of cell behavior remains open for discussion.
A major obstacle to progress in this field is the lack of cell biological tools with which to study the SAM. In a previous study, we provided a detailed analysis of proliferation patterns in the Arabidopsis meristem by combining morphometric analysis and confocal microscopy (Laufs et al., 1998). Although this analysis yielded useful information regarding meristem organization and the role of several meristem regulators, it is not very well suited for the study of cell dynamics, because it is based on the use of fixed material. Because the direct observation of living material has been an important tool for the understanding of developmental processes (for work on plants, see van den Berg et al., 1995; Boisnard-Lorig et al., 2001), we decided to develop a method that permits the direct visualization of living SAMs. Here, we present an analysis of the control of cell proliferation, growth, and differentiation at the meristem.
RESULTS
Technical Aspects
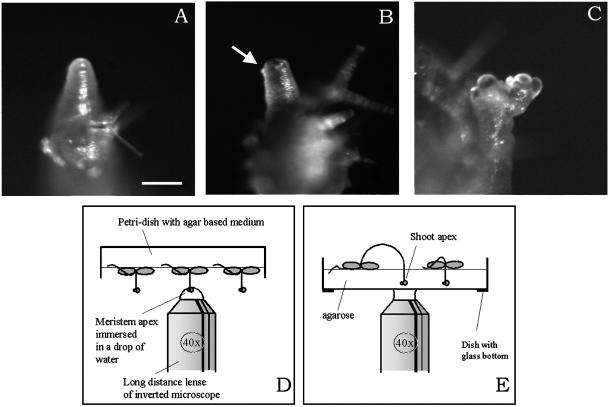
The SAM is usually well hidden by the primordia and young organs. Therefore, it cannot be observed directly with the microscope. To circumvent this problem, we germinated the plants on the auxin transport inhibitor napthylphthalamic acid (NPA), which prevents organ formation at the inflorescence SAM (Okada et al., 1991). Plants germinated on 10−6 to 10−5 μM NPA formed naked inflorescence meristems within 3 weeks (Figure 1A). The actual optimal concentration depended on the genotype and even the seed batch used. Some of the plants started to reform flower buds spontaneously while still on the drug. Optimal results were obtained, however, when the plants were transferred onto medium without NPA. In that case, they started to initiate primordia after 24 to 48 h. These young flower buds completely covered the meristem at 72 to 96 h after transfer (Figures 1B and 1C). Therefore, the SAM remained accessible for observation with the microscope for up to 5 days. Although the typical spiraled phyllotaxis usually was restored, this was not always the case, and in a number of meristems, phyllotaxis remained irregular for several plastochrons.
Figure 1.
Presentation of the Methods Used to Observe Living Meristems.
(A) to (C) Examples of regenerating meristems at 0 h (A), 48 h (B), and 96 h (C) after NPA treatment. The arrow in (B) points to a very young primordium. Bar = 100 μm.
(D) and (E) Diagrams of the experimental setup. Meristems of plants growing on normal medium can be immersed directly in a drop of water on a long-distance lens (D). Alternatively, the tips of the meristems can be immobilized in a thin layer of agarose in a dish with a glass bottom (E).
We tested two methods of observing meristems in the microscope (Figures 1D and 1E). First, plants growing on the medium could be observed directly by immersing the apex in a drop of water adhering to the objective (Figure 1D). Although this method gave high-resolution images, the meristems moved around slightly, which made the acquisition of image stacks more difficult. Therefore, we preferred to embed the apex of the intact plants in a thin layer of low-melting-point agarose poured on the glass bottom of a WillCo-dish designed especially for the observation of living cells (Figure 1E). This prevented meristem movements. In addition, the presence of agarose facilitated the administration of vital stains and drugs. A disadvantage of this method was that a significant number of meristems were lost because of damage during the procedure. Nevertheless, we still could follow ∼50% of the apices for at least 24 h. Note that because the meristems were embedded at a certain distance from the bottom of the dish, it was essential to use long-distance lenses.
Direct Observation of Living Cells
To visualize the cells, we tested different vital dyes. The stains could be mixed at a relatively low concentration in agarose before embedding, but better results were obtained if they were injected at higher concentrations (see Methods) just next to the SAMs. In particular, the stain FM 4-64 was very useful, because its emission spectrum could be separated from that of green fluorescent protein (GFP).
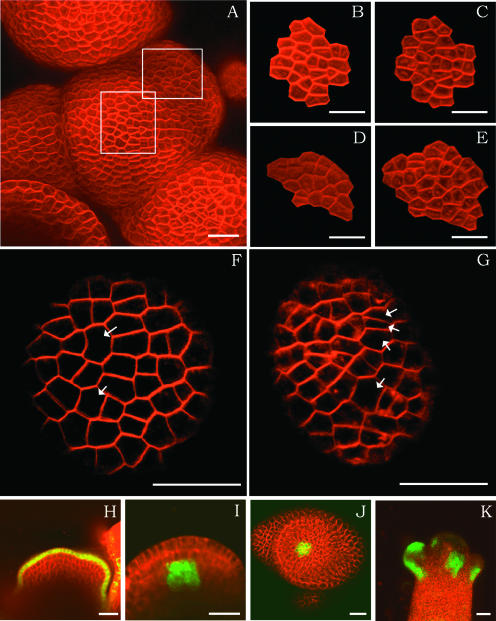
To test the method, we first analyzed cell proliferation and overall growth patterns in different parts of the meristem and compared the results with existing data. A typical meristem is shown in Figures 2A to 2E. A simple observation of the same group of cells followed for 31 h clearly shows that cells at the center of the SAM grew more slowly than those at the periphery, particularly those in the young primordia. In six meristems that were followed in detail, we observed that the mean increase in cell number per 24 h was 39.8% in the meristem dome and 81.1% in the faster growing primordia (Table 1). This observation, suggesting a significant difference between the center and the periphery, is in agreement with previous observations (for Arabidopsis data, see Laufs et al., 1998; for reviews, see Steeves and Sussex, 1989; Lyndon, 1998; Traas and Doonan, 2001). We noted, however, that growth rates on the meristem dome differed significantly from plant to plant. We could not determine if these variations were attributable to the method, to the area that was selected for quantification, or to physiological differences between the meristems independent of the method. As suggested by previous observations with fixed material (Laufs et al., 1998), there was no clear synchronization of cell divisions. In addition, even neighboring cells could have very different cell cycle rates. This is shown in Figures 2F and 2G: certain cells divided twice during a 24-h period, whereas others did not divide at all. Therefore, the method also revealed a feature that cannot be seen using fixed material (i.e., the heterogeneity in cell cycle duration within the meristem).
Figure 2.
Cell Behavior and Meristem Organization.
(A) An inflorescence apex showing a meristem and young primordia stained with FM 4-64. The meristem was followed for 31 h.
(B) and (C) Magnifications of the central part of the meristem shown in (A) (central square). Micrographs were taken at an interval of 31 h.
(D) and (E) Magnification of a group of cells forming a primordium (peripheral square in [A]). Cells at the periphery divide more quickly than cells in the center (same interval of 31 h).
(F) and (G) Detail of a floral primordium of another plant taken at an interval of 24 h. Note that certain cells (arrows) have divided twice, whereas others have not divided at all, showing the heterogeneous duration of the cell cycle.
(H) to (K) Expression patterns of the ATML1 promoter (H), the WUS promoter (longitudinal section [I] and transverse section [J]), and the ANT promoter (K) all driving GFP.
Bars = 20 μm.
Table 1.
Cell Proliferation Rates in the Meristems
| Meristem No. | Domain | Cell No. at Beginning | Cell No. at End | T | Divisions per 24 h | Increase in Cell No. per 24 h (%) |
|---|---|---|---|---|---|---|
| 1 | Meristem | 13 | 26 | 23 | 13.6 | 104.3 |
| 1 | Primordium | 12 | 27 | 23 | 15.7 | 130.4 |
| 2 | Meristem | 26 | 28 | 31 | 1.5 | 6.0 |
| 2 | Primordium | 19 | 35 | 31 | 12.4 | 65.2 |
| 3 | Meristem | 20 | 23 | 25 | 2.9 | 14.4 |
| 3 | Primordium | 20 | 28 | 25 | 7.7 | 38.4 |
| 4 | Meristem | 22 | 38 | 26 | 14.8 | 67.1 |
| 4 | Primordium | 15 | 22 | 10 | 16.8 | 112.0 |
| 5 | Meristem | 18 | 21 | 17 | 4.2 | 23.5 |
| 5 | Primordium | 10 | 17 | 17 | 9.9 | 98.8 |
| 6 | Meristem | 51 | 59 | 16 | 12.0 | 23.5 |
| 6 | Primordium | 43 | 55 | 16 | 18.0 | 41.9 |
Stacks of images were taken of growing meristems at time intervals (T) varying from 10 to 31 h. Subsequently, groups of cells were followed in the meristem dome and outgrowing primordia (cf. Figure 2). The number of cells in each group at time points 0 and T were counted. From this value, the increase in cell number per 24 h was calculated. The mean percentage increase in cell number per 24 h in meristem was 39.8%, and the mean percentage increase in cell number per 24 h in primordia was 81.1%.
Meristem Structure
To ensure that the method did not have major effects on overall meristem structure, we next used a number of lines expressing GFP under the control of the following meristem-specific promoters: pATML1, which is active in the L1 layer of the SAM; pWUSCHEL (pWUS), which is active in the central part of the SAM; pLEAFY (pLFY), which is active in the young primordia; and pAINTEGUMENTA (pANT), which also is active in the primordia. All constructs led to expression patterns that were very similar to the RNA in situ hybridization and promoter reporter patterns described previously (Figures 2H to 2K, 3, and 4) (Elliott et al., 1996; Blazquez et al., 1997; Mayer et al., 1998; Parcy et al., 1998; Sessions et al., 1999). This finding confirmed that the meristems had a normal overall organization. GFP fluorescence could be combined easily with the vital stains (Figures 2H to 2K and 3).
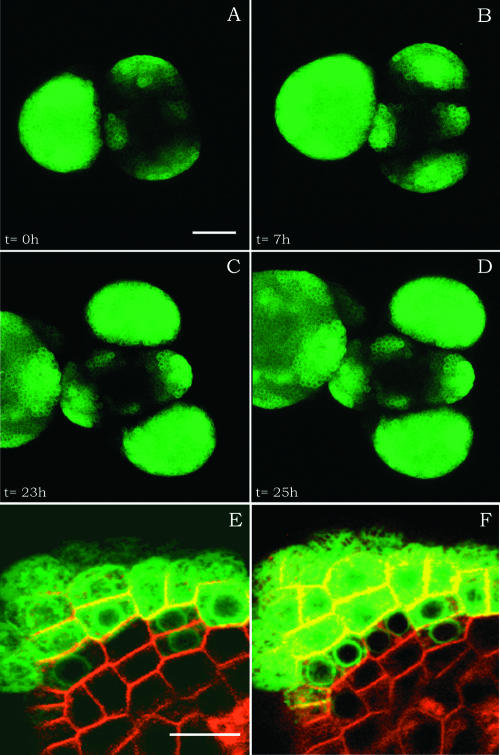
Figure 3.
Phyllotaxis and Cell Differentiation.
(A) to (D) Z projections of the same meristem expressing ANT:GFP at 24 to 49 h after NPA treatment. During this period, two new primordia were initiated. Phyllotaxis is comparable to that in the wild type. Bar = 40 μm.
(E) and (F) Details of another meristem expressing ANT:GFP and counterstained with FM 4-64. Cell differentiation and division can be monitored. Bar = 10 μm.
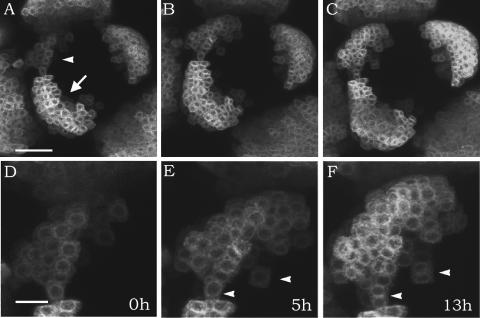
Figure 4.
Cell Recruitment During Organ Initiation.
(A) to (C) Primordium initiation in a meristem expressing GFP under the control of LFY:ALCR. The primordium indicated with an arrowhead was still recruiting cells, whereas the primordium indicated with an arrow was only growing by cell proliferation. Bar = 30 mm.
(D) to (F) Details of the initiating primordium shown in (A) to (C). During the 5 h between (D) and (E), new cells were added to the primordium. In the 8 h between (E) and (F), the primordium only grew by cell proliferation. Arrowheads point to cells that have divided. Bar = 10 μm.
Initiation of Cell Differentiation
After having characterized cell division, growth patterns, and meristem organization, we next examined the early steps of cell differentiation (i.e., when the cells are recruited into the young primordia). For this purpose, we applied the method described above to lines expressing GFP under the control of the primordium-specific promoters pANT and pLFY.
Although the rate of primordium initiation varied from meristem to meristem, the initiation of one or two primordia per 24 h was observed most commonly (Figure 3). We observed two steps during the early initiation process. First, we noticed a relatively rapid recruitment phase during which a group of cells joined a newly initiating primordium, thereby activating GFP. This phase was followed by a second phase in which the primordium only increased in cell number by cell proliferation.
We could not determine the precise dynamics, because the acquisition of more than four image stacks per 24 h could have negative effects on meristem growth. In most of the primordia, however, this period of recruitment lasted <24 h (i.e., less than one cell cycle). The precise number of cells was difficult to assess in most of the growing primordia, but the recruitment phase lasted until several tens of cells were reached. This is illustrated in Figure 4. We were able to count the number of cells in the recruiting primordium shown in Figures 4D to 4F using the original serial optical sections. In Figure 4D, the primordium already contained 30 cells, although it was still actively recruiting (cf. Figures 4D and 4E). In Figure 4E (5 h later), the same primordium contained 60 cells and was no longer recruiting (cf. Figures 4E and 4F) but grew only via cell proliferation.
Cell Growth after Oryzalin Treatments
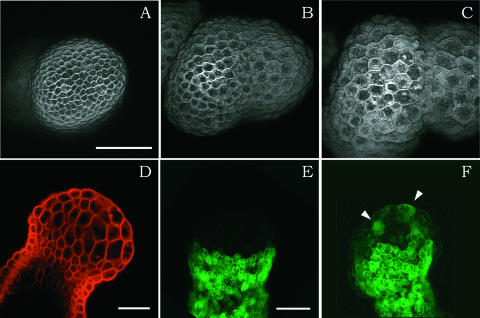
We next proceeded with a series of drug treatments to obtain further information on the link between cell proliferation and meristem development. The first drug we applied was oryzalin (a gift from Eli Lilly Co., Saint-Cloud, France), which depolymerizes microtubules (Morejohn et al., 1987) and can be used to block the cells in M-phase. At a concentration of 1 to 5 μg/mL, the drug very rapidly stopped cell division, and in general, no or very few cell divisions were observed after administration Figures 5A to 5C, Table 2). In contrast to cell division, however, cell expansion continued for at least 3 to 4 days in the presence of oryzalin, leading to the formation of giant, isodiametric cells. Interestingly, not all of the cells expanded equally.
Figure 5.
Oryzalin Treatment of Meristems That Have Not Yet Formed Primordia.
(A) to (C) Three images (three-dimensional reconstructions with the Power 3D software by Leica from serial optical sections) of the same meristem in the presence of oryzalin at the same magnification and after staining with FM 4-64 after 2 h (A), 26 h (B), and 44 h (C) of treatment. The cells do not divide but continue to grow. At the beginning of the treatment, the meristem had not yet formed any primordia. In presence of the drug, several bulges form. Bar = 50 μm.
(D) Longitudinal cross-section of another meristem treated with oryzalin after staining. Note that only the cells at the apex are swollen (i.e., the cells that were growing rapidly at the moment of drug treatment). The others do not appear to be affected. Bar = 50 mm.
(E) and (F) ANT:GFP activity in the same meristem treated with oryzalin for 1 h (E) and 24 h (F). New cells activate GFP (arrowheads), but no discrete primordia are formed. Bar = 50 μm.
Table 2.
Drug Treatments and Cell Proliferation
| Treatment | Increase in Cell No. per 24 h (%) |
No. of Cells at Time 0 |
No. of Plants |
|---|---|---|---|
| Control | 81.1 | 289 | 6 |
| Oryzalin | 0.3 | 230 | 7 |
| Aphidicolin | 19.0 | 166 | 6 |
| HU | 0.0 | 176 | 5 |
Cell proliferation rates in meristem primordia after drug treatments are shown. The increase in cell number per 24 h was determined as described for Table 1. Note the limited effect of aphidicolin.
We analyzed two types of meristems. First, when meristems were treated immediately after transfer from NPA (i.e., before the formation of new primordia), the rapid expansion was limited to the meristematic zone and there was a very sharp limit between expanding and nonexpanding cells (Figure 5D). The unequal expansion rates in these meristems also led to the formation of primordium-like bulges, which never developed into flowers.
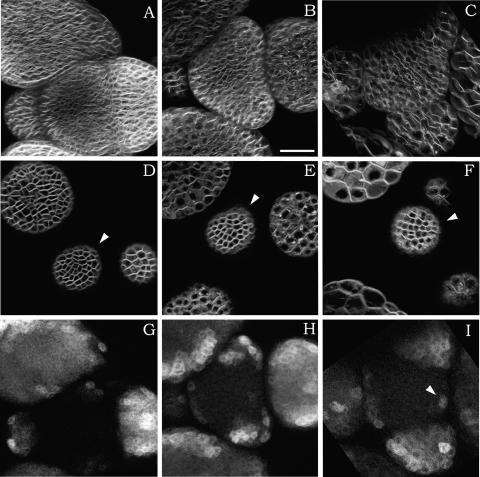
Second, when meristems that already had formed primordia were treated with oryzalin, an additional feature became apparent. Although again, cell division in these meristems was inhibited, cell expansion patterns were conserved: cells in the meristem itself grew much more slowly than those in the primordia (Figures 6A to 6F). Therefore, we concluded that the differential growth rates associated with meristem function and primordium outgrowth do not require cell division.
Figure 6.
Cell Expansion and Cell Differentiation in a Meristem Treated with Oryzalin Followed for 49 h.
(A) to (C) Z projections of serial sections to give an overall view (FM 4-64 staining). Cells at the periphery of the meristem clearly expand at a much faster rate than cells at the meristem center. Interval between (A) and (B), 15 h; interval between (A) and (C), 49 h.
(D) to (F) Single sections of the same meristem, again showing the difference in cell expansion between the meristem center and the periphery. The meristem center is indicated with the arrowheads.
(G) to (I) Z projections of serial sections of the same meristem, this time showing ANT:GFP labeling. New cells continue to activate the ANT promoter, even after several days in the presence of oryzalin. New groups of ANT-positive cells are generated approximately at the correct position, although the pattern is somewhat perturbed (e.g., only a single cell expresses GFP in [I], as indicated by the arrowhead).
Bar in (B) = 40 μm.
Early Cell Differentiation and Oryzalin Treatment
As mentioned above, bulges formed when primordiumless meristems were transferred directly from NPA to oryzalin. To determine if these outgrowths corresponded to primordia, we next studied the effects of the oryzalin on early cell differentiation using the GFP marker lines. When the drug was applied to a meristem that had not yet formed primordia, individual cells started to express primordium markers, showing that alterations in gene expression were possible (Figures 5E and 5F). However, no obvious recruitment of cells in discrete primordia was observed, because the bulges that formed in the presence of oryzalin did not necessarily express the GFP markers, and often only isolated cells or small groups of cells expressed GFP (Figure 5F, arrowheads). This finding suggested that these outgrowths were not bona-fide primordia.
As shown above, discrete primordia formed and even expanded when oryzalin was applied to a meristem that already had started to form primordia. These primordia also expressed the primordium GFP markers. Although the precise pattern was perturbed, the recruitment of new cells in existing primordia, and the recruitment of new groups of cells, continued for at least 48 h (Figures 6G to 6I). Together, these results suggest that cell division is not required during the early steps of cell differentiation as such. However, cell division does seem to be important to set up the patterns at the SAM.
DNA Synthesis in Drug-Treated Meristems
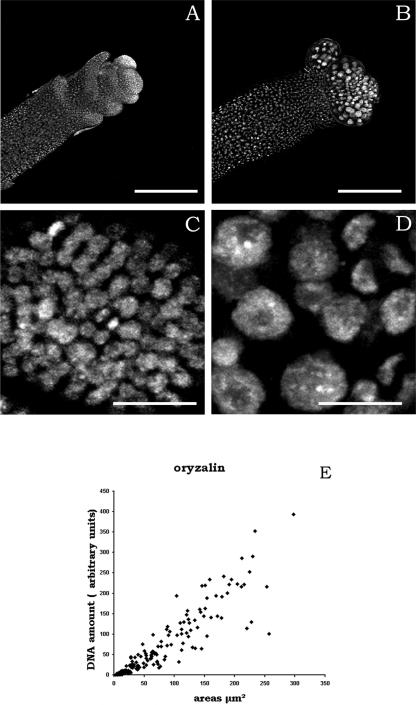
To obtain further insight into the effects of oryzalin on the cell cycle, we next investigated DNA synthesis. For this purpose, meristems were fixed and stained for DNA with propidium iodide as described previously (Laufs et al., 1998) after 48-h treatments. This treatment revealed important differences in nuclear size between the control meristems and the oryzalin-treated meristems (Figures 7A to 7D). Quantitative analysis of the fluorescence intensity using image analysis showed that the unequal nuclear size was the result of proportional differences in the amount of DNA (Figure 7). This finding implies that oryzalin blocks cell division but does not arrest DNA synthesis.
Figure 7.
Nuclear Size and Oryzalin Treatments.
(A) and (B) Low magnifications of the apices of control (A) and oryzalin-treated (B) plants. Bars = 200 μm.
(C) and (D) Higher magnifications showing the difference in nuclear size of the control (C) and oryzalin-treated (D) meristematic cells. Bars = 20 μm.
(E) Quantification of the relative amount of DNA and the size (expressed as the surface of the median section) of nuclei in oryzalin-treated meristems (diamonds). Control nuclei fell within the range of 0 to 13 units and are not shown. Many of the oryzalin-treated nuclei show a huge amplification of the DNA, the amount of DNA per nucleus being approximately proportional to the nuclear size (212 nuclei, three meristems).
Cell Growth after Aphidicolin and Hydroxyurea Treatment
To investigate the importance of DNA synthesis in growth at the meristem, we next used two inhibitors, aphidicolin and hydroxyurea (HU). Aphidicolin inhibited cell division (Table 2) and also slowed growth significantly (data not shown). This finding suggests a link between DNA synthesis and growth rates, but even in the presence of relatively high concentrations (25 μg/mL), a limited number of cells divided in the presence of the drug. Therefore, these results were not easy to interpret.
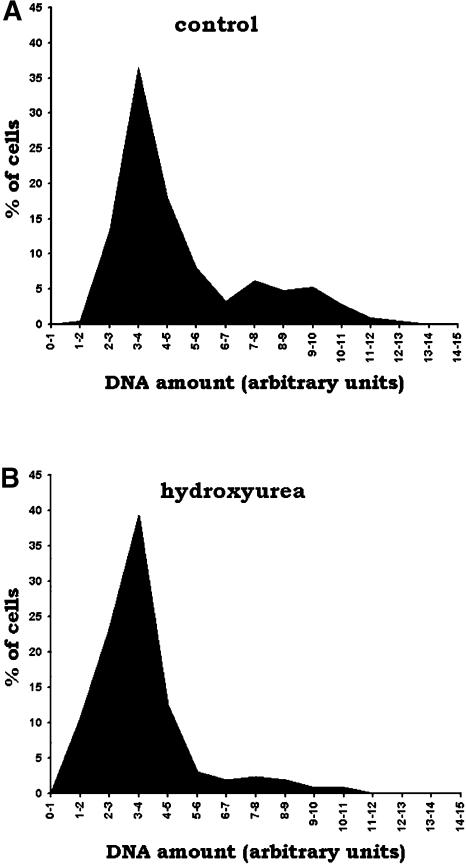
Because longer treatment with aphidicolin was not able to keep the cells blocked in G1/S-phase, we used HU to confirm the preliminary results obtained with aphidicolin. This drug needed to be used at high concentrations (>20 mM) to be effective, as has been described for certain animal (Ambros, 1999) and plant (de Almeida Engler et al., 1999) systems. Treatments with HU not only stopped cell division rapidly (Table 2, Figure 8) but also inhibited growth, as was observed initially for aphidicolin (Figures 9C and 9D). The drug blocks the cells in a very particular physiological state. Therefore, it is possible that it also inhibits gene transcription. To test this possibility, we used the LFY promoter driving GFP via the ethanol inducible system ALCR/ALCA (Caddick et al., 1998; see Methods). In the absence of ethanol, no GFP was visible. When ethanol was added as vapor to the plants, GFP expression was induced rapidly in both the presence and absence of HU (Figure 9F). Thus, we confirmed that the drug did not prevent RNA synthesis, as has been observed for other systems (Ambros, 1999).
Figure 8.
Quantification of DNA Using Image Analysis of Cells Stained with 4′,6-Diamidino-2-Phenylindole.
DNA amount is expressed in arbitrary units, as in Figure 7E.
(A) Quantification of the relative amount of DNA in nuclei from control plants. Two peaks are observed, which correspond to G1 and S/G2 cells (211 cells, four meristems).
(B) Quantification of the relative amount of DNA after HU treatment (262 cells, three meristems). Besides the major peak corresponding to G1 cells, only a small proportion of cells fall outside this peak, likely corresponding to cells blocked in S-phase. No M-phase cells are observed in these cell populations.
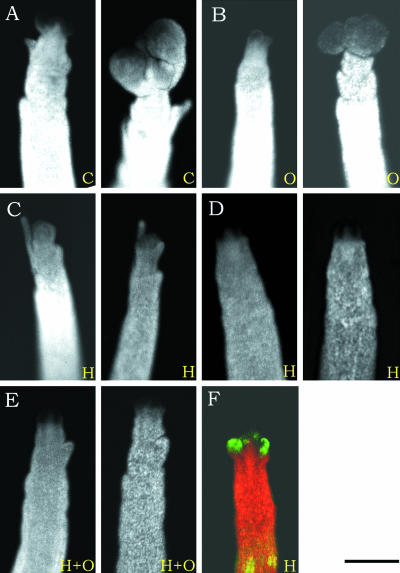
Figure 9.
Macroscopic Views of HU- and Oryzalin-Treated Apices.
(A) to (E) Macroscopic views of control apices (C) and apices treated with oryzalin (O), HU (H), and HU plus oryzalin (H+O). Micrographs were taken at 0 and 72 h after the start of treatment.
(F) Apex of a meristem expressing LFY:ALCR, which was first treated with HU for 72 h. Subsequently, ALCA:GFP was induced using ethanol vapors. This micrograph shows that in the presence of HU, transcription and translation are not inhibited.
To determine if the effects of HU (inhibition of cell division and growth) were dominant over those of oryzalin treatment (inhibition of cell division only), we treated cells with both HU and oryzalin (Figure 9E). In this double treatment, the effect of HU prevailed, because little or no growth of the cells was observed.
Because the HU treatments caused a true block in cell division, we next investigated the early steps of cell differentiation. As observed after oryzalin treatments, cells continued to differentiate in the presence of the drug, although no cell divisions were observed. In some meristems, this differentiation continued for several days, until a large part of the periphery of the meristem had activated the primordium marker (Figures 10A to 10C). Therefore, HU did inhibit cell growth and cell division, but initially, early cell differentiation continued. The recruitment of new cells in the LFY:ALC:GFP-expressing zone was blocked only later, possibly indirectly, as shown by the fact that no new competent cells were produced after growth had ceased.
Figure 10.
Effects of HU on Cell Expansion and Cell Differentiation.
Overview of a meristem expressing GFP under the control of LFY:ALCR after 7 h (A), 32 h (B), and 53 h (C) of treatment with HU (40 mM). Note that cell differentiation continues, although only one new zone expressing GFP is activated. Growth also is very limited (cf. Figure 4). Bar = 40 μm.
DISCUSSION
To date, in situ hybridization and immunolocalization studies combined with histological approaches have provided essential information on SAM function and structure. Existing microscopic techniques, however, are based on the use of fixed material, not necessarily accounting for all aspects of meristem dynamics. The observation of living material is extremely helpful in dissecting developmental and cellular processes. This is well illustrated by the cell ablation studies performed on Arabidopsis roots, revealing the importance of directional cell-to-cell signaling in the control of cell differentiation patterns (van den Berg et al., 1995). In the past, several attempts were made to study living cells in SAMs. Green and colleagues (1991), for example, used series of imprints in resin taken from the same meristem to follow cell proliferation and expansion patterns during prolonged periods (Dumais and Kwiatkowska, 2001). Here, we present a relatively simple technique that allows cell proliferation and cell differentiation to be visualized directly at the SAM. This method can be combined with inducible gene expression and is amenable to drug treatments and other experimental procedures such as laser ablation. The plants are pretreated with NPA, which raises the question of potential artifacts. A careful analysis of meristem structure and the functional division into domains revealed no major modifications induced by the method. In a number of cases, however, meristem development was arrested, whereas in others, phyllotaxis remained irregular. However, these artifacts do not present a major obstacle, because the abnormal meristems can be discarded easily a posteriori. Therefore, this method is an extremely useful tool with which to study the dynamics of pattern formation and growth at the SAM.
Cell Division and Growth
The link between cell cycle regulation and growth has been debated extensively. Although cell division and cell growth often are seen as the same process, this relationship is not obvious, and contradictory results have been reported (for review, see Traas and Doonan, 2001). In classic experiments on irradiated plants, during which cell division was blocked, Foard (1971) presented evidence that growth and even organogenesis can proceed without any cell proliferation. Likewise, cell cycle arrest in colchicine-treated roots from radish did not prevent the initiation of lateral roots (reviewed by Steeves and Sussex, 1989). Although these experiments suggest that proliferation is not the driving force behind growth and patterning, others suggest the importance of cell expansion control in this context. In certain cases, the activation of cell expansion even seems to drive cell division and cell differentiation. Thus, the local increase in the concentration of a cell expansion–promoting enzyme, expansin, causes the ectopic outgrowth of a novel primordium (Fleming et al., 1997). This finding shows that an increase in cell expansion rate can launch an entire developmental program.
However, contrasting evidence exists. The overexpression of certain cell cycle regulators, such as D3-cyclin, speeds up cell proliferation and growth at the meristems and interferes with developmental patterns (Riou-Khamlichi et al., 1999). Overexpression of CKS1At, a putative regulator of cyclin-dependent kinase activity in Arabidopsis (De Veylder et al., 2001b), slows both the cell division rate and cell growth in roots. This finding suggests that cell growth does depend on cell proliferation, or at least that some of the cell cycle regulators also interfere with cell expansion (for discussion, see Traas and Doonan, 2001; Wyrzykowska et al., 2002). Our results with oryzalin-treated SAMs initially seemed to indicate that cell growth patterns could be uncoupled completely from the cell cycle, because cells continued to grow after the characteristic gradients and new primordia were initiated. A subsequent analysis of the DNA synthesis patterns, however, showed that oryzalin did not block the cells in G2/M, as expected; rather, the cells immediately switched to endoreduplication. This was a surprising result, because interruption of the mitotic spindle using microtubule inhibitors usually leads to M-phase (for review, see Ravid et al., 2002). Several mutations are able to overcome this block or checkpoint, such as mutations in homologs of the MAD2 gene in both humans and yeast and pRB in mammals. Although nothing is known about the molecular basis of this checkpoint in higher plants, it appears that it was inactivated in the meristem by our oryzalin treatments. Whether this reflects a particular feature of the checkpoint regulation in meristematic cells remains to be determined.
Whatever the mechanism leading to endoreduplication during treatment, oryzalin did not seem to affect growth patterns. Therefore, we uncoupled growth patterns from cell division per se but could not uncouple growth from DNA synthesis. This result was further elaborated by treatments with aphidicolin and HU, blocking the cell cycle at S-phase. Both drugs had a clear effect on cell expansion, suggesting a coupling between DNA synthesis and cell expansion. There is an extensive body of evidence in the literature that final cell size (or the amount of cytoplasm) is strongly correlated with the amount of nuclear DNA (for review, see Traas et al., 1998). Although much of this work concerns terminally differentiated cells, our results favor a model in which DNA synthesis also is a very important factor in the coordination of growth at the meristem. How these processes, and in more general terms, cell cycle and growth, are linked in plants is not well understood, but it could be achieved by regulators that play a role in both mechanisms at the same time. In animals, E2Fs, which are transcription factors classically associated with cell proliferation, also regulate genes involved in a range of other developmental processes, from cell differentiation to apoptosis (Müller et al., 2001). In plant cell suspension cultures, extensive analyses of gene expression patterns during the cell cycle suggested that several genes involved in cell growth and metabolism also are regulated by the cell cycle (Breyne et al., 2002; Menges et al., 2002).
Cell Cycle and Early Cell Differentiation
In many systems, G1 appears to be a privileged phase for terminal cell differentiation (Zhu and Skoultchi, 2001). However, much less is known regarding the potential role of cell cycle regulation during intermediate steps of cell differentiation. Work with Caenorhabditis elegans suggests that subsequent stages of cell fate determination during vulva development could be linked to specific cell cycle phases. Such a coupling could provide a way for multipotential cells to order steps in cell differentiation (Ambros, 1999). A link between the cell cycle and intermediate differentiation steps during embryogenesis also was proposed for Arabidopsis. In this species, HOBBIT, a cell cycle–regulated homolog of the CDC27 subunit of the anaphase-promoting complex, is not required for cell cycle progression, although its mutation does perturb the progress of cell differentiation (Blilou et al., 2002). At this stage, further work is required to establish whether a cell cycle “gating” of differentiation also occurs at the shoot apex. Such a scenario was not supported by our HU treatments. Although the cells were blocked in G1 by the drug, cell differentiation was not, and it continued for several days, suggesting that the differentiation step did not occur obligatorily when a particular moment in G1 had been reached. In these meristems, cell differentiation eventually was arrested after prolonged treatments, but this could be caused by indirect effects.
In a recent study, Wyrzykowska and Fleming (2003) perturbed the formation of cross-walls by misexpression of phragmoplastin and observed that this caused abnormal gene expression patterns at the apex. Our results also support a role for cell division per se at the meristem: although oryzalin still permitted cell differentiation and cycling (endoreduplication), the drug did perturb the control of pattern formation. This was particularly striking when the drug was applied when primordia had not yet formed. In this case, growth continued, but the pattern could not be set up. This could be a result of the direct effect of oryzalin on the cytoskeleton. The latter is an important factor in essential aspects of development, such as cell polarity and division plane alignment. For example, recent work has shown that the polar localization of membrane transporters of the PIN family is associated with the correct transport and distribution of auxin (Gälweiler et al., 1998; Geldner et al., 2003). The depolymerization of microtubules could interfere with the correct localization of this type of protein in the growing apex and thus perturb the signaling pathways involved in the coordination of cell differentiation.
Primordium Initiation and the Number of Founder Cells
We observed that cells were recruited very fast in the young primordia. This recruitment phase lasted until the anlage contained at least 30 to 50 cells. This result was somewhat surprising, because previously, clonal analysis suggested that flowers in Arabidopsis are derived from four precursor cells (Bossinger and Smyth, 1996). There are several possible explanations for this apparent contradiction. First, it could be that cell fate becomes restricted at the four-cell stage but the actual differentiation, visualized by the activation of LFY and ANT, occurs approximately three to four cell cycles later. A second possibility is that only a subset of the cells expressing LFY:ALCR and ANT:GFP are used to generate the flower buds. Long and Barton (2000) proposed that the initial domain expressing ANT at the inflorescence SAM corresponds to a cryptic bract that fails to grow out. In such a situation, the GFP-positive cells observed during the very early stages of primordium initiation would not correspond to the cells that generate the flower. To distinguish between these different possibilities, we are currently performing a detailed clonal analysis of living meristems.
METHODS
Plant Lines and Constructs
Wild-type lines of Arabidopsis thaliana ecotype Wassilewskija or Columbia were used to follow cell division and expansion. To follow cell differentiation during primordium initiation, several lines expressing GFP under the control of primordium promoters were used. A 4.2-kb fragment of the ANT promoter region (upstream of the ANT initiation codon) driving an endoplasmic reticulum–targeted version of GFP (a gift from Jim Haseloff, University of Cambridge, Cambridge, UK) (Haseloff et al., 1997) was introduced into the Columbia background.
The other promoters were used to drive the ethanol-inducible ALCR transcription factor (Caddick et al., 1998; Deveaux et al., 2003). The promoter:ALCR constructs also contained the ALCA promoter driving the endoplasmic reticulum–targeted version of GFP (Fernandez Abalos et al., 1998) (a gift from John Doonan, John Innes Centre, Norwich, UK). Three different promoters were combined with the ALCR/ALCA system. First, a 2.3-kb fragment of the LFY promoter (a gift from F. Parcy, Gif-sur-Yvette, France) (Blazquez et al., 1997; Deveaux et al., 2003) was used. A 3907-bp PCR fragment of the ATML1 gene containing the promoter and 83 bp of the first exon of AtML1 was amplified from Arabidopsis genomic DNA using ML1-NotI (5′-GCGGCCGCACAAGCCGTAGATGATTGGT-3′) and ML1-SpeI (5′-ACTAGTATAGCCGGTCAAGACATAAC-3′) primers and cloned into the NotI and SpeI sites of pLP999, driving the expression of ALCR (Deveaux et al., 2003). A similar fragment was shown by Sessions et al. (1999) to confer L1-specific expression.
A PCR fragment of 1724 bp containing the promoter region of the WUSCHEL gene (Mayer et al., 1998) and ending at the ATG was amplified from Arabidopsis genomic DNA using WUS-NotI (5′-GCGGCCGCCAATATAATCGACTAAAGTT-3′) and WUS-SpeI (5′-ACTAGTGTGTTTGATTCGACTTTT-3′) primers and cloned into pLP999 (Deveaux et al., 2003). In all cases, GFP expression was induced rapidly (4 h) by adding 0.05 to 0.1% ethanol to the agarose medium surrounding the meristem or by placing the lid of an Eppendorf tube with 100 mL of 10% ethanol in the Petri dish with the plantlets.
Plant Culture
Seeds were sown in Petri dishes with a medium adapted for Arabidopsis (Hamant et al., 2002). After 2 days at 4°C, the seeds on medium were put into growth chambers at 20°C and 16 h of light. For napthylphthalamic acid treatment, 10−5 to 10−6 M napthylphthalamic acid was added to the medium. As soon as naked inflorescences had formed, the plants were transferred to medium without inhibitor. To induce ALCR, plants were grown in nonsealed Petri dishes in the presence of 100 μL of 10% ethanol in water. Treatment with ethanol vapor for 8 h was sufficient to activate the ALC constructs for a period of at least 24 h, but in general, the plants were left in the presence of ethanol vapor during the experiment.
Confocal Microscopy
Meristems were examined with a TCS-NT confocal laser scanning microscope (Leica, Heidelberg, Germany) with an argon/krypton laser (Omnichrome, Chino, CA) and an acousto-optical tunable filter for excitation. A reflective short-pass filter (RSP580) was used to divide the emission beam in two. The GFP fluorescence was collected through a band-pass filter (BP525/50), and the red vital dye FM 4-64 was collected through a long-pass filter (LP590) after excitation at 488 nm. Medium-scan images (450 lines/s; 512 × 512 pixels) were generated using a long-distance Leica lens (40X0,8NA water HCX APO L).
The inflorescences were observed with an inverted DM IRB microscope (Leica). As a consequence, the plants were observed with their meristems down. As soon as a stack of images was obtained for a particular meristem, the plant was put back into the growth chamber, meristem up, to recover. In some cases, the meristems of plants growing in Petri dishes were immersed directly in a drop of water on the long-distance ×40 lens (free working distance = 3.3 mm). Alternatively, the inflorescence meristem was embedded in a layer of low-melting-point agarose (Sigma, St. Louis, MO), the tip of the meristem being close to the bottom of a WillCo-dish (WillCo Wells, Amsterdam, The Netherlands) with a glass bottom (Figure 1). The best results were obtained when the meristems were embedded while the agarose was not completely solid.
Stacks of serial optical sections were analyzed further using Optimas 6 software (IMASYS, Suresnes, France) and ImageJ (a public-domain Java image-processing program inspired by NIH Image). The cells in agarose were stained by injecting fluorescent dyes next to the meristems. Several stains were tested. First, we tried propidium iodide, which is used frequently to visualize root cells (van den Berg et al., 1995). Although this molecule allowed us to stain shoot apical meristem cells, it did not always result in a homogeneous visualization of all cell walls, and often only a small area surrounding the occasional damaged cell was stained clearly. Apart from this problem, we also noted that propidium iodide had a toxic effect, particularly at the concentrations required to stain the shoot apical meristem (10 to 50 μg/mL). Therefore, we tested membrane-specific stains. Two of these gave satisfactory results: FM 1-43 (Molecular Probes Europe, Leiden, The Netherlands), which, according to the manufacturer, emits a yellow-orange fluorescence between 500 and 650 nm after excitation at 488 nm, and FM 4-64 (Molecular Probes Europe), which mainly emits red light (emission maximum at 617 nm) after excitation at 488 nm, again as indicated by the manufacturer. Both stains gave optimal results when a small drop (10 μL) with a concentration of 50 μg/mL was injected next to the apices. Depending on the meristem, it was necessary to add extra stain every 24 to 48 h. For unknown reasons, not all of the meristems could be stained homogeneously. Nevertheless, in approximately half of the growing meristems, all cells could be visualized.
For the visualization of nuclei by confocal microscopy, plants were fixed in 4% paraformaldehyde and stained with propidium iodide as described by Laufs et al. (1998). For quantification of DNA, meristems were fixed in 4% formaldehyde in PME buffer (100 mM Pipes, pH 6.9, 10 mM MgSO4, and 10 mM EGTA). After fixation, the meristems were treated with the cell wall–degrading enzyme Driselase (Sigma) in PME buffer for 30 min. The tips of the meristems then were blotted onto cover slips coated with poly-l-lysin (Starfrost, Knittel Glaser, Braunschweig, Germany) to obtain cells from the meristematic L1 layer only. After air drying, the DNA was stained using 4′,6-diamidino-2-phenylindole (Sigma) at 1 μg/mL in PME buffer. The relative amount of staining was finally measured using image-analysis software as described previously (Gendreau et al., 1998).
Drug Treatments
For drug treatments, meristems embedded in low-melting-point agarose (Sigma) were used. The drugs were added to the agarose at defined concentrations before embedding. Oryzalin was a generous gift from Lilly Co., and aphidicolin and hydroxyurea were obtained from Sigma. In some experiments, oryzalin (at 10 μg/mL) was injected into the agarose next to the meristem.
Upon request, materials integral to the findings presented in this publication will be made available in a timely manner to all investigators on similar terms for noncommercial research purposes. To obtain materials, please contact Jan Traas, jan.traas@versailles.inra.fr.
Acknowledgments
We thank Véronique Pautot and Gethin Roberts for critical reading of the text and for discussion. Halima Morin is thanked for help with plant culture. This project was partially financed by an Action Concertée Incitative grant from the French Ministry of Research, by the European Union European Cell Cycle Consortium project, and by a grant from the French Ministry of Research to T.V.
Article, publication date, and citation information can be found at www.plantcell.org/cgi/doi/10.1105/tpc.017962.
References
- Ambros, V. (1999). Cell-cycle dependent sequencing of cell fate decisions in Caenorhabditis elegans vulva precursor cells. Development 126, 1947–1956. [DOI] [PubMed] [Google Scholar]
- Blazquez, M.A., Soowal, L.N., Lee, I., and Weigel, D. (1997). LEAFY expression and flower initiation in Arabidopsis. Development 124, 3835–3844. [DOI] [PubMed] [Google Scholar]
- Blilou, I., Frugier, F., Folmer, S., Serralbo, O., Willemsen, V., Wolkenfelt, H., Eloy, N., Ferreira, P.C.G., Weisbeek, P., and Scheres, B. (2002). The Arabidopsis HOBBIT gene encodes a CDC27 homolog that links the plant cell cycle to progression of cell differentiation. Genes Dev. 16, 2566–2575. [DOI] [PMC free article] [PubMed] [Google Scholar]
- Boisnard-Lorig, C., Colon-Carmona, A., Bauch, M., Hodge, S., Doerner, P., Bancharel, E., Dumas, C., Haseloff, J., and Berger, F. (2001). Dynamic analyses of the expression of the HISTONE:YFP fusion protein in Arabidopsis show that syncytial endosperm is divided in mitotic domains. Plant Cell 13, 495–509. [DOI] [PMC free article] [PubMed] [Google Scholar]
- Bossinger, G., and Smyth, D.R. (1996). Initiation patterns of flower and floral organ development in Arabidopsis thaliana. Development 122, 1093–1102. [DOI] [PubMed] [Google Scholar]
- Breyne, P., Dreesen, R., Vandepoele, K., De Veylder, L., Van Breusegem, F., Lindy Callewaert, L., Rombauts, S., Raes, J., Cannoot, B., Engler, G., Inzé, D., and Zabeau, M. (2002). Transcriptome analysis during cell division in plants. Proc. Natl. Acad. Sci. USA 99, 14825–14830. [DOI] [PMC free article] [PubMed] [Google Scholar]
- Caddick, M.X., Greenland, A., Jepson, A., Krause, K., Qu, N., Riddell, K., Salter, M., Schuch, W., Sonnewald, U., and Tomsett, A. (1998). An ethanol inducible gene switch for plants used to manipulate carbon metabolism. Nat. Biotechnol. 16, 177–180. [DOI] [PubMed] [Google Scholar]
- de Almeida Engler, J., De Vleesschauwer, V., Burssens, S., Celenza, J., Inzé, D., Van Montagu, M., Engler, G., and Gheysen, G. (1999). Molecular markers and cell cycle inhibitors show the importance of cell cycle progression in nematode induced galls and syncytia. Plant Cell 11, 793–807. [DOI] [PMC free article] [PubMed] [Google Scholar]
- Deveaux, Y., Peaucelle, A., Roberts, G.R., Coen, E., Simon, R., Mizukami, Y., Traas, J., Murray, J.A.H., Doonan, J.H., and Laufs, P. (2003). The ethanol switch: A tool for tissue-specific gene induction during plant development. Plant J., in press. [DOI] [PubMed]
- De Veylder, L., Beeckman, T., Beemster, G.T.S., Krols, L., Terras, F., Landrieu, I., Van Der Schueren, E., Maes, S., Naudts, M., and Inzé, D. (2001. a). Functional analysis of cyclin-dependent kinase inhibitors of Arabidopsis. Plant Cell 13, 1653–1667. [DOI] [PMC free article] [PubMed] [Google Scholar]
- De Veylder, L., Beemster, G.T., Beeckman, T., and Inze, D. (2001. b). CKS1At overexpression in Arabidopsis thaliana inhibits growth by reducing meristem size and inhibiting cell-cycle progression. Plant J. 25, 617–626. [DOI] [PubMed] [Google Scholar]
- Dumais, J., and Kwiatkowska, D. (2001). Analysis of surface growth in shoot apices. Plant J. 31, 229–241. [DOI] [PubMed] [Google Scholar]
- Elliott, R.C., Betzner, A., Huttner, E., Oakes, M.P., Tucker, W.Q., Gerentes, D., Perez, P., and Smyth, D.R. (1996). AINTEGUMENTA, an APETALA2-like gene of Arabidopsis with pleiotropic roles in ovule development and floral organ growth. Plant Cell 8, 155–168. [DOI] [PMC free article] [PubMed] [Google Scholar]
- Fernandez-Abalos, J.M., Fox, H., Pitt, C., Wells, B., and Doonan, J. (1998). Plant adapted green fluorescent protein is a versatile reporter for gene expression, protein localization and mitosis in the filamentous fungus Aspergillus nidulans. Mol. Microbiol. 27, 121–130. [DOI] [PubMed] [Google Scholar]
- Fleming, A.J., McQueen-Mason, S., Mandel, T., and Kuhlemeier, C. (1997). Induction of leaf primordia by the cell wall protein expansin. Science 276, 1415–1418. [Google Scholar]
- Foard, D.E. (1971). The initial protrusion of a leaf primordium can form without concurrent periclinal cell divisions. Can. J. Bot. 49, 694–702. [Google Scholar]
- Gälweiler, L., Guan, C., Müller, A., Wisman, E., Mendgen, K., Yephremov, A., and Palme, K. (1998). Regulation of polar auxin transport by AtPIN1 in Arabidopsis vascular tissue. Science 282, 2226–2230. [DOI] [PubMed] [Google Scholar]
- Geldner, N., Anders, N., Wolters, H., Keicher, J., Kornberger, W., Muller, P., Alain Delbarre, A., Ueda, T., Nakano, A., and Jürgens, G. (2003). The Arabidopsis GNOM ARF-GEF mediates endosomal recycling, auxin transport, and auxin-dependent plant growth. Cell 112, 219–230. [DOI] [PubMed] [Google Scholar]
- Gendreau, E., Hofte, H., Grandjean, O., Brown, S., and Traas, J. (1998). Phytochrome controls the number of endoreduplication cycles in the Arabidopsis thaliana hypocotyl. Plant J. 13, 221–230. [DOI] [PubMed] [Google Scholar]
- Green, P., Havelange, A., and Bernier, G. (1991). Floral morphogenesis in Anagallis: Scanning electron micrograph sequences from individual growing meristems before, during and after the transition to flowering. Planta 185, 502–512. [DOI] [PubMed] [Google Scholar]
- Hamant, O., Nogue, F., Belles-Boix, E., Jublot, D., Grandjean, O., Traas, J., and Pautot, V. (2002). The KNAT2 homeodomain protein interacts with ethylene and cytokinin signaling. Plant Physiol. 130, 657–665. [DOI] [PMC free article] [PubMed] [Google Scholar]
- Haseloff, J., Siemering, K., Prasher, D., and Hodge, S. (1997). Removal of a cryptic intron and subcellular localization of green fluorescent protein are required to mark transgenic Arabidopsis plants brightly. Proc. Natl. Acad. Sci. USA 94, 2122–2127. [DOI] [PMC free article] [PubMed] [Google Scholar]
- Hemerly, A., de Almeida Engler, J., Bergounioux, C., Van Montagu, M., Engler, G., Inze, D., and Ferreira, P. (1995). Dominant negative mutants of the Cdc2 kinase uncouple cell division from iterative plant development. EMBO J. 14, 3925–3936. [DOI] [PMC free article] [PubMed] [Google Scholar]
- Laufs, P., Grandjean, O., Jonak, C., Kieu, K., and Traas, J. (1998). Cellular parameters of the shoot apical meristem in Arabidopsis. Plant Cell 10, 1375–1390. [DOI] [PMC free article] [PubMed] [Google Scholar]
- Long, J., and Barton, M.K. (2000). Initiation of axillary and floral meristems in Arabidopsis. Dev. Biol. 218, 341–353. [DOI] [PubMed] [Google Scholar]
- Long, J.A., and Barton, M.K. (1998). The development of apical embryonic pattern in Arabidopsis. Development 125, 3027–3035. [DOI] [PubMed] [Google Scholar]
- Long, J.A., Moan, E.I., Medford, J.I., and Barton, M.K. (1996). A member of the KNOTTED class of homeodomain proteins encoded by the STM gene of Arabidopsis. Nature 379, 66–69. [DOI] [PubMed] [Google Scholar]
- Lyndon, R.F. (1998). The Shoot Apical Meristem. (Cambridge, UK: Cambridge University Press).
- Mayer, K.F., Schoof, H., Haecker, A., Lenhard, M., Juergens, G., and Laux, T. (1998). Role of WUSCHEL in regulating stem cell fate in the Arabidopsis shoot meristem. Cell 95, 805–815. [DOI] [PubMed] [Google Scholar]
- Menges, M., Lars Hennig, L., Gruissem, W., and Murray, J. (2002). Cell cycle-regulated gene expression in Arabidopsis. J. Biol. Chem. 277, 41987–42002. [DOI] [PubMed] [Google Scholar]
- Mizukami, Y., and Fischer, R.L. (2000). Plant organ size control: AINTEGUMENTA regulates growth and cell numbers during organogenesis. Proc. Natl. Acad. Sci. USA 97, 942–947. [DOI] [PMC free article] [PubMed] [Google Scholar]
- Morejohn, L.C., Bureau, T.C., Molé Bajer, J., Molé Bajer, A.S., and Fosket, D. (1987). Oryzalin, a dinitroaniline herbicide, binds to plant tubulin and inhibits microtubule polymerization in vitro. Planta 172, 252–264. [DOI] [PubMed] [Google Scholar]
- Müller, H., Bracken, A., Vernell, R., Moroni, M.C., Christians, F., Grassilli, E., Prosperini, E., Vigo, E., Oliner, J., and Helin, K. (2001). E2Fs regulate the expression of genes involved in differentiation, development, proliferation, and apoptosis. Genes Dev. 15, 267–285. [DOI] [PMC free article] [PubMed] [Google Scholar]
- Okada, K., Ueda, J., Komaki, M.K., Bell, C.J., and Shimura, Y. (1991). Requirement of the auxin polar transport system in early stages of Arabidopsis floral bud formation. Plant Cell 3, 677–684. [DOI] [PMC free article] [PubMed] [Google Scholar]
- Parcy, F., Nilsson, O., Busch, M.A., Lee, I., and Weigel, D. (1998). A genetic framework for floral patterning. Nature 395, 561–566. [DOI] [PubMed] [Google Scholar]
- Ravid, K., Lu, J., Zimmet, J.M., and Jones, M.R. (2002). Roads to polyploidy: The megakaryocyte example. J. Cell. Physiol. 190, 7–20. [DOI] [PubMed] [Google Scholar]
- Riou-Khamlichi, C., Huntley, R., Jacqmard, A., and Murray, J. (1999). Cytokinin activation of Arabidopsis cell division through a D-type cyclin. Science 283, 1541–1544. [DOI] [PubMed] [Google Scholar]
- Sessions, A., Weigel, D., and Yanofsky, M.F. (1999). The Arabidopsis thaliana MERISTEM LAYER 1 promoter specifies epidermal expression in meristems and young primordia. Plant J. 20, 259–263. [DOI] [PubMed] [Google Scholar]
- Steeves, T.A., and Sussex, I.A. (1989). Patterns in Plant Development, 2nd ed. (Cambridge, UK: Cambridge University Press).
- Traas, J., Bellini, C., Nacry, P., Kronenberger, J., Bouchez, D., and Caboche, M. (1995). Normal differentiation patterns in plants lacking microtubular preprophase bands. Nature 375, 676–677. [Google Scholar]
- Traas, J., Hülskamp, M., Gendreau, E., and Höfte, H. (1998). Endoreduplication and development: Rule without dividing? Curr. Opin. Plant Biol. 1, 498–503. [DOI] [PubMed] [Google Scholar]
- Traas, J.A., and Doonan, J.D. (2001). Cellular basis of shoot apical meristem function. Int. Rev. Cytol. 208, 161–206. [DOI] [PubMed] [Google Scholar]
- van den Berg, C., Willemsen, V., Hage, W., Weisbeek, P., and Scheres, B. (1995). Cell fate in the Arabidopsis root meristem determined by directional signalling. Nature 378, 62.–65. [DOI] [PubMed] [Google Scholar]
- Wyrzykowska, J., and Fleming, A. (2003). Cell division pattern influences gene expression in the shoot apical meristem. Proc. Natl. Acad. Sci. USA 100, 5561–5566. [DOI] [PMC free article] [PubMed] [Google Scholar]
- Wyrzykowska, J., Pien, S., Shen, W.H., and Fleming, A. (2002). Manipulation of leaf shape by modulation of cell division. Development 129, 957–964. [DOI] [PubMed] [Google Scholar]
- Zhu, L., and Skoultchi, A. (2001). Coordinating cell proliferation and differentiation. Curr. Opin. Genet. Dev. 10, 91–97. [DOI] [PubMed] [Google Scholar]


