Abstract
The epithelial Na+ channel, ENaC, and the Cl−/HCO3− exchanger, pendrin, mediate NaCl absorption within the cortical collecting duct and the connecting tubule. Although pendrin and ENaC localize to different cell types, ENaC subunit abundance and activity are lower in aldosterone-treated pendrin-null mice relative to wild-type mice. Because pendrin mediates HCO3− secretion, we asked if increasing distal delivery of HCO3− through a pendrin-independent mechanism “rescues” ENaC function in pendrin-null mice. We gave aldosterone and NaHCO3 to increase pendrin-dependent HCO3− secretion within the connecting tubule and cortical collecting duct, or gave aldosterone and NaHCO3 plus acetazolamide to increase luminal HCO3− concentration, [HCO3−], independent of pendrin. Following treatment with aldosterone and NaHCO3, pendrin-null mice had lower urinary pH and [HCO3−] as well as lower renal ENaC abundance and function than wild-type mice. With the addition of acetazolamide, however, acid-base balance as well as ENaC subunit abundance and function was similar in pendrin-null and wild-type mice. We explored whether [HCO3−] directly alters ENaC abundance and function in cultured mouse principal cells (mpkCCD). Amiloride-sensitive current and ENaC abundance rose with increased [HCO3−] on the apical or the basolateral side, independent of the substituting anion. However, ENaC was more sensitive to changes in [HCO3−] on the basolateral side of the monolayer. Moreover, increasing [HCO3−] on the apical and basolateral side of Xenopus kidney cells increased both ENaC channel density and channel activity. We conclude that pendrin modulates ENaC abundance and function, at least in part by increasing luminal [HCO3−] and/or pH.
Pendrin, encoded by Slc26a4, is an aldosterone-sensitive Cl−/HCO3− exchanger that mediates Cl− absorption and HCO3− secretion in the cortical collecting duct (CCD).1–3 During NaCl restriction, pendrin-null mice excrete more NaCl than wild-type mice, which increases apparent vascular volume contraction and lowers BP.3–5 The chloruresis observed in pendrin-null mice during NaCl restriction likely results from the absence of pendrin-mediated Cl− absorption.3,4 However, because pendrin does not transport Na+, the cause of the natriuresis observed in the mutant mice was explored further. After either dietary NaCl restriction or the administration of aldosterone, renal ENaC function and ENaC subunit abundance were lower in pendrin-null mice than in wild-type mice.5 In particular, γ ENaC abundance was reduced in kidneys from pendrin-null mice relative to wild-type mice. However, how pendrin modulates ENaC expression and function in kidney remains unexplained.
Although ENaC and pendrin are both expressed in the aldosterone-sensitive region of the kidney, that is, the late distal convoluted tubule (DCT), the connecting tubule (CNT), and the CCD,1,6,7 they localize to different cell types. Whereas ENaC is expressed in the apical regions of principal cells,8 pendrin is expressed in the apical regions of type B and non-A, non-B intercalated cells.1,6 Because principal and intercalated cells do not communicate through gap junctions,9 pendrin cannot alter ENaC activity through a direct protein-protein interaction. However, pendrin might modulate ENaC abundance and function through a paracrine effect or by changing downstream luminal fluid composition.
ENaC is assembled from homologous gene products encoding the α, β, and γ subunits. Full channel activity also requires proteolytic cleavage of the α and γ subunits.10 Because β and γ ENaC subunit abundance is upregulated in models of metabolic alkalosis and downregulated in models of metabolic acidosis,11 and because ENaC activity has been reported to be pH dependent,12,13 ENaC expression and function might vary with changes in luminal and/or intracellular pH or HCO3− concentration.* Because pendrin mediates HCO3− secretion in the CCD,1 we hypothesized that pendrin regulates ENaC, at least in part, through changes in luminal pH and/or HCO3− concentration.
Luminal HCO3− concentration within the CNT and the collecting duct depends on delivery of HCO3− from upstream renal segments and from HCO3− secreted within these segments through transporters such as pendrin. Because pendrin is upregulated with administration of either aldosterone2 or NaHCO3,4,15 we treated mice with aldosterone or aldosterone and NaHCO3 to increase luminal HCO3− through pendrin-dependent HCO3− secretion. In other experiments, we treated mice with aldosterone and NaHCO3 plus acetazolamide to increase luminal HCO3− through a pendrin-independent mechanism. Acetazolamide was used because it increases distal HCO3− delivery by inhibiting HCO3− absorption in the proximal tubule, while inhibiting B cell apical Cl−/ HCO3− exchange.16 Moreover, we used cultured mouse principal cells (mpkCCD) and cultured Xenopus kidney cells (A6) to determine if there is a direct effect of HCO3− on ENaC function and abundance.
The purpose of this study was threefold: (1) to determine if increasing distal delivery of HCO3− rescues pendrin-null mice from the expected reduction in ENaC abundance and function, (2) to determine if luminal HCO3− directly stimulates ENaC abundance and function in a cell culture model of mouse principal cells, and (3) to determine the mechanism by which this occurs.
RESULTS
Verification of Treatment Models
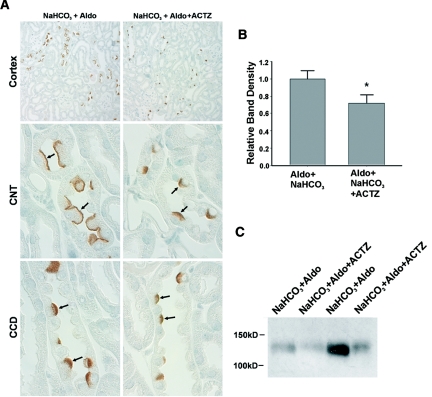
Because ablation of the gene encoding carbonic anhydrase II reduces renal pendrin abundance,17 we examined the abundance and the subcellular distribution of pendrin in kidneys from mice given NaHCO3 plus aldosterone or NaHCO3 plus aldosterone and the carbonic anhydrase inhibitor, acetazolamide (Figure 1). As shown, pendrin labeling was more prominent in the region of the apical plasma membrane in mice given aldosterone plus NaHCO3, relative to mice given NaHCO3−, aldosterone, and acetazolamide. Further studies quantified pendrin abundance by immunoblot in kidney lysates from mice in each treatment group. As shown, inhibiting carbonic anhydrase reduced pendrin total protein abundance (Figure 1, B and C).17 Therefore, because carbonic anhydrase inhibition reduces pendrin abundance and reduces B cell apical Cl−/HCO3− exchange,16 the bicarbonaturia observed following acetazolamide treatment does not occur through stimulation of pendrin-mediated HCO3− secretion. As such, further experiments used acetazolamide to increase luminal HCO3− concentration in the distal nephron independent of pendrin-mediated HCO3− secretion.
Figure 1.
Acetazolamide reduces pendrin expression in mouse cortex. For 7 days mice were given a NaCl-replete diet with NaHCO3 added to the diet plus an aldosterone infusion (treatment 2). Other mice received this treatment plus acetazolamide (treatment 3). (A) Pendrin labeling in sections of kidney cortex from mice in each group. As shown, pendrin immunolabel was more intense and more discrete in the region of the apical plasma membrane in sections from mice that received aldosterone and NaHCO3 versus sections from mice given NaHCO3, aldosterone, and acetazolamide. (B) Pendrin band density as detected by immunoblot of kidney lysates from mice that received aldosterone and NaHCO3 (n = 12) versus mice that received aldosterone, NaHCO3, and acetazolamide (n = 11). A representative gel is shown on the bottom right panel (C).
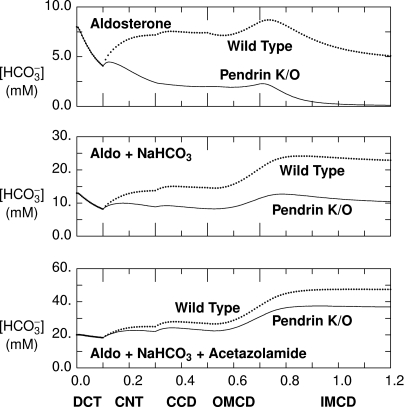
To estimate the effect of these treatment protocols on luminal HCO3− concentration, [HCO3−], within the CNT and CCD in vivo, we used a mathematical model of the distal nephron,18 formulated for the aldosterone-stimulated rat kidney.† Model parameters and baseline conditions have been published previously.18 To represent conditions in aldosterone-treated pendrin-null animals, apical plasma membrane Cl−/HCO3− exchanger density in type B cells within the CNT and CCD was reduced by 99%. The predicted HCO3− concentration profiles along the distal nephron from aldosterone-treated animals are shown in the top panel of Figure 2. The model predicts luminal [HCO3−] at the end of the CNT to be 7.2 mM in aldosterone-treated wild-type mice and 2.4 mM in aldosterone-treated pendrin-null mice (CNT pH = 5.78 and 5.49, respectively). After aldosterone and NaHCO3, luminal [HCO3−] is predicted to be 13.7 and 8.8 mM in the wild-type and mutant mice, respectively (CNT pH = 5.98 and 5.86). When acetazolamide is added to the treatment regimen, luminal [HCO3−] of 24.9 and 22.0 mM are predicted in the wild-type and mutant mice (CNT pH = 6.15 and 6.12). Thus, the model predicts luminal [HCO3−] and pH at the end of the CNT to be lower in pendrin-null relative to wild-type mice after treatment with aldosterone alone or aldosterone plus NaHCO3, but predicts [HCO3−] to be similar in the mutant and wild-type mice after treatment with aldosterone, NaHCO3, and acetazolamide administration.
Figure 2.
Acetazolamide treatment reduces the predicted differences (between pendrin-null and wild-type mice) in luminal HCO3− concentrations. With use of a mathematical model18 of aldosterone-stimulated rat distal nephron, concentrations and flows for key solutes were determined in simulations of treatment with aldosterone alone and aldosterone plus NaHCO3 and after administration of aldosterone plus acetazolamide and NaHCO3. Each panel represents the predicted luminal HCO3− concentration as a function of the distance (in cm) downstream of the DCT. Dotted curves were computed using baseline (wild-type) parameters, and solid curves were obtained by setting the density of luminal cell membrane Cl−/HCO3− exchange to 1% of baseline in type B intercalated cells of CNT and CCD (pendrin null). OMCD, outer medullary collecting duct; IMCD, inner medullary collecting duct.
To test the model predictions, urinary and arterial HCO3− concentration and pH were examined in wild-type and pendrin-null mice in each of these treatment models. After treatment with aldosterone alone or aldosterone and NaHCO3 (Table 1), urinary pH was lower, whereas arterial pH and HCO3− concentration were higher in pendrin-null mild relative to wild-type mice, similar to previous observations2–4,19 that pendrin-null mice have a reduced ability to excrete OH− equivalents. When aldosterone and NaHCO3-treated mice were also given acetazolamide, urinary pH and urinary HCO3− concentration rose markedly in the mutant mice, such that urinary and arterial pH and HCO3− concentrations were similar in the wild-type and pendrin-null mice. We conclude that increasing distal delivery of HCO3− from upstream segments eliminates the differences in urinary pH and HCO3− concentration observed in wild-type and pendrin-null mice.
Table 1.
Effect of increased distal delivery of HCO3− in wild-type and pendrin-null mice receiving a NaCl-replete diet and aldosterone
| Aldosterone |
Aldosterone + NaHCO3 |
Aldosterone + NaHCO3 + Acetazolamide |
||||
|---|---|---|---|---|---|---|
| Wild Type | Pendrin Null | Wild Type | Pendrin Null | Wild Type | Pendrin Null | |
| Arterial blood | ||||||
| pH | 7.43 ± 0.02 (n = 11) | 7.54 ± 0.02c (n = 11) | 7.49 ± 0.02 (n = 8) | 7.57 ± 0.02c (n = 8) | 7.38 ± 0.02 (n = 10) | 7.39 ± 0.02 (n = 11) |
| pCO2 | 48 ± 1 | 45 ± 1 | 45 ± 1 | 46 ± 2 | 45 ± 1 | 47 ± 1 |
| cHCO3− | 31 ± 1 | 38 ± 1c | 34 ± 1 | 42 ± 1c | 26 ± 1 | 27 ± 1 |
| Urine | ||||||
| pHa | 6.60 ± 0.06 (n = 9) | 6.34 ± 0.17 (n = 9) | 6.9 ± 0.13 (n = 8) | 6.44 ± 0.19 (n = 8) | 7.45 ± 0.16 (n = 8) | 7.64 ± 0.12 (n = 7) |
| pHb | 6.59 ± 0.10 (n = 8) | 6.21 ± 0.15 (n = 11) | 6.84 ± 0.14 (n = 8) | 6.34 ± 0.19 (n = 8)d | 7.28 ± 0.14 (n = 8) | 7.64 ± 0.12 (n = 7) |
| pCO2 | 54 ± 4 | 64 ± 7 | 62 ± 4 | 61 ± 5 | 67 ± 5 | 65 ± 6 |
| cHCO3− | 6 ± 1 | 4 ± 1 | 14 ± 3 | 6 ± 2c | 48 ± 16 | 60 ± 13 |
All mice received a NaCl-replete diet (0.8 meq/day NaCl) and aldosterone by minipump (250 ng/kg body wt per day). Some of these mice also received 7 days of NaHCO3 added to the food or NaHCO3 and acetazolamide by minipump (30 mg/kg body wt per day). cHCO3−, calculated HCO3− concentration. Values displayed are the mean ± SEM.
apH measured by microelectrode (Microelectrodes, Londonderry, NH).
bpH measured by ABL5 (Radiometer America).
cP < 0.05.
dP = 0.052.
Increased Distal Delivery of HCO3− Increases ENaC Function
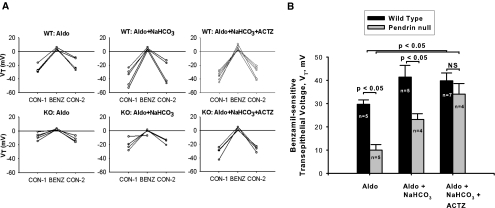
We hypothesized that increasing distal HCO3− delivery through a mechanism independent of pendrin will eliminate differences between wild-type and pendrin-null mice in ENaC abundance and function. To assess ENaC-mediated transport, the benzamil-sensitive component of transepithelial voltage, Vt, was compared in wild-type and pendrin-null mice after aldosterone treatment alone, with aldosterone plus NaHCO3, or with aldosterone plus NaHCO3 and acetazolamide (Figure 3). After treatment with aldosterone alone or aldosterone and NaHCO3, benzamil-sensitive Vt was lower in pendrin-null mice than in wild-type mice, similar to previous observations.5 However, when carbonic anhydrase inhibitors were added to the treatment protocol, Vt increased significantly in CCDs from pendrin-null mice. Therefore, with the addition of acetazolamide, amiloride-sensitive Vt was similar in CCDs from wild-type and mutant mice. We conclude that acetazolamide increases ENaC function in pendrin-null mice, possibly through increased distal delivery of HCO3−.
Figure 3.
Acetazolamide treatment restores ENaC activity in CCDs from pendrin-null mice. Panel A shows the effect of benzamil on transepithelial voltage, Vt, in individual tubules from mice given aldosterone alone, aldosterone plus NaHCO3, or aldosterone plus NaHCO3 plus acetazolamide. Each tubule studied was obtained from a separate mouse. Panel B shows the difference in Vt measured in the presence (BENZ) and absence (CON-1) of benzamil. Values were compared between pendrin-null and wild-type mice after each treatment protocol using ANOVA.
Tubule diameter (OD-ID) was smaller in CCDs from mutant mice relative to wild-type mice after treatment with aldosterone alone or after aldosterone and NaHCO3 (Supplemental Figure 1). Tubule diameter increased after the addition of NaHCO3 or NaHCO3 and acetazolamide to the treatment protocol in both wild-type and pendrin-null mice. However, after the addition of acetazolamide, tubule diameter was similar in CCDs from the mutant and the wild-type mice.
Increased Distal Delivery of HCO3− Increases ENaC Subunit Abundance
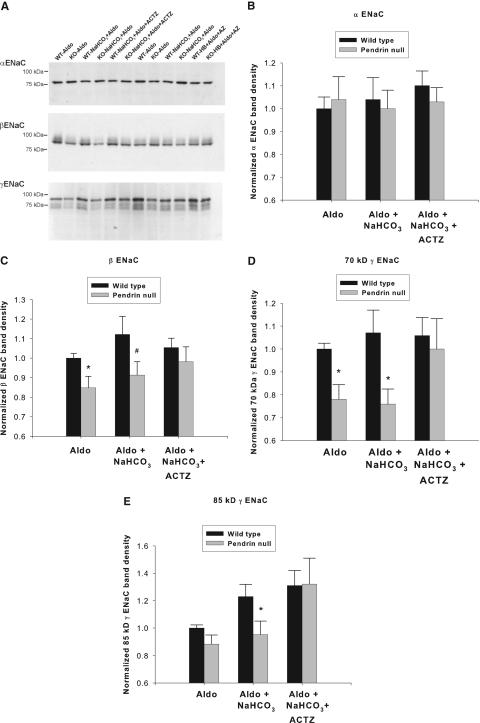
Further experiments explored the effect of increased distal HCO3− delivery on α, β, and γ ENaC abundance (Figure 4). Renal α ENaC subunit abundance was the same in wild-type and pendrin-null mice in all of the treatment conditions tested (Figure 4B).‡ After treatment with aldosterone or aldosterone and NaHCO3, abundance of the β and the 70- and 85-kD fragments of the γ ENaC subunit were lower in kidneys from pendrin-null mice than in wild-type mice (Figure 4, C and D), similar to previous observations by our laboratory.5 However, after the addition of acetazolamide to the treatment protocol, β and γ ENaC subunit abundance was similar in the mutant and wild-type mice (Figure 4, C and D). Therefore, whereas renal ENaC abundance was lower in mutant mice relative to wild-type mice after treatment with aldosterone alone or aldosterone and NaHCO3, ENaC abundance was similar after the addition of acetazolamide to the treatment protocol. Thus, increasing distal HCO3− delivery with acetazolamide eliminates the differences in ENaC subunit abundance observed in pendrin-null and wild-type mice.
Figure 4.
Acetazolamide treatment restores ENaC abundance in kidneys from pendrin-null mice. Pendrin-null and wild-type mice were treated as described in Figure 3. α, β, and γ ENaC abundance in whole kidney lysates was quantified by immunoblot from mice in each treatment group studied in parallel. The band density of each lane was normalized to the value obtained from aldosterone-treated wild-type mice run on the same blot. A representative immunoblot is shown (A). (B) α, (C) β, and (D) γ ENaC band density of kidney lysates taken from mice from each treatment group are shown. *P < 0.05, unpaired t test. #P = 0.083. Twelve or 13 animals were studied in each group.
Acetazolamide Treatment Reduces BP Differences between Pendrin-Null and Wild-Type Mice
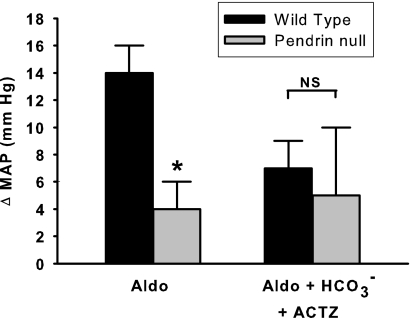
We observed previously that pendrin-null mice have lower BP than wild-type mice after the administration of aldosterone analogues. Thus, we asked if the BP differences observed in wild-type and pendrin-null mice are attenuated after acetazolamide treatment. Thus, BP was measured in wild-type and pendrin-null mice after administration of aldosterone alone or aldosterone plus NaHCO3 and acetazolamide (Figure 5). As shown, aldosterone increased BP more in wild-type mice than in pendrin-null mice, as expected.2 However, treatment with aldosterone plus NaHCO3 and acetazolamide produced a similar increment in BP in the wild-type and mutant mice.
Figure 5.
With acetazolamide treatment, aldosterone administration produces a similar change in blood pressure in wild-type and in pendrin-null mice. Changes in mean arterial pressure after treatment with aldosterone alone or aldosterone plus NaHCO3 and acetazolamide were measured in pendrin-null and wild-type mice. After aldosterone treatment, mean arterial BP increased from 116 ± 2 to 130 ± 3 mmHg (n = 9) in wild-type mice, but increased from 111 ± 2 to only 116 ± 2 in pendrin-null mice (n = 8). In contrast, after aldosterone, NaHCO3, and acetazolamide treatment, mean arterial BP increased from 120 ± 3 to 127 ± 3 mmHg (n = 7) in wild-type mice and increased from 112 ± 4 to 117 ± 1 in pendrin-null mice (n = 5). Thus, aldosterone treatment produced a greater rise in BP in wild-type mice relative to pendrin-null mice. However, when NaHCO3 and acetazolamide were added to the treatment protocol, the increment in BP was similar.
ENaC Function and Abundance Increase with Increased HCO3− Concentration on the Apical or the Basolateral Side of Principal Cell Monolayers
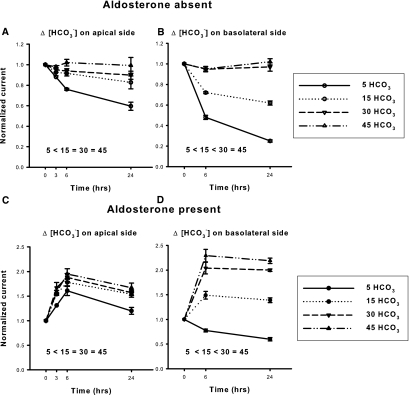
To determine if HCO3− has a direct effect on ENaC, we examined ENaC function and abundance when HCO3− concentration was varied on the apical or the basolateral side of principal cell monolayers (mpkCCD). Thus, HCO3− concentration was varied between 5 and 45 mM, by substituting HCO3− for Cl− in equal concentration on either the apical or the basolateral side of the cell (Figure 6). Raising HCO3− concentration on either side of the monolayer increased the total current over at least 24 hours. Although aldosterone administration increased current, HCO3− concentration modulated amiloride-sensitive current both in the presence and the absence of this steroid hormone. Thus, [HCO3−] changes amiloride-sensitive current independent of aldosterone. Current was more sensitive, however, to changes in HCO3− concentration at lower HCO3− concentrations. Increasing HCO3− concentration on the apical side from 5 to 15 mM produced a much larger increment in current than was observed when HCO3− was raised either from 15 to 30 mM or from 30 to 45 mM. Similarly, raising HCO3− concentration on the basolateral side of the cell produced a greater increment in current at lower HCO3− concentrations. Because HCO3−-induced differences in current appeared greatest after 24 hours, further experiments in aldosterone-free media explored the effect of extracellular HCO3− on ENaC abundance and function when HCO3− concentration was varied over 1 day.
Figure 6.
Raising [HCO3−] increases amiloride-sensitive current in mouse principal cells in culture in a time-dependent fashion. mpkCCD cells were cultured in fully defined media for 24 hours before study. HCO3− concentration was then varied on the apical side of the cell by substitution with Cl−, whereas bath HCO3− concentration was kept constant at 30 mM, in the presence (A, n = 3 to 5 for each condition) or absence (C, n = 3 to 5) of aldosterone (10−6 M). Total current was measured at baseline and then after 3, 6, and 24 hours of exposure to media with the indicated HCO3− concentration. Total current at each of these time points was normalized to total current measured at baseline, or at time zero. Total current was lower in cells exposed to 5 mM HCO3− for 24 hours relative to current measured in cells exposed to 15, 30, or 45 mM HCO3− over the same time period either in the presence or in the absence of aldosterone (P < 0.05, ANOVA). However, current did not differ when [HCO3−] on the apical side of the monolayer was 15, 30, or 45 mM. (B and D) Same experiment, but where HCO3− was varied on the basolateral side, while apical HCO3− concentration was kept constant at 30 mM (n = 3 to 6 for each condition). As shown, total current rose in a time-dependent fashion when HCO3− concentration was increased. Statistically significant differences in total current were observed at 24 hours when HCO3− was 5, 15, or 30 mM. However, current was not statistically different when [HCO3−] on the basolateral side was 30 or 45 mM.
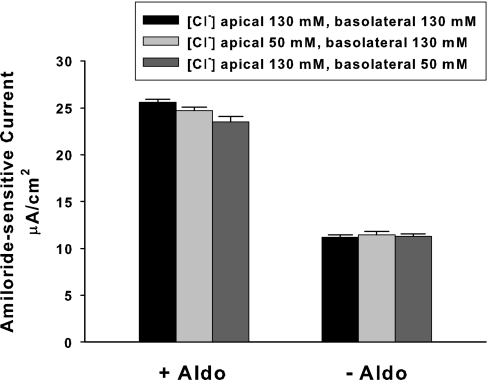
Because ENaC function is regulated by extracellular Cl− concentration in vitro,20 further studies explored the effect of extracellular Cl− concentration on ENaC function when extracellular Na+ and HCO3− concentrations were held constant (Figure 7). As shown, varying Cl− concentration between 50 and 130 mM on either the apical or the basolateral side of the cell produced little change in amiloride-sensitive current. Thus, HCO3−-induced changes in ENaC function cannot be explained by a reciprocal change in Cl− concentration.
Figure 7.
Extracellular Cl− concentration does not modulate amiloride-sensitive current. Cl− concentration, [Cl−], was varied on the apical side (n = 3) or the basolateral side (n = 3) of mpkCCD monolayers over 6 hours, by substituting Cl− for gluconate, while keeping Na+ and HCO3− concentrations constant on both sides of the cell ([Na+] = 160 mM; [HCO3−], 30 mM).
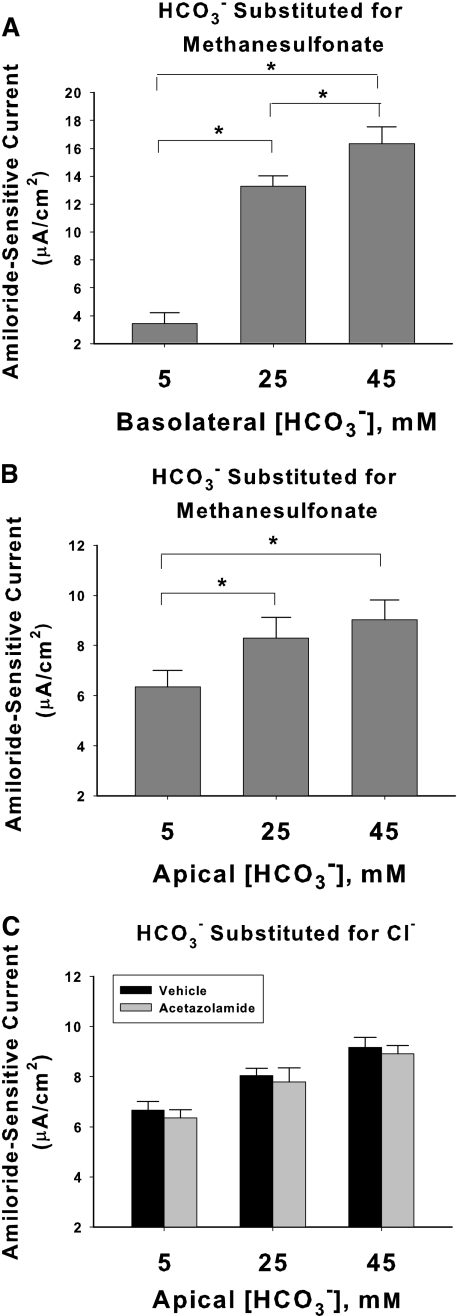
The effect of HCO3− on amiloride-sensitive current was studied further when HCO3− concentration was varied on the apical or the basolateral side of the cell, while Cl− concentration was held constant, through equimolar substitution of HCO3− with methanesulfonate (Figure 8). Transepithelial voltage, Vt, resistance, and pH on the apical and basolateral side of the monolayer, measured under each of these conditions, are given in the Supplemental Text, Table S1. Figure 8, A and B, show that when HCO3− concentration on the apical side is increased from 5 to 45 mM, amiloride-sensitive current rose 42%. When HCO3− on the apical side is increased from 2 to 45 mM, which should reflect the physiologic range of luminal HCO3− concentration in the CCD in vivo,21,22 amiloride-sensitive current rose 50% (7.17 ± 0.71 versus 10.76 ± 0.92 mA/cm2, n = 3, in each group, P < 0.05). However, current was more sensitive to changes in [HCO3−] when varied on the basolateral than on the apical side of the cell (Figure 8A). When HCO3− concentration was increased from 5 to 45 mM on the basolateral side of the cell, amiloride-sensitive current rose more than fivefold.
Figure 8.
Increasing HCO3− concentration increases amiloride-sensitive current. [HCO3−] was varied on the basolateral side (A, n = 4 for each condition) or on the apical side (B, n = 7 for each condition) of mpkCCD monolayers over 24 hours, by substituting HCO3− for methanesulfonate, whereas Na+ and Cl− concentrations were held constant on both sides of the cell ([Na+] = 165 mM; [Cl−], 120 mM). (C) Effect of varying apical HCO3− concentration by substitution with Cl−. At each HCO3− concentration tested, current was unchanged with acetazolamide (200 μM) present on both sides of the cell. P < 0.05, ANOVA.
Acetazolamide was used in vivo to increase luminal HCO3− concentration in the distal tubule. However, acetazolamide might increase amiloride-sensitive Vt in mouse CCD and CNT from a different effect of the drug, such as by increasing principal cell pHi independent of changes in extracellular pH or HCO3− concentration. Thus, we explored the effect of acetazolamide on amiloride-sensitive current when extracellular pH and HCO3− concentration were held constant (Figure 8C). As shown, at each luminal HCO3− concentration tested, amiloride-sensitive current was similar in the presence and absence of acetazolamide (200 μM). Thus, we could not demonstrate an effect of acetazolamide on ENaC-mediated current independent of its predicted effect in vivo to increase luminal HCO3− concentration in the distal nephron.
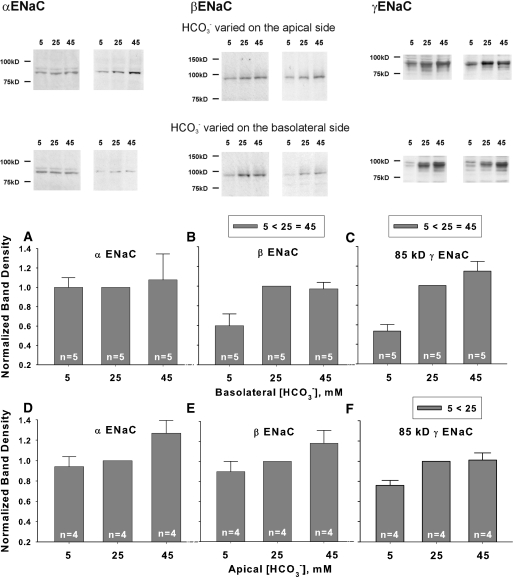
We next examined the effect of HCO3− concentration on ENaC subunit abundance in mpkCCD cells, when studied under the conditions used in Figure 8. As shown (Figure 9), changing HCO3− concentration on the apical or basolateral side of the cell through substitution with methanesulfonate did not alter α ENaC subunit abundance (Figure 9, A and D). β subunit abundance rose with increased HCO3− concentration on the basolateral side of the cell, although changes did not reach statistical significance when varied on the apical side (Figure 9, B and E). However, the abundance of the 85-kD fragment of γ ENaC rose when HCO3− was increased on either the apical or the basolateral side of the cell (Figure 9, C and F). The density of the 70-kD γ ENaC fragment was very low under the conditions tested.
Figure 9.
Raising HCO3− concentration on the apical or the basolateral side of mpkCCD monolayers increases ENaC subunit abundance. α, β, and γ ENaC subunit abundance was quantified by immunoblot when HCO3− concentration was varied on the apical or the basolateral side of mpkCCD monolayers by substituting HCO3− for methanesulfonate in equal concentrations. Band densities are shown in the lower panels. The upper panels display representative gels. *P < 0.05, ANOVA.
ENaC Activity and Channel Density Rise with Increased Extracellular HCO3− Concentration
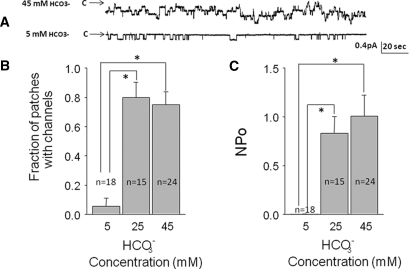
To determine the effect of HCO3− on ENaC activity, we applied patch-clamp recordings to aldosterone-treated Xenopus kidney cells (A6) exposed to 5, 25, or 45 mM HCO3− on the apical and basolateral surface of the cells for 24 hours through equimolar substitution with methanesulfonate (Figure 10). Raising [HCO3−] increased channel activity (NPo, measured as the product of open probability and channel density), although HCO3− had a greater effect when increased from 5 to 25 mM than when raised from 25 to 45 mM. Raising [HCO3−] also increased the number of channels per unit area of membrane, although determining the exact number of channels in a patch is confounded by the large decrease in the open probability.23 Nevertheless, the increase in channel activity cannot be explained by increased channel density alone. Therefore, raising [HCO3−] appears to increase both open probability and channel density, consistent with the increase in transepithelial current in the mpkCCD cells observed with similar changes in [HCO3−].
Figure 10.
Increasing extracellular HCO3− concentration increases single ENaC channel activity and channel density in A6 cells. (A) Effect of varying HCO3− on ENaC in cell-attached patches in A6 cells treated for 24 hours with 10−6 M aldosterone when HCO3− was varied on the apical and the basolateral side of the cell through substitution with methanesulfonate. (B) Effect on channel density measured as the fraction of patches with measurable channel activity. (C) Channel activity for all patches (NPo) determined by the product of channels times the open probability.
DISCUSSION
Absorption of Na+ by ENaC is critical to renal BP regulation.24,25 In response to diuretics such as furosemide, BP is maintained, in part, by upregulating distal NaCl transporters such as ENaC and pendrin. In the absence of pendrin, (i.e., pendrin knockout mice) furosemide administration leads to an enhanced decline in BP.9 However, after treatment with other diuretics, such as acetazolamide, BP is maintained independent of pendrin, possibly by stimulating distal HCO3− delivery from upstream segments, which stimulates ENaC abundance and function.
In cultured principal cells, we observed that changes in [HCO3−] directly alter ENaC function. Therefore, the increase in ENaC function observed after increases in distal HCO3− delivery in vivo cannot be explained fully by indirect effects of the treatment models used, such as changes in flow rate. Raising HCO3− concentration on the apical or the basolateral side of cultured cell monolayers increased ENaC activity through increased β and 85-kD γ ENaC subunit abundance, consistent with previous in vivo studies demonstrating increased abundance of the β and the 85-kD fragment of γ ENaC subunit during metabolic alkalosis and reduced abundance during metabolic acidosis.11§ Moreover, raising extracellular [HCO3−] increased ENaC channel density and channel activity. Whether HCO3− modulates channel density through ENaC subcellular redistribution remains to be determined.
In contrast to this study, other studies observed that Na+ absorption in the CCD is unaffected by luminal pH or HCO3− concentration. In rabbit CCDs perfused in vitro26 transepithelial Na+ flux was unaffected by changes in luminal pH. Similarly, Na+ absorption in the superficial distal tubule was unchanged after a 1-hour infusion of NaHCO3.27 Differences between these studies might be explained by the contrasting time frame over which epithelia were exposed to changes in luminal HCO3− concentration (or pH). On the basis of our observations, little change in ENaC subunit abundance and ENaC function would be expected over the short time frame used (<1 hour) in these previous in vitro experiments.
ENaC abundance and function are sensitive to changes in HCO3− concentration on both the basolateral and the apical side of the cell. Thus, HCO3−-sensitive changes in ENaC abundance and function most likely occur through an intracellular signaling event rather than through a direct interaction of the extracellular domain of the protein with the luminal fluid.
Although amiloride-sensitive transepithelial current is more sensitive to changes in HCO3− concentration on the basolateral than the apical side of the cell, changes in luminal HCO3− concentration may be the more important physiologically. HCO3− concentration in the luminal fluid of the distal tubule in vivo varies between 2 and 40 mM,21,22 whereas arterial HCO3− concentration, which is similar to cortical interstitial HCO3− concentration,28 changes by <5 mM in these treatment models.29–31 Thus, ENaC abundance and function in vivo may be regulated more by changes in luminal HCO3− than by changes in interstitial concentration because luminal HCO3− varies over a much greater range than does cortical interstititial HCO3− concentration.
We observed that ENaC abundance and function are much more sensitive to changes in luminal HCO3− at lower HCO3− concentrations. Although raising luminal HCO3− from 5 to 15 mM stimulates ENaC abundance and function in mpkCCD cells in culture, additional increases in luminal HCO3− did not produce a large additional increment in ENaC abundance or function. These data suggest that increasing luminal [HCO3−] stimulates ENaC abundance and function until a concentration of approximately 15 mM is reached, after which little additional channel activity is observed. If so, these data provide a possible explanation for why the addition of NaHCO3 and acetazolamide increased ENaC function less in aldosterone-treated wild-type mice than in aldosterone-treated pendrin-null mice. In aldosterone-treated wild-type mice we observed increased ENaC function (amiloride-sensitive Vt) with the addition of NaHCO3 to the food, which should increase end-CNT luminal [HCO3−] from 7.5 to 13.7 mM. However, with the addition of acetazolamide to the treatment regimen, ENaC function did not increase further, although end-CNT luminal [HCO3−] was predicted to rise from 13.7 to 24.9 mM. Thus, our failure to detect an increased ENaC function in wild-type mice given aldosterone, NaHCO3−, and acetazolamide versus mice given aldosterone and NaHCO3 alone might occur because luminal HCO3− is near or above this 15 mM HCO3− threshold in both of these treatment models. In pendrin-null mice, however, the predicted luminal [HCO3−] at the end of the CNT is well below this threshold after treatment with aldosterone alone (2.4 mM) or aldosterone and NaHCO3 (8.8 mM), but exceeds this level with acetazolamide administration (22 mM). Therefore, based on the end-CNT HCO3− concentrations predicted, bigger differences in ENaC function are expected after each of these treatment models in pendrin-null relative to wild-type mice. However, other potential explanations are possible.
HCO3− may modulate ENaC abundance and function through changes in pH rather than through a direct effect of HCO3−. Collier and Snyder observed that in the nominal absence of HCO3, reducing pH acutely from 8.5 to 6.5 lowers ENaC current by approximately 30% to 40%,20 which suggests that pH modulates ENaC activity independent of HCO3−. Moreover, in excised, cell-free patches from the apical membrane of rat cortical collecting duct principal cells, Palmer and Frindt12 showed that ENaC channel activity was strongly reduced when cytosolic pH was reduced from 7.4 to 6.4 in HCO3−-free solutions, consistent with a direct effect of H+ on channel open probability. Conversely, in mpkCCD cells Hallows et al.32 demonstrated that ENaC is regulated by HCO3−-dependent signaling pathways, such as the soluble adenylyl cyclase. Whether ENaC is regulated by HCO3− itself or by HCO3−-induced changes in pH remains to be determined. [HCO3−] may acutely alter open probability by changing cytosolic pH, whereas chronic changes in cellular [HCO3−] may directly alter channel density.
Although we found little change in ENaC-mediated current when extracellular Cl− concentration, [Cl−], was varied between 50 and 130 mM, other studies have demonstrated that changing extracellular [Cl−] modulates ENaC function when studied at lower extracellular Cl− concentrations. In heterologous expression systems and in airway epithelia (H441 cells), Collier and Snyder20 observed that ENaC function falls with acute increases in extracellular Cl− concentration in vitro, reaching maximal inhibition at a Cl− concentration of approximately 40 mM. This study examined ENaC function at higher Cl− concentrations (50 to 130 mM) because interstitial Cl− concentration should be >50 mM28 and because luminal Cl− concentration in the CNT and CCD is 40 to 88 mM during the treatment conditions used in our studies.18 Thus, the contrasting results observed between these studies20 might reflect differences in the Cl− concentration range used or differences in the time course over which these two studies were conducted.
We conclude that raising HCO3− concentration on the apical or basolateral side of the principal cells augments ENaC function by raising β and γ subunit abundance, apparent channel density, and channel activity. Thus, pendrin modulates ENaC, at least in part, by changing luminal [HCO3−]. Whether HCO3− interacts directly with ENaC or whether it modulates upstream signaling pathways that regulate ENaC activity and abundance remains to be determined.
From the perspective of overall renal tubular function, these observations demonstrate indirect communication between principal and intercalated cells. In the normal kidney, this is a mechanism whereby principal cells sense luminal Cl− concentration. When luminal Cl− is low, pendrin-mediated HCO3− secretion is attenuated. Thus, an acid lumen prevails, which blunts continued ENaC-mediated Na+ reabsorption. An inability to reduce ENaC function when distal Cl− delivery falls would result in pathologic K+ secretion and hypokalemia. This work argues that during metabolic alkalosis associated with bicarbonaturia, the increased luminal HCO3− concentration enhances distal K+ wasting, both by increasing luminal electronegativity due to the lower tight junction permeabilty of HCO3− relative to Cl−33,34 and also by increasing ENaC activity.
CONCISE METHODS
Animals and Animal Conditioning
Pendrin-null (Slc26a4−/−) mice developed by Everett et al.35 were bred in parallel with wild-type mice from the same strain (129 S6/SvEv Tac, Taconic Farms, Germantown, NY). Each three to four generations Slc26a4−/− and Slc26a4+/+ were crossed to generate heterozygotes, which were then bred to produce wild-type and pendrin-null litermates, which were then bred separately. Age- and sex-matched, pair-fed pendrin-null and wild-type mice underwent treatment protocols for 7days before sacrifice. Treatment 1: Mice were fed a balanced diet (#53881300, Zeigler Brothers, Gardeners, PA) prepared as a gel2 that was supplemented with NaCl to give the mice 0.8 meq/d NaCl. Mice also received aldosterone (250 μg/kg body wt per day) by continuous infusion through osmotic minipumps (Alzet, Palo Alto, CA). Treatment 2: Mice received aldosterone and the diet described in Treatment 1. In addition, they received 0.45 meq NaHCO3 daily, added to the gelled diet. Thus, mice received 1.25 meq/d Na+, 0.8 meq/d Cl−. Treatment 3: Aldosterone-treated mice ate the diet described in Treatment 2 (1.25 meq/d Na+, 0.8 meq/d Cl−). In addition, they received acetazolamide (30 mg/kg body wt per day) by continuous infusion through a minipump. In each of these treatment protocols, mice were sacrificed under anesthesia with 1% to 2% isofluorane in 100% O2 at 1 L/min. Kidneys were fixed in situ as described previously.6 The Institutional Animal Care and Use Committee at Emory University approved all animal treatment protocols.
Measurement of Arterial and Urinary pH and BP
Arterial blood was collected through the abdominal aorta under anesthesia with 1% to 2% isofluorane in 100% O2 and measured with an ABL5 (Radiometer America, Westlake, OH).
Mean arterial pressure was measured by telemetry as reported previously.5 Mice were anethesthetized with 1% to 2% isofluorane in 100% O2. With use of a sterile technique, the transducer catheter was inserted into the carotid near its bifurcation, advanced into the thoracic aorta, and then secured with sutres after placement was confirmed based on the expected landmarks and real-time BP waveforms. The transmitter battery was inserted into a subcutaneous pouch formed by blunt dissection in the right flank. Each treatment protocol was begun 7days after insertion of the catheter if both baseline BP and the diurnal variation in BP were stable. The BP values reported were measured after 7days of each treatment protocol. BP was measured using a Dataquest A.R.T. system (Transoma Medical) and sterile Data Sciences PA-C10 BP transducers.
Immunoblot Analysis
Pendrin labeling was detected using the rabbit anti-human antibody described previously.1 Semiquantitative immunoblots of kidney lysates were performed as reported previously36 and probed with polyclonal rabbit, anti-rat α, β, and γ ENaC antibodies,8,37 which were kindly provided by Dr. Mark A. Knepper. In some experiments we used a rabbit anti-α ENaC antibody that was raised against the analogous mouse epitope.38 Equal protein loading was confirmed by running a gel in parallel stained with Coomassie blue dye, as reported previously.39 Band density was quantified using Quantity One Image software (Biorad, Hercules, CA). The relative band densities of lysates from each treatment group were quantified and normalized to the mean band density of lysates from wild-type mice given the NaCl-replete diet and aldosterone, which were prepared and run in parallel on the same gel. In mpkCCD cells band density was normalized to the band density of lysates from cells treated and collected in parallel and run on the same gel.
In Vitro Perfusion of Isolated CCDs and Measurement of Transepithelial Voltage (Vt)
CCDs were dissected from the medullary rays of mouse keys and perfused in vitro at flow rates between 2 and 3 nl/min per millimeter in the presence of the symmetric, HCO3−/CO2-buffered physiologic solutions described previously.9 Transepithelial voltage was measured in CCDs perfused in vitro from mice from each treatment model. The perfusion pipette was connected to a high-impedance electrometer through an agar bridge saturated with 0.16 M NaCl and a calomel cell, as described previously.9,40
Measurement of Transepithelial Current in mpkCCD Cells in Culture
mpkCCD cells, an immortal cell line derived from transgenic mice containing a 2.7-kD fragment of the SV40 early region, were maintained in culture as described by Bens et al.41 Cells were grown on permeable supports (6-well, 4-μm pore size Transwell polycarbonate membranes; Costar, Cambridge, MA) to confluency at passages 28 to 33 in media containing DMEM/ Hams F12 with 2% fetal bovine serum and standard cell culture hormones. The full composition of this media (media #1) as well as the composition of the media used in each cell culture experiment is given in the Supplemental Text, Table S2. All cells were maintained in medium at 37°C, 5% CO2. After monolayers exhibited high transepithelial resistance, the media were aspirated and the cells were washed twice with phosphate-buffered saline. Fully defined media, without FBS or hormones, was then applied to both sides of the monolayer. After 48 hours of incubation in hormone-free media, the experiment was begun. Cells were then treated with aldosterone (10−6 M) or vehicle applied to solutions on the apical and the basolateral side of the monolayer. HCO3− concentration in the basolateral or apical side of the transwell was varied between 2 and 45 mM, by replacing HCO3− with an equal concentration of Cl−, gluconate, or methanesulfonate, while keeping Na+ concentration constant (see Supplemental Text, Table S2). In other experiments Cl− was replaced with gluconate in equal concentrations, whereas HCO3− was held constant.
Cell monolayer transepithelial voltage (VTE) and resistance (RTE) were measured using an epithelial volt-ohm meter equipped with stick electrodes (World Precision Instruments, Sarasota, FL). The equivalent transepithelial current (ITE) was calculated according to Ohm's law (ITE = VTE/RTE) and then corrected for the Transwell insert surface area.
After current measurements were completed, cells from each treatment condition, not exposed to amiloride, were scraped from the monolayer and processed for immunoblot analysis as described previously.36
Single-Channel Recordings in A6 Cells
The cell-attached configuration was used in all patch clamp studies. Micropipettes were pulled from filamented borosilicate glass capillaries (TW-150F; World Precision Instruments) with a two-stage vertical puller (Narishige, Tokyo, Japan). The resistances of the pipettes were between 7 and 10 MΩ when filled with and immersed in patch solution containing the following (in mM): 96 NaCl, 3.4 KCl, 0.8 MgCl2, 0.8 CaCl2, 10 HEPES, with pH adjusted to 7.4 by NaOH. Single-channel recordings were made from individual cells for approximately 8 to 10 minutes at pipette holding potentials of 0 or 20 mV. Channel currents were recorded at 1 kHz with an Axopatch 1-D amplifier (Molecular Devices Inc., Sunnyvale, CA) with a low-pass 100-Hz 8-pole Bessel filter. Channel activity per patch was determined during an 8- to 10-minute recording period. As a measure of epithelial sodium channel activity, NPo was determined using pCLAMP 10 software (Molecular Devices Inc.). The channel NPo can be calculated from the single-channel record without any assumptions about the total number of channels in a patch or the open probability of a single channel using the relationship
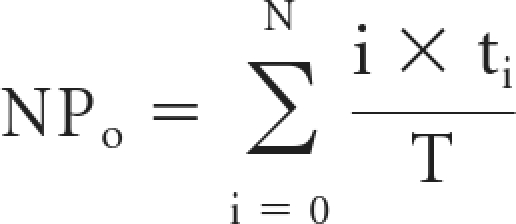 |
where T is the total recording time, i is the number of channels open, and ti is the time during the record when there were i channels open. The channel density per patch, N, presented in this paper, is defined as the maximum number of unitary current transitions during 8 to 10 minutes of single-channel recording and was calculated for all patches including those patches without any observable active channels. We have shown previously42 that when channels open independently, the open probability of a single channel (Po) can be calculated by dividing NPo by the number of channels in a patch. Po was calculated only for patches with active channels because we cannot determine if the complete absence of channel activity is due to the absence of channels or the presence of channels with zero open probability.
Statistical Analysis
When comparing two groups, an unpaired t test was used. When comparing three or more groups, ANOVA was used with a Holm-Sidak post test. P < 0.05 indicates statistical significance. Data are displayed as ±SEM.
DISCLOSURES
None.
Supplementary Material
Acknowledgments
This study was supported by DK-52935 (to S.M.W.), DK-PO1 061521, Emory University Research Center Grant 2009059 (to V.P.), DK-R37 27963 (to D.C.E.), and DK-29857 (to A.M.W.). We thank Dr. Robert Edinger for his helpful suggestions and Dr. Mark Knepper for the α, β, and γ ENaC antibodies.
Footnotes
Published online ahead of print. Publication date available at www.jasn.org.
* A natriuresis is observed during metabolic acidosis, despite increased circulating aldosterone concentration, because of the reduced expression of the thiazide-sensitive NaCl cotransporter, the NaPO4 cotransporter, and ENaC.11,14
† In aldosterone-treated wild-type animals, blood [HCO3−] was taken to be 25 mM and intrarenal pCO2 of 50 mmHg. [HCO3−] in the fluid entering the DCT was taken to be 8 mM. After treatment with aldosterone plus NaHCO3, the model assumes that [HCO3−] in the fluid entering the CNT to be 13 mM, and assumes HCO3− substitution for Cl−. Blood [HCO3−] is assumed to be 40 mM with an intrarenal pCO2 of 60 mmHg. Infusions of acetazolamide, and aldosterone with NaHCO3 added to the diet, produced alkaline urine with a normal serum HCO3− (Table 1) Accordingly, in the acetazolamide simulation, HCO3− concentration in the luminal fluid entering the DCT was assumed to be 20 mM, whereas blood HCO3− was 25 mM with an intrarenal pCO2 of 50 mmHg. In the published model, carbonic anhydrase activity was taken to be present within the 1 mm DCT. Those kinetic coefficients were therefore set to those of free solution to represent the effect of acetazolamide.
‡ Although our previous study detected a small reduction in α ENaC abundance in aldosterone-treated mutant mice, in this study differences between aldosterone-treated mutant and wild-type mice in renal α subunit abundance were not detected. The reason for this difference is not clear. Although this study and a previous study5 observed reduced abundance of the β and γ subunits of ENaC in kidneys from aldosterone-treated pendrin-null relative to aldosterone-treated mice wild-type mice, differences were slightly smaller in this study. Although the reason(s) for these discrepancies is/are not clear, they are likely related to differences in the dose-response relationship between changes in band density and protein loaded per lane.
§ Although our previous study detected a small reduction in α ENaC abundance in aldosterone-treated mutant mice, in this study differences between aldosterone-treated mutant and wild-type mice in renal α subunit abundance were not detected. The reason for this difference is not clear. Although this study and a previous study 5 observed reduced abundance of the β and γ subunits of ENaC in kidneys from aldosterone-treated pendrin-null relative to aldosterone-treated mice wild-type mice, differences were slightly smaller in this study. Although the reason(s) for these discrepancies is/are not clear, they are likely related to differences in the dose-response relationship between changes in band density and protein loaded per lane.
Supplemental information for this article is available online at http://www.jasn.org/.
REFERENCES
- 1. Royaux IE, Wall SM, Karniski LP, Everett LA, Suzuki K, Knepper MA, Green ED: Pendrin, encoded by the pendred syndrome gene, resides in the apical region of renal intercalated cells and mediates bicarbonate secretion. Proc Natl Acad Sci U S A 98: 4221–4226, 2001 [DOI] [PMC free article] [PubMed] [Google Scholar]
- 2. Verlander JW, Hassell KA, Royaux IE, Glapion DM, Wang M-E, Everett LA, Green ED, Wall SM: Deoxycorticosterone upregulates Pds (Slc26a4) in mouse kidney: Role of pendrin in mineralocorticoid-induced hypertension. Hypertension 42: 356–362, 2003 [DOI] [PubMed] [Google Scholar]
- 3. Wall SM, Kim Y-H, Stanley L, Glapion DM, Everett LA, Green ED, Verlander JW: NaCl restriction upregulates renal Slc26a4 through subcellular redistribution: Role in Cl- conservation. Hypertension 44: 1–6, 2004 [DOI] [PubMed] [Google Scholar]
- 4. Verlander JW, Kim Y-H, Shin WK, Pham TD, Hassell KA, Beierwaltes WH, Green ED, Everett LA, Matthews SW, Wall SM: Dietary Cl- restriction upregulates pendrin expression within the apical plasma membrane of type B intercalated cells. Am J Physiol 291: F833–F839, 2006 [DOI] [PubMed] [Google Scholar]
- 5. Kim Y-H, Pech V, Spencer KB, Beierwaltes WH, Everett LA, Green ED, Shin WK, Verlander JW, Sutliff RL, Wall SM: Reduced ENaC expression contributes to the lower blood pressure observed in pendrin null mice. Am J Physiol 293: F1314–F1324, 2007 [DOI] [PubMed] [Google Scholar]
- 6. Wall SM, Hassell KA, Royaux IE, Green ED, Chang JY, Shipley GL, Verlander JW: Localization of pendrin in mouse kidney. Am J Physiol 284: F229–F241, 2003 [DOI] [PubMed] [Google Scholar]
- 7. Kim Y-H, Kwon T-H, Frische S, Kim J, Tisher CC, Madsen KM, Nielsen S: Immunocytochemical localization of pendrin in intercalated cell subtypes in rat and mouse kidney. Am J Physiol 283: F744–F754, 2002 [DOI] [PubMed] [Google Scholar]
- 8. Masilamani S, Kim G-H, Mitchell C, Wade JB, Knepper MA: Aldosterone-mediated regulation of ENaC α,β and γ subunit proteins in rat kidney. J Clin Invest 104: R19–R23, 1999 [DOI] [PMC free article] [PubMed] [Google Scholar]
- 9. Pech V, Kim Y-H, Weinstein AM, Everett LA, Pham TD, Wall SM: Angiotensin II increases chloride absorption in the cortical collecting duct in mice through a pendrin-dependent mechanism. Am J Physiol 292: F914–F920, 2007 [DOI] [PubMed] [Google Scholar]
- 10. Snyder PM: Minireview: Regulation of epithelial Na+ channel trafficking. Endocrinology 146: 5079–5085, 2005 [DOI] [PubMed] [Google Scholar]
- 11. Kim G-H, Martin SW, Fernandez-Llama P, Masilamani S, Packer RK, Knepper MA: Long-term regulation of renal Na-dependent cotransporters and ENaC: Response to altered acid-base intake. Am J Physiol 279: F459–F467, 2000 [DOI] [PubMed] [Google Scholar]
- 12. Palmer LG, Frindt G: Effects of cell Ca and pH on Na channels from rat cortical collecting tubule. Am J Physiol 253: F333–F339, 1987 [DOI] [PubMed] [Google Scholar]
- 13. Shipway A, Danahay H, Williams JA, Tully DC, Backes BJ, Harris JL: Biochemical characterization of prostasin, a channel activating protease. Biochem Biophys Res Commun 324: 953–963, 2004 [DOI] [PubMed] [Google Scholar]
- 14. Faroqui S, Sheriff S, Amlal H: Metabolic acidosis has dual effects on sodium handling in rat kidney. Am J Physiol 291: F322–F331, 2006 [DOI] [PubMed] [Google Scholar]
- 15. Frische S, Kwon T-H, Frokiaer J, Madsen KM, Nielsen S: Regulated expression of pendrin in rat kidney in response to chronic NH4Cl or NaHCO3 loading. Am J Physiol 284: F584–F593, 2003 [DOI] [PubMed] [Google Scholar]
- 16. Milton AE, Weiner ID: Regulation of B-type intercalated cell apical anion exchange activity by CO2/HCO3−. Am J Physiol 274: F1086–F1094, 1998 [DOI] [PubMed] [Google Scholar]
- 17. Sun X, Soleimani M, Petrovic S: Decreased expression of Slc26a4 (pendrin) and Slc26a7 in the kidneys of carbonic anhydrase II-deficient mice. Cell Physiol Biochem 21: 95–108, 2008 [DOI] [PubMed] [Google Scholar]
- 18. Weinstein AM: A mathematical model of distal nephron acidification: Diuretic effects. Am J Physiol 295: F1353–F1364, 2008 [DOI] [PMC free article] [PubMed] [Google Scholar]
- 19. Kim Y-H, Verlander JW, Matthews SW, Kurtz I, Shin WK, Weiner ID, Everett LA, Green ED, Nielsen S, Wall SM: Intercalated cell H+/OH- transporter expression is reduced in Slc26a4 null mice. Am J Physiol 289: F1262–F1272, 2005 [DOI] [PubMed] [Google Scholar]
- 20. Collier DM, Snyder PM: Extracellular chloride regulates the epithelial sodium channel. J Biol Chem 284: 29320–29325, 2009 [DOI] [PMC free article] [PubMed] [Google Scholar]
- 21. DuBose TD, Jr.: Effect of carbonic anhydrase inhibition on superficial and deep nephron bicarbonate reabsorption in the rat. J Clin Invest 71: 55–65, 1983 [DOI] [PMC free article] [PubMed] [Google Scholar]
- 22. Bailey MA, Giebisch G, Abbiati T, Aronson PS, Gawenis LR, Shull GE, Wang T: NHE2-mediated bicarbonate reabsorption in the distal tubule of NHE3 null mice. J Physiol 561.3: 765–775, 2004 [DOI] [PMC free article] [PubMed] [Google Scholar]
- 23. Kemendy AE, Kleyman TR, Eaton DC: Aldosterone alters the open probability of amiloride-blockable sodium channels in A6 epithelia. Am J Physiol 263: C825–C837, 1992 [DOI] [PubMed] [Google Scholar]
- 24. Chang SS, Grunder S, Hanukoglu A, Rosler A, Mathew PM, Hanukoglu I, Schild L, Lu Y, Shimkets RA, Nelson-Williams C, Rossier BC, Lifton RP: Mutations in subunits of the epithelial sodium channel cause salt wasting with hyperkalemic acidosis, pseudohypoaldosteronism type 1. Nat Genetics 12: 248–253, 1996 [DOI] [PubMed] [Google Scholar]
- 25. Shimkets RA, Warnock DG, Bositis CM, Nelson-Williams C, Hansson JH, Schambelan M, Gill JR, Jr., Ulick S, Milora RV, Findling JW: Liddle's syndrome: Heritable human hypertension caused by mutations in the beta subunit of the epithelial sodium channel. Cell 79: 407–414, 1994 [DOI] [PubMed] [Google Scholar]
- 26. Boudry JF, Stoner LC, Burg MB: Effect of acid lumen pH on potassium transport in renal cortical collecting tubules. Am J Physiol 230: 239–244, 1976 [DOI] [PubMed] [Google Scholar]
- 27. Stanton BA, Giebisch G: Effects of pH on potassium transport by renal distal tubule. Am J Physiol 242: F544–F551, 1982 [DOI] [PubMed] [Google Scholar]
- 28. Knepper M, Burg M: Organization of nephron function. Am J Physiol 244: F579–F589, 1983 [DOI] [PubMed] [Google Scholar]
- 29. Richardson RMA, Kunau RT, Jr.: Bicarbonate reabsorption in the papillary collecting duct: Effect of acetazolamide. Am J Physiol 243: F74–F80, 1982 [DOI] [PubMed] [Google Scholar]
- 30. Buerkert J, Martin D, Trigg D: Segmental analysis of the renal tubule in buffer production and net acid formation. Am J Physiol 244: F442–F454, 1983 [DOI] [PubMed] [Google Scholar]
- 31. Yao L-J, Leitges M, Vallon V: Mice lacking protein kinase C beta present modest increases in systolic blood pressure and NH4Cl-induced metabolic acidosis. Kidney Blood Press Res 29: 36–42, 2006 [DOI] [PubMed] [Google Scholar]
- 32. Hallows KR, Wang H, Edinger RS, Butterworth MB, Oyster NM, Li H, Buck J, Levin LR, Johnson JP, Pastor-Soler NM: Regulation of epithelial Na+ transport by soluble adenylyl cyclase in kidney collecting duct cells. J Biol Chem 284: 5774–5783, 2009 [DOI] [PMC free article] [PubMed] [Google Scholar]
- 33. Schuster VL: Cyclic adenosine monophosphate-stimulated anion transport in rabbit cortical collecting duct. J Clin Invest 78: 1621–1630, 1986 [DOI] [PMC free article] [PubMed] [Google Scholar]
- 34. Hanley MJ, Kokko JP: Study of chloride transport across the rabbit cortical collecting tubule. J Clin Invest 62: 39–44, 1978 [DOI] [PMC free article] [PubMed] [Google Scholar]
- 35. Everett LA, Belyantseva IA, Noben-Trauth K, Cantos R, Chen A, Thakkar SI, Hoogstraten-Miller SL, Kachar B, Wu DK, Green ED: Targeted disruption of mouse Pds provides insight about the inner-ear defects encountered in Pendred syndrome. Hum Mol Genet 10: 153–161, 2001 [DOI] [PubMed] [Google Scholar]
- 36. Wall SM, Knepper MA, Hassell KA, Fischer MP, Shodeinde A, Shin WK, Pham TD, Meyer JW, Lorenz JN, Beierwaltes WH, Dietz JR, Shull GE, Kim Y-H. Hypotension in NKCC1 null mice: Role of the kidneys. Am J Physiol 290: F409–F416, 2006 [DOI] [PubMed] [Google Scholar]
- 37. Brooks HL, Allred AJ, Beutler KT, Coffman TM, Knepper MA: Targeted proteomic profiling of renal Na+ transporter and channel abundances in angiotensin II type 1a receptor knockout mice. Hypertension 39: 470–473, 2002 [DOI] [PubMed] [Google Scholar]
- 38. Catalan MA, Nakamoto T, Gonzales-Begne M, Camden JM, Wall SM, Clarke LL, Melvin JE: CFTR and ENaC ion channels mediate NaCl absorption in the mouse submandibular gland. J Physiol 588: 713–724, 2010 [DOI] [PMC free article] [PubMed] [Google Scholar]
- 39. Terris J, Ecelbarger CA, Nielsen S, Knepper MA: Long-term regulation of four renal aquaporins in rats. Am J Physiol 271: F414–F422, 1996 [DOI] [PubMed] [Google Scholar]
- 40. Wall SM: NH4+ augments net acid secretion by a ouabain-sensitive mechanism in isolated perfused inner medullary collecting ducts. Am J Physiol 270: F432–F439, 1996 [DOI] [PubMed] [Google Scholar]
- 41. Bens M, Vallet V, Cluzeaud F, Pascual-Letallec L, Kahn A, Rafestin-Oblin ME, Rossier BC, Vandewalle A: Corticosteroid-dependent sodium transport in a novel immortilized mouse collecting duct principal cell line. J Am Soc Nephrol 10: 923–934, 1999 [DOI] [PubMed] [Google Scholar]
- 42. Marunaka Y, Eaton DC: Effects of vasopressin and cAMP on single amiloride-blockable Na channels. Am J Physiol 260: C1071–C1084, 1991 [DOI] [PubMed] [Google Scholar]
Associated Data
This section collects any data citations, data availability statements, or supplementary materials included in this article.


