Abstract
In the renal collecting duct, mineralocorticoids drive Na+ reabsorption, K+ secretion, and H+ secretion through coordinated actions on apical and basolateral transporters. Whether mineralocorticoids act through H+,K+-ATPases to maintain K+ and acid-base homeostasis is unknown. Here, treatment of mice with the mineralocorticoid desoxycorticosterone pivalate (DOCP) resulted in weight gain, a decrease in blood [K+] and [Cl−], and an increase in blood [Na+] and [HCO3−]. DOCP treatment increased the rate of H+,K+-ATPase–mediated H+ secretion in intercalated cells of the inner cortical collecting duct. mRNA expression of the catalytic subunit HKα1 did not significantly change, whereas HKα2 mRNA expression dramatically increased in the outer and inner medulla of DOCP-treated mice. A high-K+ diet abrogated this increase in renal HKα2 expression, showing that DOCP-mediated stimulation of HKα2 expression depends on dietary K+ intake. DOCP treatment of mice lacking HKα1 (HKα1−/−) resulted in greater urinary Na+ retention than observed in either wild-type mice or mice lacking both HKα1 and HKα2 (HKα1,2−/−). DOCP-treated HKα1,2−/− mice exhibited a lower blood [HCO3−] and less Na+ and K+ retention than either wild-type or HKα1−/− mice. Taken together, these results indicate that H+,K+-ATPases—especially the HKα2-containing H+,K+-ATPases—play an important role in the effects of mineralocorticoids on K+, acid-base, and Na+ balance.
Mineralocorticoid excess represents the most common endocrine form of hypertension and is poorly responsive to typical anti-hypertensive medications. With improved diagnostic criteria, the prevalence of mineralocorticoid-dependent hypertension is estimated to be as much as approximately 5 to 20% of hypertensive patients.1–3 A major contributing factor to mineralocorticoid-induced hypertension is increased Na+ reabsorption by the kidney. Specifically, mineralocorticoids increase expression and activity of the apical epithelial Na+ channel and the basolateral Na+,K+-ATPase in principal cells of the renal collecting duct to drive net Na+ reabsorption.4 Mineralocorticoids also stimulate H+ secretion by the collecting duct, in part by stimulating the activity of apical H+-ATPases,5,6 but the effect of mineralocorticoids on H+,K+-ATPase proton transport activity and expression in these segments has not been determined.
The renal H+,K+-ATPases are known to localize to the apical membrane of intercalated cells in the collecting duct.7 H+,K+-ATPases are composed of a catalytic α subunit and regulatory β subunit, and two different α subunits, HKα1 and HKα2, are expressed in the kidney. Only a few studies have investigated the effect of mineralocorticoids on renal H+,K+-ATPases, and most of these studies focused on acute mineralocorticoid effects (1 to 2 days) and have not directly measured proton secretion.8–11
In this study, desoxycorticosterone pivalate (DOCP) was used as a model of chronic mineralocorticoid excess.12 DOCP has long-lasting effects resulting from esterase cleavage in the muscle to the active mineralocorticoid, desoxycorticosterone.13,14 The timings of DOCP-induced disturbances in body weight, Na+, K+, and acid-base homeostasis were determined and correlated with renal H+,K+-ATPase activity and H+,K+-ATPase α subunit expression. Disturbances in Na+, K+, Cl−, and HCO3− homeostasis were evident in DOCP-treated wild-type mice after 8 days. DOCP treatment also increased renal H+,K+-ATPase activity and mRNA expression for HKα2 by this time point. This study also examined the physiologic role of the HKα1- and HKα2-containing H+,K+-ATPases in mineralocorticoid-induced electrolyte and acid-base disturbances using mice that have disruption of either the gene encoding for HKα1 (HKα1−/−) or both genes encoding for HKα1 and HKα2 (HKα1,2−/−). These studies show that the H+,K+-ATPases exert a profound influence on mineralocorticoid-mediated changes in Na+, K+, and acid-base homeostasis.
RESULTS
DOCP Caused Disturbances in Na+, K+, and Acid-Base Homeostasis
A primary goal of this study was to characterize the temporal changes in body weight, Na+, K+, and acid-base homeostasis during chronic mineralocorticoid excess. Body weight and blood electrolytes were measured over an 8-day time course in untreated (control) mice and those treated with DOCP (1.7 mg; Table 1). Excess body weight gain was apparent in DOCP-treated mice. DOCP treatment caused a considerable increase in body weight by day 4, but control mice exhibited no significant change in body weight over this time period (data not shown). The observed body weight gain in DOCP-treated mice is consistent with the known effect of DOCP to enhance Na+ and fluid volume retention. By the fourth day, DOCP treatment resulted in hypernatremia, an effect that started to wane by 8 days. Moreover, DOCP treatment resulted in a reduction in blood [K+] by 6 days after DOCP administration. Eight days of DOCP treatment also significantly increased blood [HCO3−] in wild-type mice. The timing and magnitude of blood [HCO3−] increases with DOCP treatment were reflected in a reciprocal decrease in blood [Cl−] by approximately 7 mM.
Table 1.
Time course of the physiologic effect of DOCP treatment in wild-type mice
| Control (n) | Day 2 (n) | Day 4 (n) | Day 6 (n) | Day 8 (n) | |
|---|---|---|---|---|---|
| Change in BW (%) | 0 ± 0 (7) | 0.06 ± 1.2 (7) | 2.0 ± 1.2 (7) | 5.4 ± 1.4 (7)a,b | 6.1 ± 1.2 (7)a,b |
| Blood [Na+] (mM) | 148 ± 0.41 (13) | 150 ± 1.3 (3) | 153 ± 1.8 (4)c | 153 ± 0.80 (3)c | 150 ± 0.41 (3) |
| Blood [K+] (mM) | 3.9 ± 0.08 (14) | 3.5 ± 0.12 (4) | 3.5 ± 0.17 (4) | 2.9 ± 0.21 (3)c | 2.8 ± 0.07 (3)b,c |
| Blood [Cl−] (mM) | 118 ± 0.51 (13) | 120 ± 1.8 (3) | 116 ± 0.95 (4) | 117 ± 0.35 (3) | 111 ± 0.82 (3)a,b,c,d |
| Blood [HCO3−] (mM) | 18 ± 0.51 (14) | 19 ± 0.87 (4) | 20 ± 1.2 (4) | 20 ± 0.53 (3) | 23 ± 2.0 (3)c |
BW, body weight. Day signifies days of DOCP treatment.
aSignificant difference from day 2.
bSignificant difference from day 4.
cSignificant difference from control.
dSignificant difference from day 6.
DOCP Increased H+,K+-ATPase Activity in the Collecting Duct
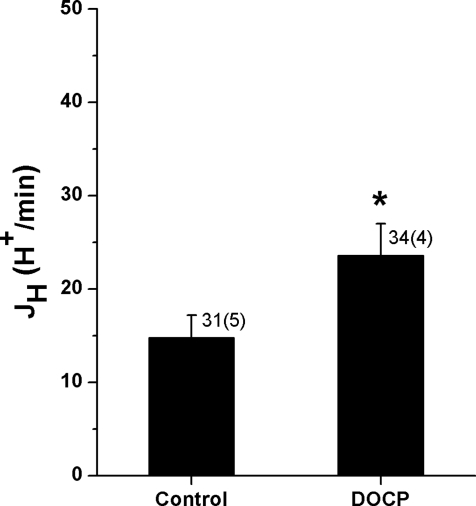
The results of the physiology studies showed that DOCP treatment led to the development of a reduced blood [K+] and greater blood [HCO3−] within 8 days. One likely mechanism for mineralocorticoid-induced changes in acid-base homeostasis was stimulation of renal H+,K+-ATPase activity in response to mineralocorticoid-induced K+ deficits. Therefore, H+,K+-ATPase activity was assessed in inner cortical collecting ducts from control and DOCP-treated mice. Individual intercalated cells from microperfused collecting ducts were loaded with a pH-sensitive fluorescent dye. The addition of inhibitors of the Na+/H+ exchanger and the H+-ATPase allowed for the measurement of H+,K+-ATPase–mediated H+ secretion (JH) in response to an acute intracellular acid load (NH4Cl). The overall rate of H+,K+-ATPase–mediated JH in intercalated cells from control mice was quite slow (approximately 15 H+/min; Figure 1). However, a >60% increase in H+,K+-ATPase–mediated JH was observed in intercalated cells from DOCP-treated mice.
Figure 1.
DOCP increases H+,K+-ATPase-mediated H+ secretion (JH) in ICs of the mouse collecting duct. JH (H+/min) in response to an acute intracellular acid load was measured in ICs of microperfused inner cortical collecting duct from control mice and those treated with DOCP for 8 days using a pH-sensitive dye. Data are presented as mean ± SEM and were analyzed by t test. *P < 0.05 compared with control; n shown as cells (tubules).
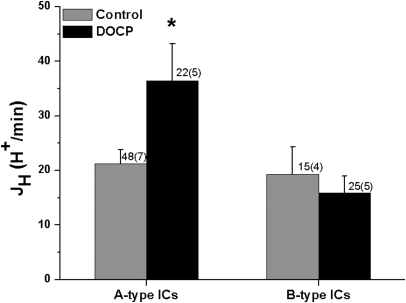
Additional experiments were conducted to identify which intercalated cell subtype was responsible for the DOCP-induced increase in H+,K+-ATPase–mediated JH. Again, the rate of H+,K+-ATPase–mediated JH was measured in intercalated cells of inner cortical collecting ducts from control and DOCP-treated mice. At the end of the experiment, A- and B-type ICs were differentiated by peritubular Cl− removal and return. The characteristic inverse responses of A- and B-type intercalated cells to Cl− removal and return were observed (Table 2). Intrinsic buffering capacity (βi) was not significantly affected by DOCP treatment. There was no difference in the rate of H+, K+-ATPase–mediated JH in A- and B-type intercalated cells (ICs) from control mice (Figure 2). Although the rate of H+,K+-ATPase–mediated JH was not affected in B-type ICs, DOCP treatment increased H+,K+-ATPase–mediated JH in A-type ICs by approximately 60%.
Table 2.
Characterization of IC subtypes from inner CCD of control and DOCP-treated mice
| A-Type IC |
B-Type IC |
|||
|---|---|---|---|---|
| Control (n = 48, 7) | DOCP (n = 22, 4) | Control (n = 15, 5) | DOCP (n = 24, 5) | |
| Cl− removal (U/min) | 0.52 ± 0.04 | 0.59 ± 0.04 | −0.31 ± 0.06 | −0.35 ± 0.03 |
| Cl− return (U/min) | −0.39 ± 0.03 | −0.37 ± 0.06 | 0.37 ± 0.04 | 0.37 ± 0.03 |
| βi (U/min) | 69.1 ± 6.91 | 86.8 ± 16.6 | 68.7 ± 10.5 | 87.7 ± 9.02 |
U/min, change in pH; βi, buffering capacity. n = cells, tubules.
Figure 2.
DOCP increases H+,K+-ATPase-mediated H+ secretion (JH) in A-type ICs of the mouse collecting duct. JH (H+/min) in response to an acute intracellular acid load was measured in ICs of microperfused inner cortical collecting duct from control mice and those treated with DOCP for 8 days using a pH-sensitive dye. A- and B-type ICs were differentiated by response to peritubular Cl− removal/return. Data are presented as mean ± SEM. The effect of DOCP in each cell type was analyzed using a t test. *P < 0.05 compared with control in the same cell type; n shown as cells (tubules).
DOCP Induced Medullary HKα2 mRNA Expression
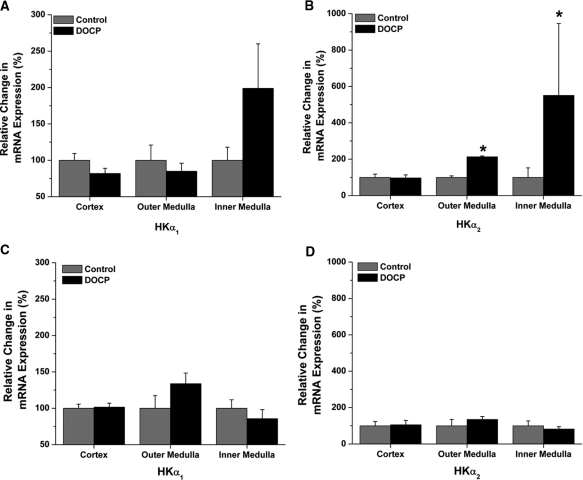
The principal mechanism of mineralocorticoid action is through modulation of target gene transcription.15 Therefore, the next experiments evaluated the effect of DOCP on renal HKα1 and HKα2 mRNA expression. Real-time quantitative PCR was used to study changes in steady-state mRNA levels of H+, K+-ATPase α subunits, HKα1 and HKα2, in cortex, outer medulla, and inner medulla of control and DOCP-treated mice. Eight days after DOCP treatment, HKα1 mRNA expression in all three kidney segments was not significantly altered compared with control (Figure 3A). DOCP treatment had a tendency to increase HKα1 expression in the inner medulla. DOCP did not affect HKα2 mRNA expression in the cortex (Figure 3B). However, HKα2 mRNA levels were increased more than twofold in the outer medulla and as much as fivefold in the inner medulla of DOCP-treated mice.
Figure 3.
High K+ diet abrogates the increase in medullary HKα2 expression with DOCP treatment in mice. Real-time PCR was performed to quantify relative mRNA expression for (A) HKα1 and (B) HKα2 in cortex, outer medulla, and inner medulla of control mice and those treated with DOCP for 8 days on a normal diet. Relative mRNA expression was also determined for (C) HKα1 and (D) HKα2 in cortex, outer medulla, and inner medulla of control and DOCP-treated mice on a high K+ (5%) diet. Expression was set relative to β-actin. Fold changes (2−ΔΔCt) in expression were calculated and set to percentage, with control set at 100%. Data are presented as mean ± SEM, and expression with DOCP treatment was compared with control levels by t test. *P < 0.05 compared with control; n = 7 to 10 for normal diet and n = 4 for high K+ diet.
Deficits in K+ have long been known to stimulate H+,K+-ATPase activity and HKα subunit expression. Therefore, the next experiments studied whether the decreases in blood [K+] observed in DOCP-treated mice were responsible for the stimulation of HKα2 mRNA expression. For this experiment, mice were fed a high K+ diet and left untreated (control) or given DOCP treatment. Body weight and blood electrolytes were measured 8 days after treatment, and kidneys were collected for analysis of HKα1 and HKα2 mRNA expression by real-time PCR. A high K+ diet abrogated the effect of DOCP on body weight gain and blood [K+], [Cl−], and [HCO3−] in mice (Table 3). Similarly, the stimulation of HKα1 or HKα2 mRNA expression with DOCP was absent in mice fed a high K+ diet (Figure 3, C and D). These results show that stimulation of medullary H+, K+-ATPase α subunit mRNA expression with DOCP treatment is dependent on dietary K+ intake.
Table 3.
Effect of high K+ (5%) diet on physiologic response of wild type mice to DOCP treatment
| Control (n = 4) | DOCP (n = 4) | |
|---|---|---|
| Body weight change (g) | −0.42 ± 0.09 | −0.17 ± 0.27 |
| Blood [Na+] (mM) | 149 ± 0.99 | 151 ± 0.88 |
| Blood [K+] (mM) | 4.25 ± 0.06 | 4.30 ± 0.18 |
| Blood [Cl−] (mM) | 119 ± 0.45 | 121 ± 1.30 |
| Blood [HCO3−] (mM) | 17.3 ± 0.64 | 18.2 ± 1.01 |
HKα-Null Mice Showed Altered Na+, K+, and Acid-Base Homeostasis with DOCP Treatment
The final set of experiments considered the physiologic function of renal H+,K+-ATPases in the response to chronic mineralocorticoid excess and specifically characterized the effect of DOCP treatment on the electrolyte and acid-base homeostasis of mice with disruption of the H+,K+-ATPase HKα1 subunit (HKα1−/−) or both the HKα1 and HKα2 subunits (HKα1,2−/−). Body weight change (%) and blood electrolytes were first measured in untreated wild-type and knockout mice (Table 4). No appreciable body weight change (%) was observed in untreated mice of any genotype over 8 days (data not shown). Blood [K+] was paradoxically greater in the HKα1,2−/− compared with wild-type or HKα1−/− mice. Blood [Cl−] was less in the HKα1−/− mice compared with either the wild-type or HKα1,2−/− mice.
Table 4.
Differences in blood chemistry of WT and HKα-null mice
| WT (n = 13 to 14) | HKα1−/− (n = 5) | HKα1,2−/− (n = 9) | |
|---|---|---|---|
| Blood [Na+] (mM) | 148 ± 0.41 | 149 ± 1.1 | 148 ± 0.58 |
| Blood [K+] (mM) | 3.9 ± 0.08 | 3.9 ± 0.12 | 4.4 ± 0.17a |
| Blood [Cl−] (mM) | 118 ± 0.51 | 114 ± 1.3a | 116 ± 0.91 |
| Blood [HCO3−] (mM) | 18 ± 0.51 | 21 ± 1.2 | 19 ± 0.69 |
aSignificant difference from WT.
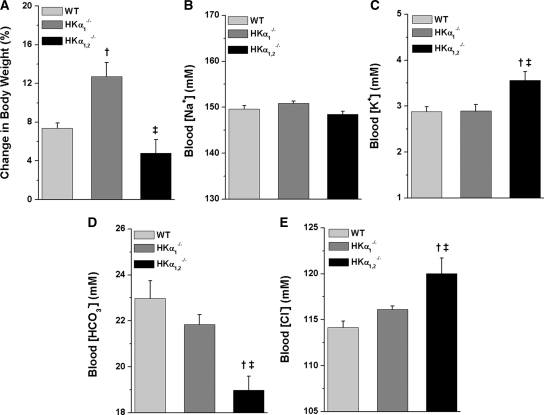
In a separate study, the effect of DOCP treatment on body weight change, blood electrolytes, and urinary and fecal electrolyte excretion was examined in wild-type, HKα1−/−, and HKα1,2−/− mice on a normal diet. DOCP-induced body weight gain was comparable in wild-type and HKα1,2−/− mice but was augmented nearly twofold in HKα1−/− mice (Figure 4A). Blood [Na+] was similar in mice from all three genotypes (Figure 4B). Although DOCP decreased blood [K+] in mice from all three genotypes, HKα1,2−/− mice still exhibited greater blood [K+] than wild-type or HKα1−/− mice (Figure 4C). The effect of DOCP to decrease blood [Cl−] (Figure 4D) and increase blood [HCO3−] (Figure 4E) was eliminated in HKα1,2−/− mice.
Figure 4.
DOCP treatment differentially affects body weight and blood [HCO3−] in WT and HKα-null mice. All data shown are from the eighth day of DOCP treatment. (A) Body weight change (%) is shown as the percent change in body weight from day 0. Arterial blood samples were collected from the aorta, and (B) blood [Na+], (C) [K+], (D) [HCO3−], and (E) [Cl−] were measured on a clinical blood gas analyzer. Data are presented as mean ± SEM and were analyzed by one-way ANOVA followed by post hoc Student-Newman-Keuls test. †P < 0.05 compared with WT; ‡P < 0.05 compared with HKα1−/− mice. n = 10 to 11 WT and n = 5 HKα1−/− and HKα1,2−/− mice.
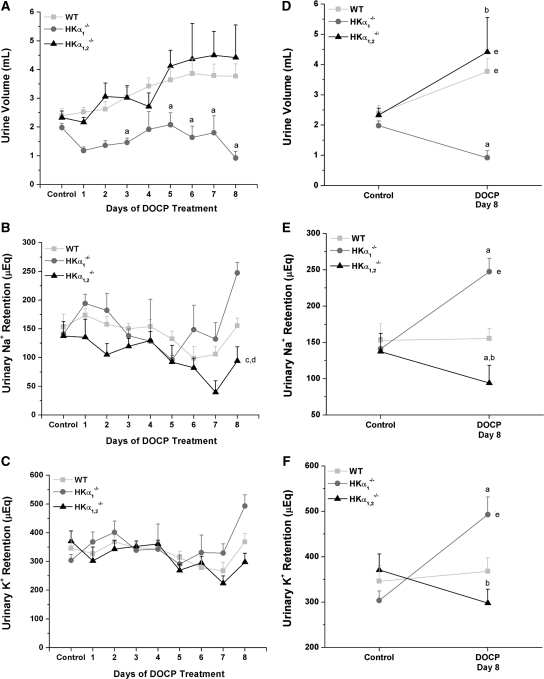
To more fully understand the mechanism for the observed differences in body weight gain and blood electrolytes between wild-type and HKα knockout mice, urinary and fecal Na+ and K+ excretion was measured the day before and 8 days after DOCP treatment. Urine volume doubled by the end of DOCP treatment in both wild-type and HKα1,2−/− mice but considerably decreased in HKα1−/− mice (Figure 5, A and D). Over the course of DOCP treatment, HKα1,2−/− retained significantly less urinary Na+ than wild-type or HKα1−/− mice (Figure 5B). In comparison with day 8 of DOCP treatment to control urinary Na+ retention, HKα1−/− mice retained more urinary Na+ than wild-type mice at this time point (Figure 5E). After 8 days of DOCP treatment, urinary K+ retention was greater in HKα1−/− mice than either wild-type or HKα1,2−/− mice (Figure 5, C and F).
Figure 5.
DOCP treatment differentially alters urinary Na+ and K+ retention in WT and HKα-null mice. (A) Urinary volume, (B) Na+, and (C) K+ retention were measured in WT, HKα1−/− and HKα1,2−/− mice from the day preceding treatment (control) and over an 8-day period of DOCP treatment. Urinary electrolyte retention (μEq) was calculated as the urinary excretion per day subtracted from dietary intake on that day. (D–F) Comparisons of control urine values versus only day 8 of DOCP treatment are shown. All data were analyzed by a two-way repeated-measure ANOVA with post hoc Student-Newman-Keuls test and are shown as mean ± SEM. P < 0.05 is considered significant. Comparison of genotype within day: asignificant difference from WT; bsignificant difference from HKα1−/− mice. Comparison of genotype over the time course: csignificant difference from WT; dsignificant difference from HKα1−/− mice. eSignificant difference from control within the same genotype. WT, n = 10; HKα1−/−, n = 5; HKα1,2−/−, n = 5.
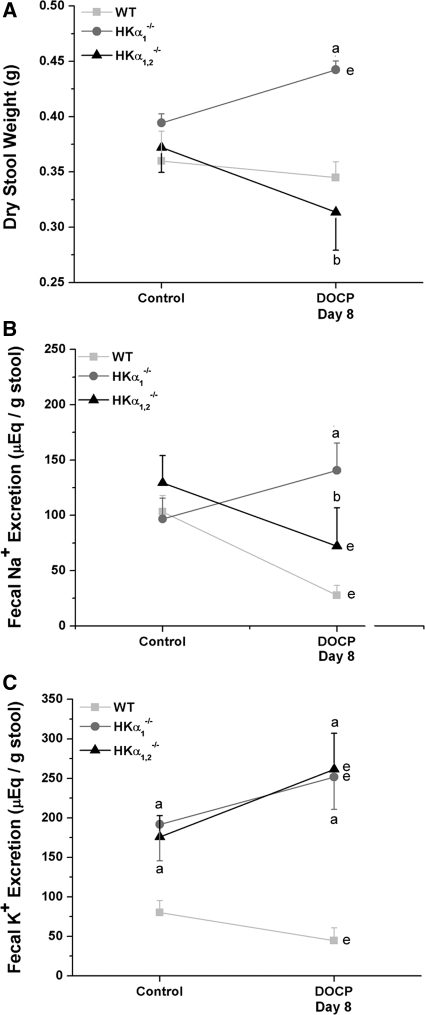
Analysis of stool samples from wild-type, HKα1−/−, and HKα1,2−/− mice showed that HKα1−/− mice excreted 50% more dry stool weight than either the wild-type or HKα1,2−/− mice when treated with DOCP, even though the mice were pair fed (Figure 6A). Fecal Na+ excretion significantly decreased in DOCP-treated wild-type and HKα1,2−/− mice and was significantly greater in DOCP-treated HKα1−/− mice than wild-type or HKα1,2−/− mice (Figure 6B). Interestingly, fecal K+ loss was evident in both HKα1−/− and HKα1,2−/− mice in the control period, and this loss increased approximately 50% with DOCP treatment (Figure 6C).
Figure 6.
HKα-null mice exhibit altered fecal electrolyte excretion under control and DOCP-treated conditions. (A) Fecal output, (B) Na+, and (C) K+ excretion were measured in WT, HKα1−/−, and HKα1,2−/− mice on the day preceding treatment (control) and on day 8 of DOCP treatment. Data are shown as mean ± SEM and were analyzed by two-way repeated-measure ANOVA with post hoc Student-Newman-Keuls test; P < 0.05 is considered significant. aSignificant difference from WT; bsignificant difference from HKα1−/− mice; esignificant difference from control within the same genotype. WT, n = 11; HKα1−/−, n = 4; HKα1,2−/−, n = 5 to 6.
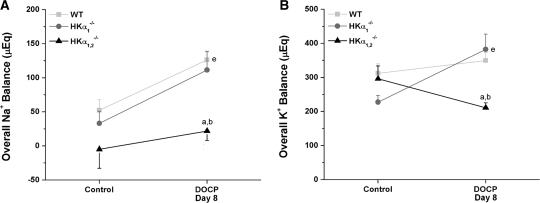
In the context of whole animal physiology, it is important to examine the overall electrolyte balance as the sum of urinary and fecal excretion subtracted from the intake of that electrolyte. Overall Na+ and K+ balance was not significantly different in mice from any genotype under control conditions (Figure 7). As expected, overall Na+ balance increased in wild-type mice with DOCP treatment (Figure 7A). Overall Na+ retention was significantly less in HKα1,2−/− mice than wild-type or HKα1−/− mice on the eighth day of DOCP treatment. Also unlike HKα1−/− mice, HKα1,2−/− mice exhibited approximately 75% less K+ retention than wild-type mice with DOCP treatment (Figure 7B). These results conclusively show that disruption of H+,K+-ATPases in mice abolishes the effect of DOCP to increase total body Na+ and K+ retention.
Figure 7.
HKα-null mice display disturbances in overall electrolyte balance with DOCP treatment. Overall (A) Na+ and (B) K+ balance (μEq) are shown for WT, HKα1−/−, and HKα1,2−/− mice on the day preceding treatment (control) and on day 8 of DOCP treatment. Overall electrolyte balance was calculated as the amount of the electrolyte excreted in the urine and feces subtracted from dietary intake of that electrolyte. Data are shown as mean ± SEM and were analyzed by two-way repeated-measure ANOVA with post hoc Student-Newman-Keuls test or one-way repeated-measure ANOVA with post hoc Tukey test; P < 0.05 is considered significant. aSignificant difference from WT; bsignificant difference from HKα1−/− mice; esignificant difference from control within the same genotype. WT, n = 10; HKα1−/−, n = 4; HKα1,2−/−, n = 5.
DISCUSSION
In this study, we provided definitive evidence that mineralocorticoids regulate the activity and expression of renal H+,K+-ATPases. Prolonged exposure to DOCP increased H+ secretion in the collecting duct through renal H+,K+-ATPases. More specifically, the increase in HKα2 expression with DOCP treatment supports a particularly important role of the HKα2 H+,K+-ATPase isoform in mineralocorticoid-induced H+ secretion. Whole animal studies in HKα1−/− and HKα1,2−/− mice subjected to DOCP treatment highlight the significance of H+,K+-ATPases to mineralocorticoid-mediated disturbances in K+ and acid-base homeostasis, as well as Na+ homeostasis. The overall deficit in K+ retention and lower blood [HCO3−] observed in DOCP-treated HKα1,2−/− mice signifies the importance of H+,K+-ATPases to facilitate K+ reabsorption and H+ secretion with mineralocorticoid excess. Importantly, the elimination of DOCP-induced Na+ retention in HKα1,2−/− mice and not in HKα1−/− mice indicates that the HKα2-containing H+,K+-ATPases indirectly regulate mineralocorticoid-mediated Na+ retention, which may present major implications for BP regulation.
The effect of long-term mineralocorticoid excess to change H+,K+-ATPase activity and its relation to dietary K+ intake has previously been examined by Eiam-Ong et al.11 In contrast to the results described here, 7-day exposure to low, normal, or high aldosterone levels in rats fed diets consisting of low, normal, and high K+ content did not significantly affect Schering 28080–sensitive (a gastric or HKα1-containing H+,K+-ATPase inhibitor16) ATPase activity in microdissected cortical and medullary collecting ducts. However, the effect of aldosterone treatment on HKα2-containing H+,K+-ATPases was not studied. The observed stimulation of H+,K+-ATPase activity in A-type ICs of inner cortical collecting ducts from DOCP-treated mice coupled with the dramatic augmentation of HKα2 mRNA expression in the renal medulla of DOCP-treated mice shows that mineralocorticoids, in fact, do regulate renal H+,K+-ATPases.
The renal H+,K+-ATPases have been purported to act as primarily K+ reabsorptive mechanisms. Because hypokalemia has been shown to substantially increase medullary HKα2 expression17–19 and hypokalemia was quite evident with DOCP treatment, the induction of HKα2 expression in the outer and inner medulla of DOCP-treated mice could be a result of hypokalemia. Abolishment of DOCP-induced HKα2 mRNA expression in the medulla by high K+ is consistent with this hypothesis.
The increase in H+,K+-ATPase-mediated H+ secretion in the collecting duct and HKα2 subunit expression in the kidney coincided with the development of a greater blood [HCO3−] in DOCP-treated wild-type mice. The similar time course of these two events suggests that H+,K+-ATPases are responsible for a significant portion of the increase in blood [HCO3−] with mineralocorticoid excess. Most importantly, DOCP treatment did not significantly increase blood [HCO3−] in HKα1,2−/− mice. Taken together with the response of the wild-type mice, these data strongly support the hypothesis that the H+,K+-ATPases mediate the development of mineralocorticoid-induced alkalosis.
Excessive body weight gain and urinary Na+ retention in DOCP-treated HKα1−/− mice and its elimination in HKα1,2−/− mice shows that the mineralocorticoid-sensitive component of Na+ and fluid reabsorption depends directly or indirectly on the HKα2-containing H+,K+-ATPases. Precedent for such a conclusion is supported by two separate sets of observations: (1) both the HKα1- and HKα2-containing H+,K+-ATPases have been found to transport Na+ on the K+ binding site of the transporter,20–22 and (2) evidence from Spicer et al.23 supports a dependence of the epithelial Na+ channel on the HKα2-containing H+,K+-ATPases. Specifically, HKα2−/− mice had reduced colonic epithelial Na+ channel activity on a normal diet compared with wild-type mice and this effect was exacerbated by dietary Na+ restriction. The observation that DOCP treatment affected urinary K+ retention in HKα1−/− and HKα1,2−/− mice, as well as Na+, is consistent with an indirect mechanism of H+,K+-ATPase–mediated Na+ reabsorption.
The results of these studies provide evidence for an important role of the H+,K+-ATPases in normal K+ homeostasis and in mineralocorticoid-mediated effects on K+, acid-base, and Na+ balance. Future investigation into the mechanism(s) by which the renal H+,K+-ATPases contribute to Na+ and fluid balance may very likely shed important light on the pathogenesis of mineralocorticoid hypertension.
CONCISE METHODS
Animals
All animal use protocols were approved by the North Florida/South Georgia Veterans Administration Institutional Animal Care and Use Committee in accordance with the National Institute of Health Guide for the Care and Use of Laboratory Animals. Female C57BL/6J mice were purchased from Jax Labs (Bar Harbor, ME) or bred in house. HKα1−/− and HKα1,2−/− mice were generous gifts from Dr. Gary Shull. The latter were generated from breeding HKα1−/−24 and HKα2−/−25 mice and backcrossing onto the C57BL/6J background strain. Genotypes were confirmed by PCR of genomic DNA as described previously.26
Mice were fed normal laboratory chow, given free access to water, and given an intramuscular injection of 1.7 mg DOCP (Percorten V; Novartis Pharmaceuticals). For perfusion and expression studies, mice were killed with Na+ pentobarbital (120 mg/kg, intraperitoneally), followed by cervical dislocation. For time course experiments, another group of animals were anesthetized with 3 to 4% isoflurane, and aortic blood was collected into a heparinized syringe for immediate analysis of electrolytes and blood gases (Nova pHOx Plus analyzer, Nova Biomedical). For high K+ diet studies, mice were given a normal, powdered diet (TD99131, Teklad) supplemented with KCl to equal 5% K+, which was made as a gel. One half of the mice were treated with DOCP. Blood and tissues were collected as in the time course experiments. For urinalysis experiments, mice were housed in metabolic cages for 13 days and fed a normal gel diet with free access to a water bottle. On day 5, mice were treated with DOCP as above. Urine and feces were collected daily. Urine electrolytes were measured on a clinical analyzer (Nova 16 analyzer; Nova Biomedical), and fecal electrolytes were measured on a digital flame photometer (Model 2655-00; Cole-Parmer).
Tubule Perfusion and pHi Recovery
Inner cortical collecting ducts were hand dissected at 4 °C, transferred to a mounting chamber, and perfused as described previously.26 The ratiometric, pH-sensitive dye, 3′,6′-bis(Acetyloxy)-5(or 6)-[[(acetyloxy)methoxy]carbonyl]-3-oxo-spiro[isobenzofuran-1(3H),9′-[9H]xanthene]-2′,7′-dipropanoic acid 2′,7′-bis[(acetyloxy)methyl] ester (15 μM; Invitrogen), was added to the luminal perfusate for 10 minutes, and fluorescence measurements were performed after dye de-esterification. Tubules were equilibrated with 100 nM bafilomycin A1 in the luminal perfusate and 10 μM EIPA in the peritubular solution for 20 min, and inhibitors were present throughout the remainder of the experiment. Cells were acid loaded by a 3-minute, peritubular exposure to 40 mM NH4Cl, followed by NH4Cl removal. Ratiometric intensity measurements (I490/440) were made in individual, well-defined ICs and converted to pHi using linear regression, based on a high K+/nigericin calibration curve. Recovery rates were calculated from the linear portion of the pHi recovery phase, starting with the lowest pHi achieved. The intrinsic buffering capacity was calculated from the formula βi = ΔHi/ΔpHi, where ΔHi is the change in the calculated [NH4+]i and ΔpHi is the change in pHi during the acid-loaded phase. Acid secretion rates (JH) were calculated from the formula JH = βi × ΔpHi (U/min) and expressed as [H+]/min (H+/min). A- and B-type ICs were differentiated using peritubular chloride removal and return in HCO3−-containing solutions as described previously.26–28
Analysis of mRNA
RNA was recovered from cortex, medulla, and inner medulla with TRIzol reagent (Invitrogen). RNA was treated with DNase 1 (Ambion DNA Free) and converted to cDNA using SuperScript III (Invitrogen). For real-time quantitative PCR, 20 ng cDNA was used to quantify mRNA expression with TaqMan Gene Expression (Applied Biosystems) primer/probe sets for HKα1 (Atp4a, Mm00444423_m1), HKα2 (Atp12a, Mm0131809_m1), and β-actin (Actb, Mm00607939_s1). Cycle threshold values were normalized to β-actin, and relative expression (control set to 100%) was calculated by the ΔΔCt method.29
Statistical Analysis
All data are represented as mean ± SEM. Statistics were performed with Origin 8 and Sigma Stat 3.1, and all graphs/plots were made with Origin 8. The effects of time and treatment or time and genotype were analyzed by a two-way repeated-measure ANOVA with post hoc Student-Newman-Keuls test. The effect of treatment duration or genotype was analyzed by one-way ANOVA with a post hoc Student-Newman-Keuls test. An unpaired t test was used to compare differences between control and treated groups. P < 0.05 was considered significant.
DISCLOSURES
None.
Supplementary Material
Acknowledgments
We thank Dr. Gary Shull (University of Cincinnati) for his generous gift of the HKα1−/− and HKα1,2−/− mice and Jeremiah Mitzelfelt (University of Florida) for statistical consultation. This study was supported by grants from the National Institutes of Health to C.S.W. (RO1-DK049750) and to the Division of Nephrology, Hypertension, and Renal Transplantation and M.M.G. (5T32DK007518-22). These experiments have been cited in an abstract at Experimental Biology 2010 (Anaheim, CA).
Footnotes
Published online ahead of print. Publication date available at www.jasn.org.
Supplemental information for this article is available online at http://www.jasn.org/.
REFERENCES
- 1. Boscaro M, Ronconi V, Turchi F, Giacchetti G: Diagnosis and management of primary aldosteronism. Curr Opin Endocrinol Diabetes Obes 15: 332–338, 2008 [DOI] [PubMed] [Google Scholar]
- 2. Marney AM, Brown NJ: Aldosterone and end-organ damage. Clin Sci (Lond) 113: 267–278, 2007 [DOI] [PubMed] [Google Scholar]
- 3. Sowers JR, Whaley-Connell A, Epstein M: Narrative review: The emerging clinical implications of the role of aldosterone in the metabolic syndrome and resistant hypertension. Ann Intern Med 150: 776–783, 2009 [DOI] [PMC free article] [PubMed] [Google Scholar]
- 4. Eaton DC, Malik B, Saxena NC, Al-Khalili OK, Yue G: Mechanisms of aldosterone's action on epithelial Na+ transport. J Membr Biol 184: 313–319, 2001 [DOI] [PubMed] [Google Scholar]
- 5. Kovacikova J, Winter C, Loffing-Cueni D, Loffing J, Finberg KE, Lifton RP, Hummler E, Rossier B, Wagner CA: The connecting tubule is the main site of the furosemide-induced urinary acidification by the vacuolar H+-ATPase. Kidney Int 70: 1706–1716, 2006 [DOI] [PubMed] [Google Scholar]
- 6. Winter C, Schulz N, Giebisch G, Geibel JP, Wagner CA: Nongenomic stimulation of vacuolar H+-ATPases in intercalated renal tubule cells by aldosterone. Proc Natl Acad Sci USA 101: 2636–2641, 2004 [DOI] [PMC free article] [PubMed] [Google Scholar]
- 7. Gumz ML, Lynch IJ, Greenlee MM, Cain BD, Wingo CS: The renal H+-K+-ATPases: Physiology, regulation, and structure. Am J Physiol Renal Physiol. 298: F12–F21, 2010 [DOI] [PMC free article] [PubMed] [Google Scholar]
- 8. Dos Santos PM, Freitas FP, Mendes J, Tararthuch AL, Fernandez R: Differential regulation of H+-ATPases in MDCK-C11 cells by aldosterone and vasopressin. Can J Physiol Pharmacol 87: 653–665, 2009 [DOI] [PubMed] [Google Scholar]
- 9. Gekle M, Silbernagl S, Oberleithner H: The mineralocorticoid aldosterone activates a proton conductance in cultured kidney cells. Am J Physiol 273: C1673–C1678, 1997 [DOI] [PubMed] [Google Scholar]
- 10. Jaisser F, Escoubet B, Coutry N, Eugene E, Bonvalet JP, Farman N: Differential regulation of putative K+-ATPase by low-K+ diet and corticosteroids in rat distal colon and kidney. Am J Physiol 270: C679–C687, 1996 [DOI] [PubMed] [Google Scholar]
- 11. Eiam-Ong S, Kurtzman NA, Sabatini S: Regulation of collecting tubule adenosine triphosphatases by aldosterone and potassium. J Clin Invest 91: 2385–2392, 1993 [DOI] [PMC free article] [PubMed] [Google Scholar]
- 12. Kintzer PP, Peterson ME: Treatment and long-term follow-up of 205 dogs with hypoadrenocorticism. J Vet Intern Med 11: 43–49, 1997 [DOI] [PubMed] [Google Scholar]
- 13. Lynn RC, Feldman EC: Treatment of canine hypoadrenocorticism with microcrystalline desoxycorticosterone pivalate. Br Vet J 147: 478–483, 1991 [DOI] [PubMed] [Google Scholar]
- 14. Lynn RC, Feldman EC, Nelson RW: Efficacy of microcrystalline desoxycorticosterone pivalate for treatment of hypoadrenocorticism in dogs. DOCP Clinical Study Group. J Am Vet Med Assoc 202: 392–396, 1993 [PubMed] [Google Scholar]
- 15. Fuller PJ, Young MJ: Mechanisms of mineralocorticoid action. Hypertension 46: 1227–1235, 2005 [DOI] [PubMed] [Google Scholar]
- 16. Wallmark B, Briving C, Fryklund J, Munson K, Jackson R, Mendlein J, Rabon E, Sachs G: Inhibition of gastric H+,K+-ATPase and acid secretion by SCH 28080, a substituted pyridyl(1,2a)imidazole. J Biol Chem 262: 2077–2084, 1987 [PubMed] [Google Scholar]
- 17. Ahn KY, Park KY, Kim KK, Kone BC: Chronic hypokalemia enhances expression of the H+-K+-ATPase α2-subunit gene in renal medulla. Am J Physiol 271: F314–F321, 1996 [DOI] [PubMed] [Google Scholar]
- 18. Codina J, Delmas-Mata JT, DuBose TD, Jr: Expression of HKα2 protein is increased selectively in renal medulla by chronic hypokalemia. Am J Physiol 275: F433–F440, 1998 [DOI] [PubMed] [Google Scholar]
- 19. Nakamura S, Amlal H, Galla JH, Soleimani M: Colonic H+-K+-ATPase is induced and mediates increased HCO3- reabsorption in inner medullary collecting duct in potassium depletion. Kidney Int 54: 1233–1239, 1998 [DOI] [PubMed] [Google Scholar]
- 20. Swarts HG, Klaassen CH, Schuurmans Stekhoven FM, De Pont JJ: Sodium acts as a potassium analog on gastric H,K-ATPase. J Biol Chem 270: 7890–7895, 1995 [DOI] [PubMed] [Google Scholar]
- 21. Swarts HG, Koenderink JB, Willems PH, De Pont JJ: The human non-gastric H,K-ATPase has a different cation specificity than the rat enzyme. Biochim Biophys Acta 1768: 580–589, 2007 [DOI] [PubMed] [Google Scholar]
- 22. Zhou X, Xia SL, Wingo CS: Chloride transport by the rabbit cortical collecting duct: dependence on H,K-ATPase. J Am Soc Nephrol 9: 2194–2202, 1998 [DOI] [PubMed] [Google Scholar]
- 23. Spicer Z, Clarke LL, Gawenis LR, Shull GE: Colonic H+-K+-ATPase in K+ conservation and electrogenic Na+ absorption during Na+ restriction. Am J Physiol Gastrointest Liver Physiol 281: G1369–G1377, 2001 [DOI] [PubMed] [Google Scholar]
- 24. Spicer Z, Miller ML, Andringa A, Riddle TM, Duffy JJ, Doetschman T, Shull GE: Stomachs of mice lacking the gastric H, K-ATPase α-subunit have achlorhydria, abnormal parietal cells, and ciliated metaplasia. J Biol Chem 275: 21555–21565, 2000 [DOI] [PubMed] [Google Scholar]
- 25. Meneton P, Schultheis PJ, Greeb J, Nieman ML, Liu LH, Clarke LL, Duffy JJ, Doetschman T, Lorenz JN, Shull GE: Increased sensitivity to K+ deprivation in colonic H,K-ATPase-deficient mice. J Clin Invest 101: 536–542, 1998 [DOI] [PMC free article] [PubMed] [Google Scholar]
- 26. Lynch IJ, Rudin A, Xia SL, Stow LR, Shull GE, Weiner ID, Cain BD, Wingo CS: Impaired acid secretion in cortical collecting duct intercalated cells from H-K-ATPase-deficient mice: Role of HKα isoforms. Am J Physiol Renal Physiol 294: F621–F627, 2008 [DOI] [PubMed] [Google Scholar]
- 27. Lynch IJ, Greenlee MM, Gumz ML, Rudin A, Xia SL, Wingo CS: Heterogeneity of H-K-ATPase-mediated acid secretion along the mouse collecting duct. Am J Physiol Renal Physiol 298: F408–F415, 2010 [DOI] [PMC free article] [PubMed] [Google Scholar]
- 28. Petrovic S, Spicer Z, Greeley T, Shull GE, Soleimani M: Novel Schering and ouabain-insensitive potassium-dependent proton secretion in the mouse cortical collecting duct. Am J Physiol Renal Physiol 282: F133–F143, 2002 [DOI] [PubMed] [Google Scholar]
- 29. Livak KJ, Schmittgen TD: Analysis of relative gene expression data using real-time quantitative PCR and the 2−ΔΔCt method. Methods 25: 402–408, 2001 [DOI] [PubMed] [Google Scholar]
Associated Data
This section collects any data citations, data availability statements, or supplementary materials included in this article.


