Abstract
Human adenoviruses (Ads) replicate and assemble particles in the nucleus. They organize a linear double-strand DNA genome into a condensed core with about 180 nucleosomes, by the viral proteins VII (pVII), pX, and pV attaching the DNA to the capsid. Using reverse genetics, we generated a novel, nonconditionally replicating Ad reporter by inserting green fluorescent protein (GFP) at the amino terminus of pV. Purified Ad2-GFP-pV virions had an oversized complete genome and incorporated about 38 GFP-pV molecules per virion, which is about 25% of the pV levels in Ad2. GFP-pV cofractionated with the DNA core, like pV, and newly synthesized GFP-pV had a subcellular localization indistinguishable from that of pV, indicating that GFP-pV is a valid reporter for pV. Ad2-GFP-pV completed the replication cycle, although at lower yields than Ad2. Incoming GFP-pV (or pV) was not imported into the nucleus. Virions lost GFP-pV at two points during the infection process: at entry into the cytosol and at the nuclear pore complex, where capsids disassemble. Disassembled capsids, positive for the conformation-specific antihexon antibody R70, were devoid of GFP-pV. The loss of GFP-pV was reduced by the macrolide antibiotic leptomycin B (LMB), which blocks nuclear export and adenovirus attachment to the nuclear pore complex. LMB inhibited the appearance of R70 epitopes on Ad2 and Ad2-GFP-pV, indicating that the loss of GFP-pV from Ad2-GFP-pV is an authentic step in the adenovirus uncoating program. Ad2-GFP-pV is genetically complete and hence enables detailed analyses of infection and spreading dynamics in cells and model organisms or assessment of oncolytic adenoviral potential.
DNA viruses and retroviruses maintain and replicate their genomes in host cell nuclei by using histone-based nucleosomes, similar to chromatin, or they encode their own DNA binding and DNA-organizing proteins (34, 45, 47). They assemble and maintain their genomes in different chromatin states by packaging the nucleic acids into proteinaceous capsids and sometimes lipid envelopes and thereby traffic their genome within and transmit it between cells (8, 41). The simian virus 40 (SV40) polyomavirus, for example, packages its virion DNA with cellular core histones and uses histones to replicate in infected nuclei (19). Herpesviruses, on the other hand, condense their double-strand DNA in particles with the help of polyamines and use histones during latent residence within infected nuclei or use irregularly spaced nucleosomes during productive phases of infection (45).
Adenoviruses (Ads) replicate and assemble particles in the nucleus. They encode their own histone-like proteins to condense a linear double-strand DNA genome of about 36 kbp into a proteinaceous DNA core. Although it is unknown how the viral DNA is precisely organized in the virion, isolated cores of species C human adenovirus serotypes 2 and 5 (Ad2/5) contain six viral proteins, the basic proteins V (pV), pVII, and pX; the terminal protein covalently attached to the 5′ ends of the DNA; and small numbers of proteins IVa2 and L3/p23 protease, which are involved in DNA encapsidation and transcriptional regulation or virion processing (reviewed in references 4 and 48). Proteins V, VII, and X are tightly interconnected, as indicated by chemical cross-linking experiments (11). Digestion of virion cores with staphylococcal nuclease combined with electron microscopy (EM) analyses and stoichiometric calculations suggested a model where the viral DNA is organized into approximately 180 nucleosome-like units by three subunits of dimeric pVII interspersed with one copy of pV (5, 10, 13, 40, 56, 63). This model predicts 1,080 copies of pVII and 180 copies of pV, which is 10 to 20% higher than the experimentally determined amounts of pVII and pV in isolated virion DNA (33, 62), suggesting that there are stretches in the viral genome that are lacking pVII and pV. pV not only binds the viral DNA in a sequence-independent manner, it also bridges the DNA core and the capsid by interacting with pVI on the inner side of the major capsid protein hexon (11, 35, 36, 46, 50). Interestingly, a pV-deleted Ad5 gave rise to low levels of viral particles, suggesting that pV was involved in the assembly of infectious virions (60). Mutations in the gene encoding the precursor of pX could compensate for the lack of pV, suggesting redundancy for core organization by molecular adaptation. This is also supported by the notion that pV is specific for mastadenoviruses, which exclusively infect mammals (http://www.vmri.hu/∼harrach/ADENOSEQ.HTM).
Viral infections start with entry, which delivers subviral particles to the cytosol. Invariably, the condensed viral genomes have to be uncoated for infection to proceed (22). The uncoating process of Ad2/5 starts at the plasma membrane, when virion fibers bind their primary receptor, the coxsackievirus Ad receptor (CAR), and alpha v integrin coreceptors bind to penton base, which anchors fiber to the capsid (3, 8, 38, 66). Ad2/5 release their fibers prior to or during endocytosis, although the underlying mechanism is unknown (26, 42). An early step of Ad2/5 uncoating is sensitive to defensins, which bind virions and preclude viral escape from endosomes to the cytosol (44), phenotypically mimicking the fate of the uncoating-impaired and escape-defective Ad2 mutant Ad2-ts1 (21, 30). The cytosolic Ad2/5 capsids traffic on microtubules to the nuclear pore complex (NPC), where they bind to the CAN/Nup214 receptor and release their genome into the nucleus (24). This process is sensitive to the macrolide antibiotic leptomycin B (LMB), which inhibits nuclear protein export and prevents the attachment of incoming virions to the nuclear pore complex (55). The precise composition of the imported DNA is unknown (reviewed in reference 47). It is known, however, that pVII remains with the incoming viral genome in the nucleus during the early infection phase (64, 67). pVII, together with pV, then assembles newly synthesized viral DNA into core structures that are packaged into virions and released upon nuclear disintegration (reviewed in reference 4). Here, we report the generation and initial characterization of a novel adenovirus, which expresses the green fluorescent protein (GFP)-pV fusion protein instead of pV under the control of the endogenous viral promoter. This is the first small DNA tumor virus with a fluorescent DNA core and a full-length genome.
MATERIALS AND METHODS
Construction of Ad2-GFP-pV.
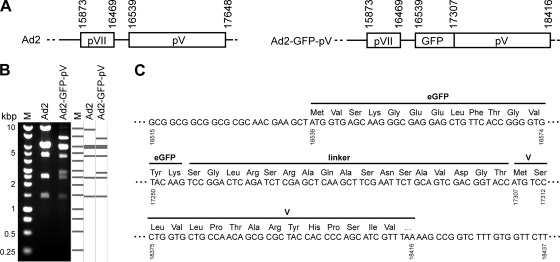
Ad2_BAC53 is derived from Ad2 reference strain adenoid 6 (30). The Ad2-GFP-pV insertion mutant was obtained using exposon mutagenesis as described previously (49) (see Fig. 1). Briefly, in the first step, a minitransposon (Tn) cassette (transprimer-1) was amplified from pGPS1.1 and inserted by ET recombination into BAC53 containing the full-length wild-type genome of Ad2 (30). Synthetic oligonucleotide primers for the insertion of transprimer-1 contained homologies at their 5′ ends to positions 16491 to 16538 (upstream of pV) and 16539 to 16586 (downstream of pV) of the adenoviral genome. The priming sequences for the transprimer-1 cassette of pGPS1.1 were as published (49). Successful insertion of transprimer-1 was examined by restriction analysis and partial sequencing of the insertion sites. To replace the transprimer-1 element with enhanced GFP (eGFP) coding sequences, recombinant bacterial artificial chromosome (BAC) DNA was amplified from two independent clones, and transprimer-1 sequences were excised in vitro using TnsABC (New England Biolabs) in the presence of the acceptor plasmid pST76T. The insertion fragment containing the open reading frame (ORF) of eGFP was obtained as follows. The eGFP gene including a small linker portion was PCR amplified from pEGFP-C1 (Clontech). Priming regions were designed such that the fragment contained positions 613 to 1380 of the plasmid. The 5′ extensions contain the recognition site for SapI, one random base, plus 3 bases identical to the upstream or downstream region of the insertion site. Primer sequences were as follows: upstream primer, 5′-GTC AGC TCT TCC GCT ATG GTG AGC AAG GGC GAG-3′; downstream primer, 5′-CAA GGC TCT TCT CAT GGT ACC GTC GAC TGC AGA ATT C-3′. The SapI-excised insertion fragment was ligated into the TnsABC*-linearized BAC, and the recombinants were recovered by transformation into competent bacteria. Successful replacement of pV by GFP-pV was confirmed by restriction analysis and partial sequencing of the insertion sites. Four independent colonies were chosen and amplified for reconstitution of virus by calcium phosphate transfection of 80% confluent human embryonic retinoblast 911 (HER-911) cells in a 10-cm cell culture dish with 10 μg SnaBI-linearized BAC DNA. Forty-eight hours posttransfection, cells were split 1 to 4, and viruses were harvested from cells and supernatant at the onset of cytopathic effects (passage 1 [p1]) and serially passaged in four 10-cm dishes of A549 cells (p2) and then in 20 10-cm dishes (p3), followed by virus purification from cells. The supernatants were used for further amplification rounds until p7. Viruses (termed Ad2-GFP-pV) from passage numbers less than 8 had normal DNA patterns of restriction enzyme digests.
FIG. 1.
Construction of Ad2-GFP-pV. (A) Schematic overview of the pV and pVII loci of Ad2 (left) and Ad2-GFP-pV (right) with boxed open reading frames for pVII and pV and nucleotide numbers of the starting and terminating nucleotides. (B) XhoI restriction enzyme analysis of genomic DNA isolated from purified Ad2 and Ad2-GFP-pV with an in silico-predicted restriction pattern (right) and molecular size markers (M) in kbp. (C) DNA sequence analysis and derived amino acid sequence at the GFP-pV junction from Ad2-GFP-pV virion DNA with nucleotide numbers. Ellipses (…) indicate places where the sequence is not shown.
Cells, transfection, and antibodies.
HeLa-ATCC and human lung carcinoma A549 cells were purchased from the American Type Culture Collection, Manassas, VA. Ad5-E1-transfected human embryonic retinoblast 911 cells (18) were obtained from S. Hemmi (University of Zurich, Switzerland). Cells were grown as monolayers in Dulbecco's modified Eagle medium (DMEM) supplemented with 10% fetal bovine serum (FBS) (GIBCO-BRL) on Alcian blue-coated glass coverslips (57) or cell culture dishes. Plasmid POM121-mCherry (obtained from Daniel Gerlich, ETH Zurich) was transfected into 50% confluent cells using FuGENE 6 (Roche, Indianapolis, IN) according to the manufacturer's protocol. Mouse anti-GFP was purchased from Roche Diagnostics (Schweiz) AG, Rotkreuz, Switzerland. Rabbit antihexon R70 antiserum was obtained from the late Marshall Horwitz (2). Rabbit anti-protein V serum was obtained from W. C. Russell (University of St. Andrews, United Kingdom) (36) and rabbit anti-protein VII antibody from L. Gerace (Scripps Research Institute, La Jolla, CA). Guinea pig anti-DBP (DNA binding protein) was from W. Deppert (University of Hamburg, Germany). Purified rabbit anti-pV C-term antibody was manufactured by immunizing rabbits with the synthetic peptide RRVAREGGRTLVLPTAR, positions 347 to 363 of Ad2 pV. Serum was harvested, and an enriched IgG fraction was affinity purified on immobilized peptide (Davids Biotechnologie, Regensburg, Germany). All animal work was done in accordance with NIH standards for animal welfare under the animal welfare number A5646-01 and approved by the Animal Care and Use Committee, Office for Environment, Nature and Consumer Protection (Regensburg, Germany).
Amplification, purification, and labeling of viruses.
Ad2 and Ad2-GFP-pV were grown, isolated, and labeled with Atto647 and Atto565 dyes (Atto-tec, Germany) as described previously (25, 43).
Virus quantification.
Virus titers were determined using either 50% tissue culture infective dose (TCID50) or a modified fluorescent focus assay (FFA). In both assays, virus was titrated on HER-911 cells plated on 96-well plates. In the case of TCID50, infection was allowed to proceed for 6 days, while in the FFA, cells were fixed after 4 days. For the calculation of fluorescent focus-forming units per ml (fffu/ml), cells were fixed, quenched, and immunostained for expression of protein V and fluorescent focus units were counted by using a fluorescence microscope. A fluorescent focus was defined as 3 or more adjacent cells expressing protein V or GFP-pV. FFA titers were calculated using the formula of Spearman and Kaerber (53). Protein concentrations of purified viruses were measured using the Micro bicinchoninic acid (BCA) protein assay reagent kit (Pierce, Thermo Fisher Scientific, Switzerland).
E1A measurement.
Fifty-percent-confluent A549 cells in 96-well plates were infected with serial dilutions of 1 μg Ad2 or Ad2-GFP-pV in growth medium for 12, 16, or 20 h. Cells were fixed, immunostained with mouse anti-E1A (27) and goat anti-mouse antibody conjugated to Alexa 594 (1/500), DAPI (4′,6-diamidino-2-phenylindole) stained, and recorded with the Zeiss Axiovert 40 CFL fluorescence microscope using suitable filters. The ratio between E1A-expressing cells and DAPI-positive nuclei was calculated and plotted against the virus dilution. About 150 cells were counted per time point. The experiment was repeated three times, and standard errors of the mean (SEM) were calculated.
One-step growth curves.
About 70% confluent A549 cells in 35-mm cell culture dishes were inoculated with 5 fffu of either Ad2 or Ad2-GFP-pV in a volume of 1 ml RPMI-0.2% bovine serum albumin (BSA) at 4°C on a shaker for 1 h. Cells were washed twice with phosphate-buffered saline (PBS) and incubated in 2 ml of growth medium consisting of DMEM-10% FBS-nonessential amino acids (NEA)-penicillin-streptomycin (PS) at 37°C and 5% CO2 for 0, 3, 12, 24, 48, or 72 h. Supernatant was collected in 2-ml tubes and frozen while cells were broken up in 1 ml medium by freeze-thaw three times, transferred to 2-ml tubes, and supplemented with another milliliter of growth medium. Supernatants and cell lysates were centrifuged and viral titers determined on A549 cells.
Preparation of pyridine cores.
To test if GFP-pV fractionated with the viral core, double-CsCl-gradient-purified Ad2-GFP-pV (or Ad2) virions were dialyzed against 5 mM Tris (pH 8.1), and 50 μg of each virus was supplemented with 16 μl pyridine to 8% (vol/vol), similar to a previously described protocol (16). Samples were incubated at 37°C for 2 h, followed by centrifugation on a 10 to 30% sucrose gradient at 111,000 × g and 4°C for 2 h. Fourteen 160-μl fractions were collected, trichloroacetic acid (TCA) precipitated, and dissolved in 20 μl sample buffer. Fractions 1 to 4, 5 to 8, and 9 to 12 were combined as well as fractions 13 and 14 with the pellet (collectively the pellet fractions) and analyzed on a Coomassie-stained 12% SDS-PAGE gel. From the pellet fractions of Ad2 and Ad2-GFP-pV, Western blots were prepared and immunostained with affinity-purified anti-pV antibody (1:200) and anti-GFP antibody (1:1,000), respectively.
Thermostability assay.
Accessibility of viral DNA from double-CsCl-gradient-purified Ad2 or Ad2-GFP-pV for the DNA intercalating fluorescent dye TOTO-3 iodide (1 mM solution in dimethyl sulfoxide [DMSO]; Invitrogen) with 642/660-nm excitation/emission was measured after heat shock treatment at different temperatures. Specifically, samples containing 5 μg virus diluted in buffer containing 10 mM Tris (pH 8.1), 150 mM NaCl, 1 mM MgCl, and 1 μM TOTO-3 in a total volume of 50 μl were prepared in 1.5-ml Eppendorf tubes on ice, heated at the indicated temperatures (see Fig. 2G) in a heating block for 3 min, and rapidly chilled on ice. The samples were transferred to a 96-well plate, and fluorescence was measured at 642- ± 8-nm (mean ± standard deviation) excitation and 660- ± 9-nm emission with the Tecan Safire II microplate reader.
FIG. 2.
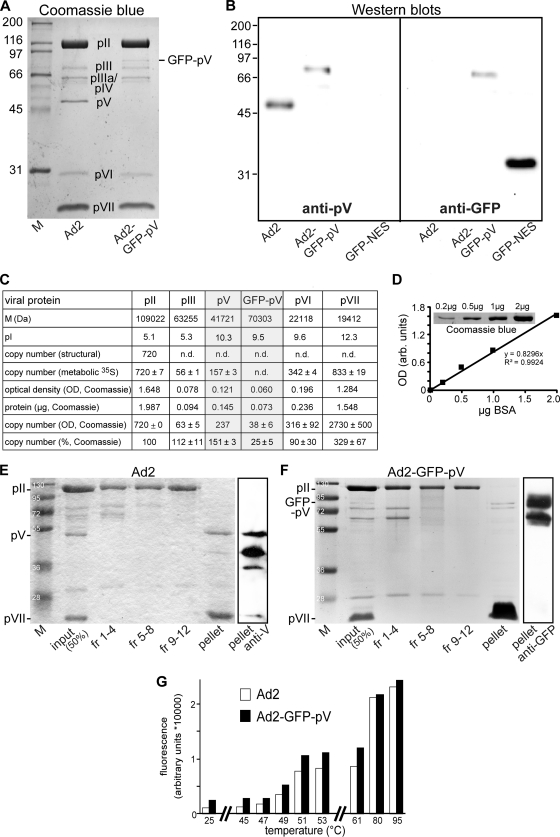
Biochemical characterization of Ad2-GFP-pV. (A) Twelve-percent SDS-PAGE gel stained with Coomassie brilliant blue, including protein marker (M) with relative mass in kDa. Roman numbers denote viral structural proteins. (B) Anti-pV-stained (left) or anti-GFP-stained (right) Western blotting of purified Ad2 and Ad2-GFP-pV and recombinant GFP with a nuclear export sequence (NES). pII, hexon; pIII, penton base; and pIV, fiber. (C) Estimations of copy numbers of viral structural proteins by densitometric analysis of a Coomassie blue-stained SDS-PAGE gel. The table shows calculated molecular mass values (M) for the indicated proteins, the isoelectric point (pI), the copy numbers based on the virus structure (54, 68), the copy numbers estimated by metabolic labeling (62), the measured optical density (OD), the amount of protein based on the BSA standard curve (see panel D, linear regression value, R2 = 0.9924) and the estimated copy numbers. (E and F) Sucrose density gradient-fractionated pyridine-extracted Ad2 or Ad2-GFP-pV, including a pellet (loaded as pellet plus fractions 13 and 14), molecular weight markers (M), and input sample. Gels were stained with Coomassie blue (left) or Western blotted against pV (right). Note that both intact and partially degraded pV and GFP-pV fractionate with the core protein pVII. (G) Purified Ad2 (white bars) and Ad2-GFP-pV (black bars) were heated in the presence of the DNA-intercalating dye TOTO-3, and fluorescence of the DNA-bound dye was analyzed by the Tecan Safire II microplate reader at 642- ± 8-nm excitation and 660- ± 9-nm emission. Results from one of three typical independent experiments are shown.
SDS-PAGE, Western blots, fluorography, and protein quantification.
SDS-PAGE gels were run with a Hoefer minigel device according to the manufacturer's instructions and stained with Coomassie brilliant blue. Pictures were recorded either directly with the Syngene G:BOX gel documentation system (Biolabo Scientific Instruments SA, Chatel-St-Denis, Switzerland) under white-light conditions or scanned after drying on filter paper. A431 human epithelial carcinoma cell lysate was purchased from BD Transduction Laboratories (Lexington, KY). For Western blots, SDS-PAGE gels were electrotransferred in semidry mode onto Millipore Immobilon-PSQ 0.2-μm polyvinylidene difluoride (PVDF) transfer membranes (Milian SA, Geneva, Switzerland) and developed with the Amersham ECL Plus Western blotting detection kit (GE Healthcare Life Sciences, Glattbrugg, Switzerland). Chemiluminescence was recorded either with the Kodak digital science image station 440CF or by exposing the membranes onto Amersham Hyperfilm ECL films (GE Healthcare Life Sciences, Glattbrugg, Switzerland). Fluorography of Atto647-Ad2-GFP-pV after 12% SDS-PAGE was recorded with the Amersham Typhoon 9400 gel scanner by using the 633-nm helium-neon laser.
Protein bands from Ad2 and Ad2-GFP-pV (5 μg each) on Coomassie-stained SDS gels were quantified with the MacBiophotonics ImageJ open source software (W. S. Rasband, ImageJ, U.S. National Institutes of Health, Bethesda, MD; http://rsb.info.nih.gov/ij/). Briefly, a region of interest (ROI) was drawn around the protein band of interest, and the integrated density of the selection was calculated. A background ROI with the same dimensions near the band was chosen, and the integrated density value was subtracted from the protein band ROI. The protein amount was calculated relative to a BSA standard curve using the background-subtracted total intensity of each band. The number of molecules was determined by dividing the protein amount by the theoretical molecular mass of the protein. The copy number of an individual protein per virion was calculated relative to hexon (720 copies per virion). Calculated copy numbers were the means ± SEM of results from three independent experiments. Optical densities shown were derived from the same representative experiment. Molecular masses were given in daltons, and the pI values were calculated with the “Compute pI/Mw tool” (http://www.expasy.ch/tools/pi_tool.html) from the Swiss Institute of Bioinformatics ExPASy Proteomics Server. Sequences used were from the UniProtKB/Swiss-Prot database: P03277 (pII), P03276 (pIII), P03267 (pV), P03274 (pVI), and P68950 (pVII). In the case of precursor proteins, the mature forms of the corresponding proteins were used for calculation. Values for copy numbers (based on structural studies and 35S metabolic labeling) were obtained from the literature (62).
Single-particle fluorescence analysis of Atto647-Ad2-GFP-pV.
Atto647-Ad2-GFP-pV was adsorbed to the bottom of 96-well clear-bottom plates at 20°C for 15 min, washed with PBS, and overlaid with 100 μl fresh PBS. Images were recorded with the automated ImageXpressMICRO fluorescence microscope (Molecular Devices) by using settings for Atto647 and GFP. Images were processed as described in the supplemental material. Briefly, images were corrected for background and aberration, and single virus particles were scored. Average fluorescence intensities within the selected particle areas in the Atto647 and GFP channels were measured. For determination of background threshold, 10 random ROIs which contained no virus particles were chosen using MacBiophotonics ImageJ, and the average fluorescence intensity in the Atto647 or GFP channels was calculated. The background thresholds are represented as blue lines in Fig. 3D. Population statistics were performed with Microsoft Office Excel software. The average intensity per particle (GFP and Atto647) and calculated ratios of average GFP/Atto647 intensities were plotted against the number of particles.
FIG. 3.
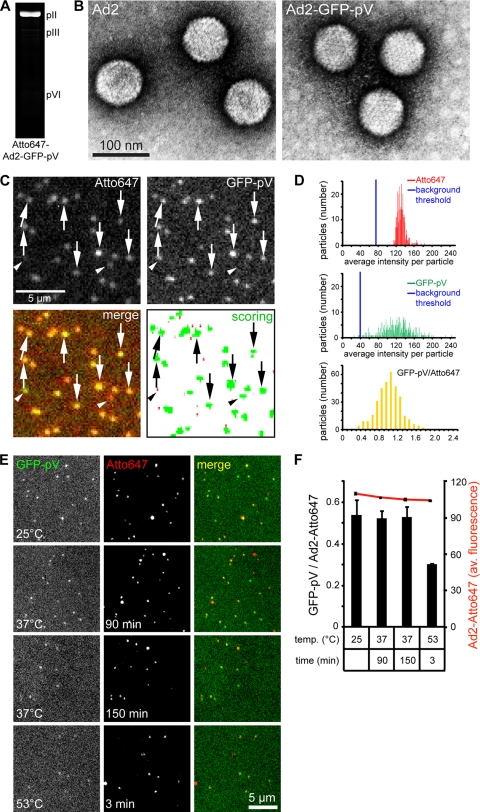
Ad2-GFP-pV particles contain GFP-pV. (A) Fluorogram of Atto647-labeled Ad2-GFP-pV separated by 12% SDS-PAGE and excited by 633 nm light. Positions of pII (hexon), pIII, and pVI are indicated. (B) Transmission-EM analysis of heavy metal (dark precipitates)-stained Ad2 (left) and Ad2-GFP-pV (right) shows monodispersed, intact particles. (C) Fluorescence analysis of Atto647-Ad2-GFP-pV in 96-well clear-bottom imaging plates by using an ImageXpress Micro microscope and 600- to 640-nm (Atto647 channel, top left) and 450- to 480-nm excitation (GFP channel, top right), including merged pseudocolored images (bottom left). The particles scored by the Matlab routine are shown in green, and the size threshold-rejected background puncta are in red. Arrows indicate examples of double-labeled particles, and arrowheads rare examples of single-labeled Atto647 particles. The arrowheads on the left point to a particle which contains GFP-pV but subdetection levels of Atto647. The arrowheads on the right depict a particle that did not incorporate enough GFP-pV to be detected but was labeled with Atto647. The abundance of such particles is shown in the histograms of panel D. (D) Frequency profiles of Ad2-GFP-pV fluorescence showing Atto647 (top), GFP-pV (middle), and merged ratiometric colors (bottom), including background thresholds (blue lines). (E and F) Atto647-Ad2-GFP-pV particles are stable at 37°C. Ratiometric fluorescence analysis of Atto647 and GFP-pV, including absolute values for Atto647 (red line in panel F), was conducted as described for panel C, albeit with different illumination settings. Representative images are shown for both channels (E), including the merged images and plots in panel F (number of experiments = 2).
Kinetics of GFP-pV release and pVII epitope exposure of Atto647-Ad2-GFP-pV particles during infection.
HER-911 cells were seeded to 60% confluence onto Alcian blue-coated coverslips in 24-well cell culture dishes overnight. Growth medium was replaced by serum-free medium, and cells were starved overnight to reduce cell background. Cells were infected with 0.1 μg/ml Atto647-Ad2-GFP-pV at 37°C and 5% CO2 for 10 min, washed briefly, and supplemented with 0.5 ml serum-free medium. Zero-minute samples were immediately fixed with 3% paraformaldehyde (PFA) in PBS for 15 min, washed and quenched for 10 min with 25 mM NH4Cl in PBS, and permeabilized with 0.5% Triton X-100 in PBS for 10 min. Other samples were allowed to proceed for 30, 90, 150, or 240 min after the addition of virus. Cells were blocked with 20% goat serum and stained against pVII with preadsorbed anti-pVII/Alexa 594 goat anti-rabbit antibody and DAPI. Images were recorded on the same day with an inverted Leica SP5 single-point confocal microscope (Leica Microsystems, Switzerland) equipped with a 63× (oil immersion; numerical aperture [NA], 1.4) objective. Excitations were at 405 nm (DAPI), 488 nm (GFP), 594 nm (pVII), and 633 nm (Atto647). Individual stacks were recorded at 0.21-μm intervals using 10× accumulation and 4× averaging. Maximum projections were generated with MacBiophotonics ImageJ. A Matlab-based routine (see the supplemental material for details) was used to score individual viral particles and measure average fluorescence intensities in the particle areas from the Atto647 (capsid), GFP (GFP-pV), or Alexa 594 (pVII) channels. Threshold values for fluorescence intensities were obtained by subtracting the average intensity of the entire image, calculated using MacBiophotonics ImageJ, from individual average intensities of single virus particles. Statistics were performed with Microsoft Office Excel. The total numbers of scored particles and average fluorescence intensities in the Atto647 channel (capsid) were plotted against time. Average GFP fluorescence intensities in scored (Atto647) particles were plotted against time as well as GFP/Atto647 average fluorescence ratios of single particles. The population of particles with pVII intensities over the threshold (Atto647 and pVII-positive Ad2) was determined, and the ratio of this population relative to the total amount of scored (Atto647) particles was plotted against time. From the same population, average pVII fluorescence intensities were calculated and plotted against time, or average GFP fluorescence intensities were calculated and plotted against time.
GFP-pV dissociation from Ad2-GFP-pV.
HER-911 cells were plated on 96-well clear-bottom plates to 30% confluence in 75 μl DMEM-10% FBS-1% NEA-1% PS plus 25 μl Opti-MEM and incubated for 3 days at 37°C and 5% CO2. For background controls, medium was added to wells containing no cells. Cells were supplemented with 10 μl LMB dissolved in DMEM-0.2% BSA-1% PS to a final concentration of 20 nM or were mock treated 1 h prior to infection. LMB was present during the whole experiment. Atto647-labeled Ad2-GFP-pV (0.125 μg, centrifuged for 10 min at 10,000 rpm in an Eppendorf 5415 R centrifuge at 4°C prior to use) was added to 10 μl DMEM-0.2% BSA-1% PS for 15 min. Medium was removed, and fresh DMEM-0.2% BSA-1% PS was added. Thirty or 150 min postinfection (p.i.), 25 μl 16% PFA in PBS was added for 10 min and cells were washed two times with PBS and quenched with 25 mM NH4Cl in PBS for 10 min, followed by another washing step and treatment with 0.5% Triton X-100 in PBS containing 0.5 μg/ml DAPI for 10 min. Cells were then washed extensively, and 100 μl PBS-N3 was added prior to recording.
Fluorescence was recorded with the automated ImageXpressMICRO fluorescence microscope (Molecular Devices) by using a Nikon 40× air objective 0.95-NA instrument, Semrock BrightLine filters (GFP-3035B-NTE-ZERO, Cy5-4040A-NTE-ZERO, and DAPI-5060B-NTE-ZERO), and the Molecular Devices MetaXpress 2 software. Nine individual regions per well were recorded as stacks comprised of 9 sections with a z distance of 1 μm, and images were saved as 16-bit TIFs. Illumination times were 6 s for GFP, 8 s for Atto647, and 5 ms for DAPI without binning. Images were processed as described in the supplemental material. Briefly, images were corrected for background and aberration. Maximum projections were generated, and single viral particles were scored in the Atto647 channel. Average fluorescence intensities in selected particle areas in the GFP and Atto647 channels were determined, and GFP/Atto647 intensity ratios were calculated for all scored particles individually. Average GFP/Atto647 intensities were plotted against time, and statistics, including SEM (calculated from results from 9 regions), were performed with Microsoft Office Excel.
Localization of GFP-pV and pV relative to DBP and characterization of the anti-pV antibody.
HeLa-ATCC cells were infected with Ad2 or Ad2-GFP-pV at a multiplicity of infection (MOI) of 2 for 20 h or left noninfected. They were fixed, quenched, Triton X-100 treated, and blocked for 1 h with 20% goat serum in PBS. DNA binding protein (DBP) was immunostained with a guinea pig anti-DBP antibody, pV with an affinity purified rabbit anti-pV antibody, and the cell nucleus with DAPI. Purified Ad2 or Ad2-ts1 and cell lysates from Ad2-infected cells (3, 18, and 30 h) or noninfected HeLa-ATCC cells grown on cell culture dishes were fractionated by 12% SDS-PAGE, blotted, and stained with affinity purified rabbit anti-pV antibody followed by staining with goat anti-rabbit antibody conjugated to horseradish peroxidase (HRP).
RESULTS
Genetic construction and reconstitution of Ad2-GFP-pV.
We generated recombinant Ad2 genomic DNA with an N-terminally eGFP-tagged core protein V (GFP-pV) using exposon mutagenesis of Ad2_BAC53, yielding Ad2-GFP-pV (Fig. 1A and B). The resulting bacterial artificial chromosome (BAC) DNA had the expected in silico-predicted restriction fragments and correct sequence between GFP and pV (Fig. 1C and data not shown). Linearized BAC_Ad2-GFP-pV DNA was transfected into HER-911 cells, and infectious particles were serially expanded in A549 cells through about 5 passages and purified by double CsCl density gradient as described previously (26). XhoI restriction enzyme digests of DNA from these particles yielded the expected fragments (Fig. 1B). This suggested that Ad2-GFP-pV was stable for at least 5 passages. At passage numbers higher than 10, loss of GFP-pV expression by Ad2-GFP-pV was, however, observed, and this coincided with genetic alterations in the pV locus (not shown).
Ad2-GFP-pV particles contain GFP-pV and are infectious.
We next analyzed the protein composition of CsCl gradient-purified Ad2-GFP-pV. SDS-PAGE and Coomassie blue analyses indicated that Ad2-GFP-pV had a protein band of about 75 kDa, which was absent in Ad2, and lacked a prominent band at about 48 kDa (Fig. 2A). Both of these bands were immunostained by an anti-pV antibody in Western blots, but only the 75-kDa band of Ad2-GFP-pV also reacted with an anti-GFP antibody (Fig. 2B). This corresponded well with the calculated mass for this fusion protein, which is 70.303 kDa (Fig. 2C). The other major structural proteins of Ad2-GFP-pV and Ad2 were normal in SDS-PAGE (Fig. 2A). The relative abundance of the viral structural proteins was estimated by densitometry using Coomassie blue-stained protein II (hexon; pI = 5.1) as an internal reference and bovine serum albumin (BSA; pI = 5.8; http://expasy.org/tools/) as a calibration standard (Fig. 2C and D). Each virion contains 720 copies of hexon, as indicated by structural and metabolic labeling analyses (54, 62). In our Coomassie blue analyses, we found 63 ± 5 copies of pIII (penton base; pI = 5.3; expected copy number, 60) and 316 ± 92 copies of pVI (pI = 9.6; expected copy number, 360) per virion, which agree well with the expected values. The copy numbers of pVII and pV had been estimated by biochemical assays or reversed-phase high-performance liquid chromatography to be 833 ± 33 or 633 ± 59 for pVII and 157 ± 1 or 170 ± 15 for pV (33, 62). The copy numbers of basic proteins pV (pI = 10.3) and pVII (pI = 12.3; expected copy number, 833) were overestimated by factors of 1.5 and 3.3, respectively, compared to those for metabolic labeling (62). This was expected from the fact that Coomassie blue attaches better to highly positively charged proteins than to neutral proteins (58). Coomassie blue analyses indicated 38 ± 6 copies of GFP-pV (pI = 9.5) per virion, which is about 25% of the pV levels in Ad2. Importantly, both GFP-pV and Ad2 pV segregated with the viral DNA core in pyridine-disrupted virions fractionated in sucrose density gradients, although we noticed some proteolysis in both of the pelleted core fractions (Fig. 2E and F).
Since pV links the viral DNA to the inside wall of the capsid (36), we determined the thermostability of Ad2-GFP-V particles by spectrofluorometric measurements of the binding of the DNA-intercalating dye TOTO-3 to isolated virions (Fig. 2G). TOTO-3 binding to both Ad2-GFP-pV and Ad2 was constant, in the range of 25° to 47°C, and sharply increased from 47 to 51°C and reached a plateau at about 60°C. However, about 10 to 15% of the Ad2-GFP-pV particles bound the dye at 25°C, indicative of defective particles in the preparation, which could in part explain the 15 to 20% of the Ad2-GFP-pV particles which bound to cells but did not endocytose (see Fig. 4A).
FIG. 4.
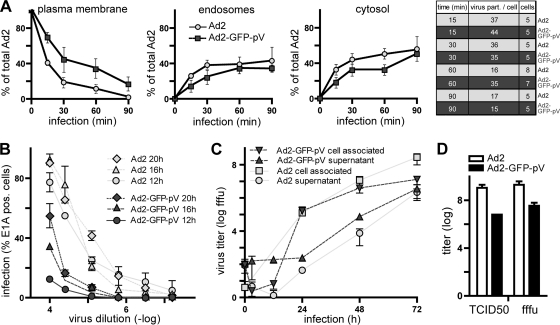
Growth of Ad2-GFP-pV. (A) Quantitative EM analysis of Ad2 and Ad2-GFP-pV entry into HeLa-ATCC cells, scoring virus particles at the plasma membrane (left), endosomes (middle), and the cytosol (right), was performed as published (31). Note that 15 to 20% of the Ad2-GFP-pV particles are not internalized at 90 min p.i. Data points show the means ± SEM of virus particle numbers from the indicated number of cells (see table). (B) E1A expression immunofluorescence analysis of 1.5 × 10⁴ A549 cells per condition infected with serial dilutions of 1 μg of Ad2 or Ad2-GFP-pV (1 μg is approximately 3 × 10⁹ particles). Each point represents the mean ± SEM of results from three independent measurements. (C) Multiround growth curves of Ad2 and Ad2-GFP-pV in A549 cells infected with 5 fluorescent focus forming units (fffu) per cell and fffu titers of cell-associated or supernatant virus shown at the indicated time points as the means ± SEM of results from three experiments. (D) Endpoint titers of Ad2 and Ad2-GFP-pV measured as 50% tissue culture infectious dose (TCID50) units or fffu in HER-911 cells, with SEM from four independent experiments.
Ad2-GFP-pV enters cells but is attenuated at particle production.
To track the incoming GFP-pV, we isolated Ad2-GFP-pV particles and labeled the capsids with the fluorophore Atto647 according to previously established protocols (57). The Atto647 dye was found to be specifically incorporated into the major capsid protein hexon, as indicated by fluorography of SDS-PAGE-fractionated virions (Fig. 3A). Purified Ad2-GFP-pV virions labeled with red Atto fluorophores retained their full infectivity compared to the nonlabeled virions (not shown). Both Atto647-Ad2-GFP-pV and Ad2 were monodisperse, as shown by negative-stain electron microscopy (EM) (Fig. 3B). Dual-color fluorescence microscopy indicated that most of the Atto647-Ad2-GFP-pV particles were positive for both colors (Fig. 3C, arrows), with Gaussian distributions for both colors, indicating the presence of a single species of dual-colored particles (Fig. 3D). Nonlabeled Ad2 or Ad2-GFP-pV gave no signals in the red and green channels or red channel, respectively, indicating specificity of detection (data not shown). Importantly, the Atto647-Ad2-GFP-pV particles were stable in PBS at 37°C up to 150 min, indicating that these particles were suitable for analyses of entry into cells (Fig. 3E and F). Interestingly, Atto647-Ad2-GFP-pV particles lost about 50% of GFP-pV upon a short incubation at 53°C, which was, however, not due to thermal GFP denaturation as shown before (1). The loss of GFP-pV correlated with a sharp increase in DNA accessibility at 51°C and represented rupture of particles (Fig. 2G).
Entry of Ad2-GFP-pV particles into HeLa-ATCC cells was analyzed by transmission EM. Viral particle counts at the plasma membrane, endosomes, and cytosol indicated that Ad2-GFP-pV endocytosis occurred with kinetics similar to those of wild-type Ad2 endocytosis, although 15 to 20% of the Ad2-GFP-pV particles were not endocytosis competent (Fig. 4A). At 90 min p.i., about 50% of the Ad2-GFP-pV particles were in the cytosol, 30% in endosomes, and 20% at the plasma membrane. Endosomal escape of Ad2-GFP-pV was confirmed by fluid phase marker dextran-fluorescein isothiocyanate (FITC) (10 kDa) uptake, showing that Ad2-GFP-pV infection triggered not only dextran uptake but also release to the cytosol and the nucleoplasm, similar to Ad2 infection (37) (data not shown).
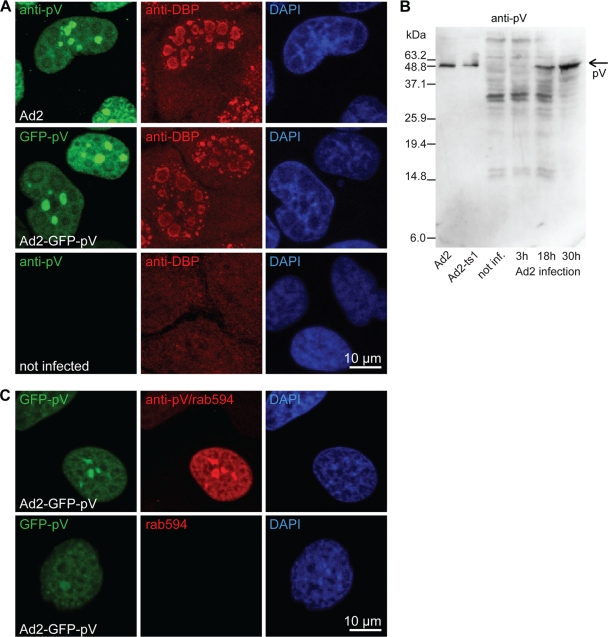
Compared to Ad2, Ad2-GFP-pV was delayed in expressing the immediate-early transactivator E1A (Fig. 4B). This was more pronounced at 12 h than 20 h p.i., suggesting that Ad2-GFP-pV could compensate a defect with time, consistent with the notion that Ad2-GFP-pV had a lower infectious particle-to-particle ratio than Ad2. In lung epithelial A549 cells, Ad2-GFP-pV gave 10- to 100-fold-lower yields of cell-associated infectious particles than Ad2, although the amounts of cell-free infectious units were similar to those of Ad2 at 72 h p.i. (Fig. 4C). These results were confirmed by measurements of 50% tissue culture infectious dose (TCID50) and fluorescent focus forming units (fffu) (Fig. 4D). We speculate that Ad2-GFP-pV is slightly impaired at particle assembly. Importantly, both newly synthesized GFP-pV and pV were found in similar subnuclear structures lacking the viral DNA binding protein (DBP) (Fig. 5A), as indicated by an anti-pV polyclonal antibody (Fig. 5B and C).
FIG. 5.
Anti-pV antibody detects subcellular GFP-pV from Ad2-GFP-pV that is similar to pV from Ad2. (A) HeLa-ATCC cells were infected or not infected with Ad2 or Ad2-GFP-pV at an MOI of 2 for 20 h, fixed, and stained for the viral DNA binding protein (DBP) and the nucleus (DAPI) or with an affinity-purified rabbit anti-pV antibody. Note that GFP-pV and pV are both excluded from DBP-positive areas. (B) Purified Ad2 or Ad2-ts1 and cell lysates from Ad2-infected or noninfected (not inf.) cells were fractionated by 12% SDS-PAGE, blotted, and stained with affinity purified rabbit anti-pV antibody followed by staining with goat anti-rabbit antibody conjugated to horseradish peroxidase. The specific anti-pV band is indicated with an arrow. The other bands on this blot are unrelated to pV and are due to cross-reactivity of the secondary antibody. (C) HeLa-ATCC cells were infected with Ad2-GFP-pV for 20 h and stained with anti-pV antibody and Alexa 594-conjugated goat anti-rabbit antibody (rab594) or only with secondary Alexa 594-conjugated goat anti-rabbit antibody and with DAPI. Note the extensive overlap of the GFP-pV signal with the anti-pV antibody stain.
GFP-pV dissociates from Ad2-GFP-pV particles during entry.
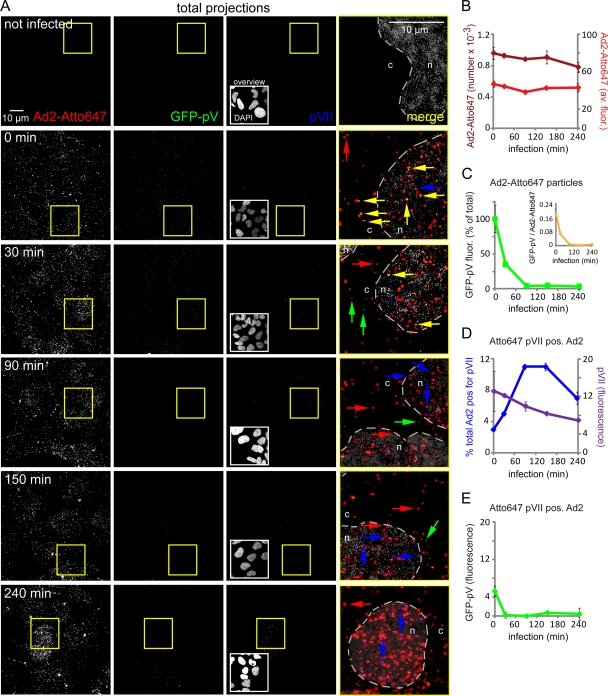
We next analyzed entry of Ad2-GFP-pV and the major core protein pVII into cells in live and fixed cells. Spinning-disc confocal microscopy indicated progressive attachment of dual-color Atto565-labeled Ad2-GFP-pV to the periphery of HER-911 cells (see Fig. S1 and Movie S1 in the supplemental material). The number and average intensity of the Atto647-labeled capsid (representing hexon; see Fig. 3A) remained approximately constant from 0 until 240 min p.i., indicating that incoming virions were neither degraded nor released from the cells, consistent with earlier findings (Fig. 6A and B) (25, 59).
FIG. 6.
Fluorescence microscopy reveals progressive loss of GFP-pV from incoming Ad2-GFP-pV before nuclear import of pVII. (A) Total projections of entire stacks from confocal fluorescence microscopy images of Atto647-Ad2-GFP-pV-infected HER-911 cells depict progressive loss of GFP-pV from capsids of quadruply merged channels and stippled outlines of the nuclei (n) and the cytoplasm (c). The yellow frames indicate the enlarged areas in the fourth column. Yellow arrows, Atto647/GFP-pV double-positive particles; red arrows, Atto647-positive particles; green arrows, GFP-pV particles; and blue arrows, Atto647/pVII double-positive particles. Note that the arrows at 0 min p.i. denote Atto647 plus pV (yellow) and pVII (blue) signals outside the cell. Due to the green fluorescent background of the cell, the GFP-pV signal was thresholded (see Materials and Methods), which reduced its apparent intensity. The DAPI inserts in column 3 (overviews) represent the entire fields shown in columns 1 to 3. Number of experiments, 2. (B) Quantification of the total number of scored particles (light red) and the average Atto647 fluorescence per particle (dark red). (C) Average GFP fluorescence per scored particle (green) and ratio of average GFP/Atto647 fluorescence (yellow). (D) Quantification of pVII-positive Atto647 particles (blue) and average fluorescence intensity of pVII in Atto647 particles (violet). (E) Average GFP-pV fluorescence of pVII-positive Atto647 particles.
In contrast to the Atto647 fluorescence of the main capsid protein hexon, the GFP-pV fluorescence of Atto647-labeled virions dropped in a two-step process. A rapid loss to about 35% of the original value was seen at 30 min p.i., and the remaining GFP-pV disappeared at a slower rate to almost background levels at 90 min p.i. (Fig. 6A, column 2, and B and C). Individual GFP-pV puncta distinct from capsids were occasionally found at 30 min p.i. but not at 0 min p.i., suggesting that GFP-pV separated or was degraded from capsids during cell binding, endocytosis, or escape from endosomes. The cytoplasmic GFP-pV puncta were not stained with an anti-pVII antibody (Fig. 6A), although this antibody detected a small percentage of cell-bound Ad2-GFP-pV at 0 min p.i. (Fig. 6D), suggesting that these surface-bound capsids, but not the intracellular GFP-pV puncta, contained viral DNA. We speculate that the pVII-positive particles at 0 min p.i. (Fig. 6A) belong to the 10 to 15% DNA dye-positive Ad2-GFP-pV particles detected in the virus inoculum (Fig. 2G). The pVII-positive particles were faintly positive for GFP-pV at 0 min but not 30 min p.i., suggesting that GFP-pV disappeared from the broken particles (Fig. 6E).
In addition, the average pVII fluorescence of the Atto647 capsid population steadily decreased from 0 to 240 min p.i., suggesting that pVII is lost in a single phase (Fig. 6D), in contrast to GFP-pV, which dissociates in two phases. Remarkably, the number of pVII-positive Atto647 capsids transiently increased to about 11% at 90 min and decreased again after 150 min p.i. (Fig. 6D), consistent with the ongoing nuclear import of viral genomes. Many of the strongly pVII-positive puncta at the late time points (90 to 240 min p.i.) were in the nuclear area, often lacking Atto647 fluorescence (Fig. 6A, column 4), suggesting that these pVII puncta represented uncoated genomes (23). Since incoming pVII but not capsids is delivered into the nucleus 1 to 3 h p.i. (23, 55, 67) and pVII is released from the viral DNA in the nucleus by ongoing transcription (12), our data suggest that the nuclear pVII puncta represent infectious incoming genomes, in agreement with recent analyses (64). Remarkably, we did not find GFP-pV on pVII-positive puncta in the nucleus, suggesting that it was lost prior to or during nuclear import of the viral genome.
The second step of GFP-pV dissociation is revealed by the treatment of cells with leptomycin B.
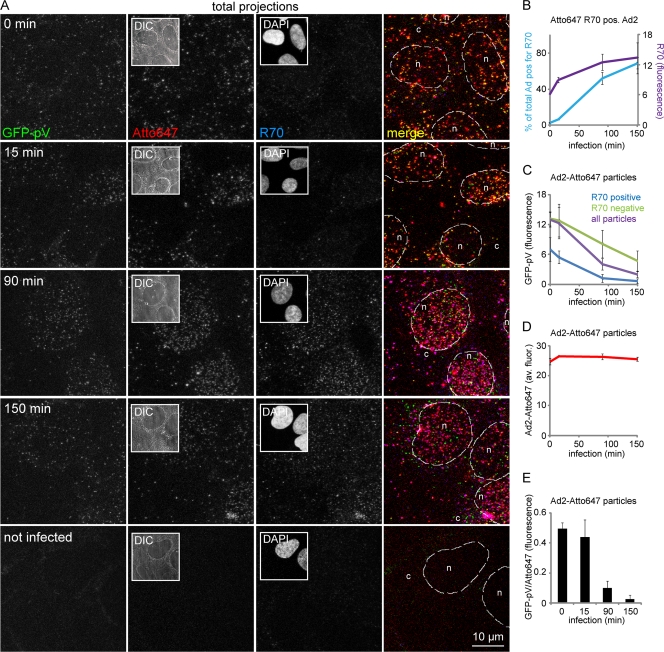
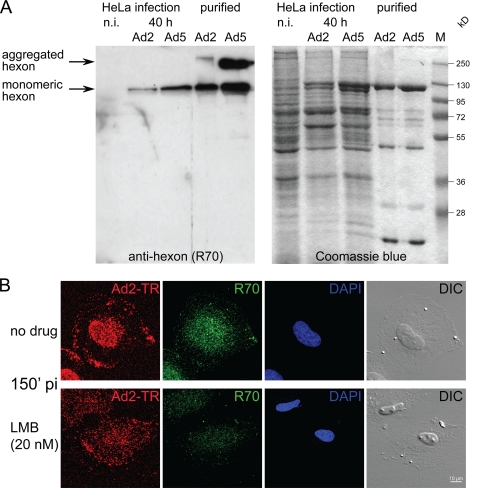
We noticed that the loss of GFP-pV from capsids correlated with increased capsid staining by the polyclonal antihexon antibody R70 from 0 to 150 min p.i. as indicated by confocal microscopy and quantifications of R70-positive particles (Fig. 7A, B, and E). The R70-positive particles had significantly smaller amounts of GFP-pV than the R70-negative particles (Fig. 7C), while the overall number of particles remained fairly constant (Fig. 7D), indicating that loss of GFP-pV correlated with increased R70 epitopes. R70 preferentially labels the hexon protein of disassembled virus particles (59). This was confirmed by Western blotting, where R70 reacted with newly synthesized SDS-denatured monomeric hexon and monomeric and aggregated hexon from Ad2 and Ad5 particles (Fig. 8A). By immunofluorescence analyses, R70 recognized hexon from Ad2-infected control HeLa cells but not Ad2-infected cells treated with the nuclear export inhibitor leptomycin B (LMB) (see Fig. 8B). LMB confines the incoming Ad2/5 particles to the cytoplasm of HeLa cells or blocks them at the microtubule-organizing center (MTOC) in other cell types, such as HER-911 cells, and prevents Ad2/5 attachment to the nuclear pore complex and nuclear import of pVII (Fig. 8B) (55). This suggested that R70 epitopes, and hence the second step of GFP-pV dissociation, depend on virus contact with the nuclear pore complex, which is the site where capsids disassemble and release the DNA (59).
FIG. 7.
R70 disassembly marker-positive capsids lack GFP-pV. (A) Atto647-labeled Ad2-GFP-pV particles were internalized into HER-911 cells for the indicated times, fixed, and stained with the rabbit antihexon R70 antibody and secondary anti-rabbit Alexa 594-conjugated antibody to detect preferentially disassembled capsids. The images in each row are from the same corresponding field. Downsized differential interference (DIC) and DAPI images are shown in columns 2 and 3, respectively. Scale bar, 10 μm. (B) Quantification of R70-positive capsids and overall R70 fluorescence; (C) GFP-pV in R70-positive and -negative capsids; (D) Atto647 intensity as a function of infection time; (E) GFP-pV/Atto647 fluorescence ratios at different times of infection demonstrate progressive loss of GFP-pV from the capsids.
FIG. 8.
Characterization of the antihexon R70 antibody. (A) Western blot from denaturing SDS-polyacrylamide gels containing boiled and disulfide-reduced lysates of noninfected (n.i.) cells, Ad2- or Ad5-infected cells 40 h p.i., and purified Ad2 and Ad5 particles stained with the rabbit polyclonal antibody R70 (1:200), followed by goat anti-rabbit antibody conjugated to horseradish peroxidase (HRP) and ECL detection of HRP (left), with the corresponding Coomassie blue-stained gel including molecular mass markers. (B) Periphery-localized Ad2-TR (Texas red) particles in LMB-treated cells are negative for R70 staining. HeLa cells treated with 20 nM LMB or nontreated cells were infected with Ad2-TR for 150 min, fixed, and stained for disassembled capsids with the R70 antihexon antibody (green), including DAPI signal for cell nuclei and differential interference contrast (DIC). Total projections of confocal stacks are shown for virus and R70 channels.
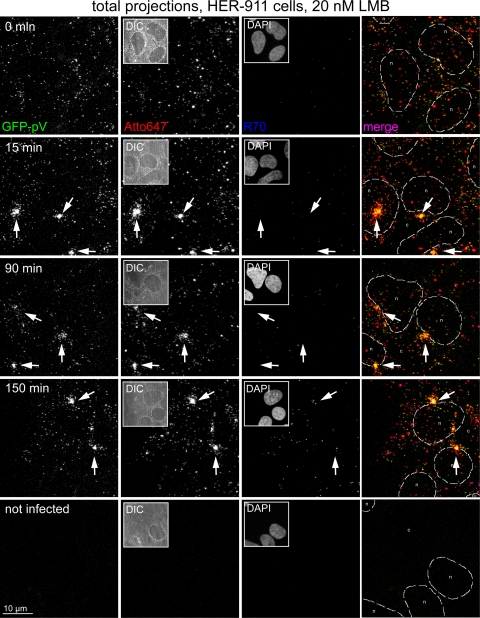
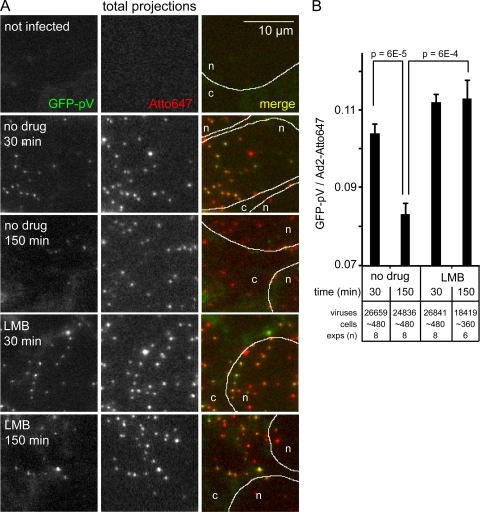
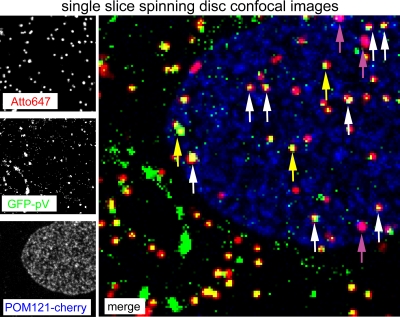
This notion was confirmed by confocal microscopy of LMB-treated HER-911 cells infected with Atto647-labeled Ad2-GFP-pV (Fig. 9). As expected, the particles readily enriched at a perinuclear spot, which was identified as the MTOC by gamma-tubulin staining (not shown) (55) from 15 min up to 150 min p.i. These perinuclear viruses were strongly positive for GFP-pV but did not contain R70 epitopes, indicating that they were not disassembled but contained DNA cores. Likewise, LMB treatment of HeLa cells blocked the dissociation of GFP-pV as indicated by ratiometric analyses of GFP-pV/Atto647 fluorescence in image stacks (Fig. 10). These images were recorded by automated fluorescence microscopy at constant illumination and with chromatic aberration corrections (see Fig. S2 in the supplemental material). The analyses showed that the GFP-pV/Atto647 ratio was 0.105 at 30 min p.i. and dropped to 0.085 at 150 min p.i., close to background levels (Fig. 10 and data not shown). At 0 min p.i., it was approximately 0.2, which closely matched the ratio of GFP-pV/Atto647 determined by single-slice confocal microscopy (see Fig. 6C, insert). The GFP-pV/Atto647 ratio at 150 min p.i. but not 30 min p.i. was largely and significantly increased by LMB (Fig. 10B), showing that the second step of GFP-pV loss is affected by LMB. LMB blocks virus attachment at the nuclear pore complex (55), which suggests that the second step of GFP-pV loss requires virus contact with the nuclear pore complex. This notion was corroborated by the detection of Atto647-Ad2-GFP-pV particles in single-slice confocal micrographs in close proximity of POM121-mCherry-labeled nuclear pore complexes (15) (Fig. 11, white arrows). Together, these results show that the early detachment of GFP-pV occurs before or shortly after virus penetration into the cytosol, while the second step takes place at the nuclear membrane, presumably the nuclear pore complex. The Ad2-GFP-pV is hence a novel tool to analyze distinct steps of capsid uncoating.
FIG. 9.
LMB blocks nuclear targeting of Ad2-GFP-pV and reduces R70 epitopes and loss of GFP-pV. The experiment was carried out as described in Fig. 6, except that the HER-911 cells were pretreated with 20 nM LMB 30 min prior to and during infection with Ad2-GFP-pV. Note the clustering of GFP-pV-positive particles at a distinct perinuclear site, the MTOC (white arrows), identified by anti-gamma-tubulin staining (not shown).
FIG. 10.
LMB blocks the second phase of GFP-pV loss from capsids. (A) HER-911 cells on 96-well plates were infected with Atto647-Ad2-GFP-pV and analyzed by fluorescence imaging using the automated ImageXpressMICRO fluorescence microscope for GFP-pV, Atto647 fluorescence, and the merged pseudocolored images, including the periphery of the nuclei (n) determined by DAPI staining and the cytoplasm (c) (white lines and data not shown). (B) GFP-pV quantification of the scored Atto647 particles, including total numbers of analyzed viral particles and cells and numbers of experiments (exps), with error bars representing SEM and P values from Student's t tests.
FIG. 11.
Localization of Atto647-Ad2-GFP-pV capsids near nuclear pore complexes. POM121-mCherry-transfected HER-911 cells were infected with Atto647-Ad2-GFP-pV and live imaged with spinning-disc confocal microscopy with the focus near the bottom of the nucleus at 60 min p.i. The left panel shows images recoded in the Atto647, GFP, and cherry channels. Merged images are shown in pseudocolors in the right panel, where red represents Atto647-labeled Ad2, green represents GFP-pV, and blue represents POM121-mCherry. White arrows point to triple-positive particles (red, green, blue), yellow arrows point to red and green double-positive particles, and magenta arrows point to red and blue double-positive particles.
DISCUSSION
Imaging the subcellular localizations of viral DNA, RNA, proteins, or particles at high resolution has greatly advanced concepts in molecular virology and cell biology. It has been significantly enhanced by the labeling of viruses with chemical fluorophores or fluorescent proteins (reviewed in references 6, 8, and 24). For adenoviruses, GFP had been fused to the capsid-stabilizing protein pIX (240 copies per virion) (51), and purified virions were observed at the plasma membrane and the cytoplasm (39). In addition, adenoviruses encoding either pV-GFP or pre-pVII-GFP and a dual-color Ad5 with pIX-RFP (red fluorescent protein) and pV-GFP were also reported (32, 61). The utility of these viruses was, however, limited. Both pre-pVII-GFP and pV-GFP were expressed from an artificial promoter in the deleted E3 region of the genome, while endogenous pre-pVII and pV were also expressed, which resulted in low incorporation of pV-GFP in virus particles (61). In addition, the pV-GFP-expressing Ad5 stocks contained significant amounts of disrupted virions (32). The pIX-RFP/pV-GFP-labeled virions on the other hand were heterogeneous with respect to green and red fluorescence, and it remained unknown how these viruses enter or exit cells.
Our detailed entry studies here reveal two new phases of virus uncoating. The first phase is the loss of a large fraction of GFP-pV from the particles at 30 min p.i., when the majority of endocytosis-competent Ad2-GFP-pV has arrived in the cytosol (Fig. 6C). We suggest that this early loss of GFP-pV coincides with structural changes of the capsid, such as the loss of fibers and pentons or capsid-stabilizing proteins IIIa and VIII (17, 26, 42, 50). We assume that these disassembly steps occur in most of the entry-competent Ad2-GFP-pV, as shown for Ad2 before (26). Biochemical experiments and cross-linking studies have suggested that pV attaches the viral DNA to the capsid possibly via pVI (11, 36). pVI has recently been assigned to hexon cavities inside the capsid (46, 52), but precisely how the 360 copies of pVI are arranged within the capsid is unknown. Intriguingly, unassigned structures around the 5-fold symmetry of the vertices projecting toward the DNA core have been detected in cryo-EM studies, and these structures have been tentatively assigned to pVI (17, 54). Since dimers of pVI bind pV in biochemical assays, it is possible that pV acts as a DNA organizer near the vertices. pV could be released when penton base or fibers detach from the capsid, either together or separately from pVI and penton base.
The second novel phase for adenovirus uncoating identified here is that about 30% of GFP-pV dissociates from the cytoplasmic particles in the absence of LMB, because LMB blocked the release of 30% of the GFP-pV from cytoplasmic particles (Fig. 6). LMB blocks the attachment of incoming Ad2/5 to the nuclear pore complex and inhibits capsid disintegration (55), consistent with a key role of the nuclear pore complex in the final step of capsid disassembly (59). This suggests that, in addition to linking the viral DNA to the capsid, pV functions in core assembly and organization in close contact with the virion DNA, as supported by UV cross-linking and fractionation studies (7, 10, 16).
Remarkably, the nucleus did not contain GFP-pV (Fig. 6), as reported for wild-type pV (29, 32). The absence of pV or GFP-pV on the viral cores in the nucleus is not surprising, since earlier studies showed that the viral DNA and pVII alone can be a template for replication and transcription without pV (9, 28, 67). Possibly, posttranslational modifications of the viral core proteins pV and pVII, such as ADP-ribosylation, phosphorylation, or acetylation, facilitate a relaxation of the core and thereby aid the detachment of DNA from the capsid (14, 20, 65).
In summary, Ad2-GFP-pV is the first fluorescent DNA core-labeled small DNA tumor virus carrying a full-length genome. It has an estimated number of 38 GFP-pV copies per virion compared to 157 to 170 copies of pV in the wild-type Ad2 (33, 62), and Ad2-GFP-pV is monodisperse. This allows the use of Ad2-GFP-pV as a point source of defined fluorescence for quantitative analyses of GFP in live cell microscopy experiments. Ad2-GFP-pV is also a novel tool to measure viral DNA uncoating and in future experiments can provide insights into viral spreading dynamics within organisms in disease and therapy.
Supplementary Material
Acknowledgments
We thank Karin Boucke for providing EM support, Nicola Imelli for control experiments measuring dextran uptake, Silvio Hemmi for helpful discussions, and Maarit Suomalainen for comments on the manuscript.
Funding was provided by the National Science Foundation to U.F.G. (grants 3100A-110013 and 31003A-125477/1) and Kanton Zurich. The funders had no role in the study design, data collection and analysis, decision to publish, or preparation of the manuscript.
There are no competing interests.
D.P. carried out the reverse genetics experiments, the biochemical and virological characterizations, and the fluorescence microscopy. M.F.E. wrote the MatLab code for single-particle analyses and helped with data analyses. Z.R. helped with the design of the reverse genetics experiments. C.W. performed the experiment shown in Fig. 8A, S.S. performed the immunofluorescence experiment shown in Fig. 8B, and U.F.G. designed and coordinated the study and wrote the manuscript. All authors read and approved the final manuscript.
Footnotes
Published ahead of print on 3 November 2010.
Supplemental material for this article may be found at http://jvi.asm.org/.
REFERENCES
- 1.Alkaabi, K. M., A. Yafea, and S. S. Ashraf. 2005. Effect of pH on thermal- and chemical-induced denaturation of GFP. Appl. Biochem. Biotechnol. 126:149-156. [DOI] [PubMed] [Google Scholar]
- 2.Baum, S. G., M. S. Horwitz, and J. J. V. Maizel. 1972. Studies of the mechanism of enhancement of human adenovirus infection in monkey cells by simian virus 40. J. Virol. 10:211-219. [DOI] [PMC free article] [PubMed] [Google Scholar]
- 3.Bergelson, J. M., J. A. Cunningham, G. Droguett, E. A. Kurt-Jones, A. Krithivas, J. S. Hong, M. S. Horwitz, R. L. Crowell, and R. W. Finberg. 1997. Isolation of a common receptor for coxsackie B viruses and adenoviruses 2 and 5. Science 275:1320-1323. [DOI] [PubMed] [Google Scholar]
- 4.Berk, A. J. 2007. Adenoviridae: the viruses and their replication, p. 2355-2436. In D. M. Knipe and P. M. Howley (ed.), Fields virology, 5th ed., vol. 2. Lippincott Williams & Wilkins, Philadelphia, PA. [Google Scholar]
- 5.Black, B. C., and M. S. Center. 1979. DNA-binding properties of the major core protein of adenovirus 2. Nucleic Acids Res. 6:2339-2353. [DOI] [PMC free article] [PubMed] [Google Scholar]
- 6.Brandenburg, B., and X. Zhuang. 2007. Virus trafficking—learning from single-virus tracking. Nat. Rev. Microbiol. 5:197-208. [DOI] [PMC free article] [PubMed] [Google Scholar]
- 7.Brown, D. T., M. Westphal, B. T. Burlingham, U. Winterhoff, and W. Doerfler. 1975. Structure and composition of the adenovirus type 2 core. J. Virol. 16:366-387. [DOI] [PMC free article] [PubMed] [Google Scholar]
- 8.Burckhardt, C. J., and U. F. Greber. 2009. Virus movements on the plasma membrane support infection and transmission between cells. PLoS Pathog. 5:e1000621. [DOI] [PMC free article] [PubMed] [Google Scholar]
- 9.Chatterjee, P. K., M. E. Vayda, and S. J. Flint. 1986. Adenoviral protein VII packages intracellular viral DNA throughout the early phase of infection. EMBO J. 5:1633-1644. [DOI] [PMC free article] [PubMed] [Google Scholar]
- 10.Chatterjee, P. K., M. E. Vayda, and S. J. Flint. 1986. Identification of proteins and protein domains that contact DNA within adenovirus nucleoprotein cores by ultraviolet light cross-linking of oligonucleotides 32P-labelled in vivo. J. Mol. Biol. 188:23-37. [DOI] [PubMed] [Google Scholar]
- 11.Chatterjee, P. K., M. E. Vayda, and S. J. Flint. 1985. Interactions among the three adenovirus core proteins. J. Virol. 55:379-386. [DOI] [PMC free article] [PubMed] [Google Scholar]
- 12.Chen, J., N. Morral, and D. A. Engel. 2007. Transcription releases protein VII from adenovirus chromatin. Virology 369:411-422. [DOI] [PubMed] [Google Scholar]
- 13.Corden, J., H. M. Engelking, and G. D. Pearson. 1976. Chromatin-like organization of the adenovirus chromosome. Proc. Natl. Acad. Sci. U. S. A. 73:401-404. [DOI] [PMC free article] [PubMed] [Google Scholar]
- 14.Dery, C. V., G. de Murcia, D. Lamarre, N. Morin, G. G. Poirier, and J. Weber. 1986. Possible role of ADP-ribosylation of adenovirus core proteins in virus infection. Virus Res. 4:313-329. [DOI] [PubMed] [Google Scholar]
- 15.Dultz, E., E. Zanin, C. Wurzenberger, M. Braun, G. Rabut, L. Sironi, and J. Ellenberg. 2008. Systematic kinetic analysis of mitotic dis- and reassembly of the nuclear pore in living cells. J. Cell Biol. 180:857-865. [DOI] [PMC free article] [PubMed] [Google Scholar]
- 16.Everitt, E., B. Sundquist, U. Pettersson, and L. Philipson. 1973. Structural proteins of adenoviruses. X. Isolation and topography of low molecular weight antigens from the virion of adenovirus type 2. Virology 52:130-147. [DOI] [PubMed] [Google Scholar]
- 17.Fabry, C. M., M. Rosa-Calatrava, J. F. Conway, C. Zubieta, S. Cusack, R. W. Ruigrok, and G. Schoehn. 2005. A quasi-atomic model of human adenovirus type 5 capsid. EMBO J. 24:1645-1654. [DOI] [PMC free article] [PubMed] [Google Scholar]
- 18.Fallaux, F. J., O. Kranenburg, S. J. Cramer, A. Houweling, H. Van Ormondt, R. C. Hoeben, and A. J. Van Der Eb. 1996. Characterization of 911: a new helper cell line for the titration and propagation of early region 1-deleted adenoviral vectors. Hum. Gene Ther. 7:215-222. [DOI] [PubMed] [Google Scholar]
- 19.Fanning, E., and K. Zhao. 2009. SV40 DNA replication: from the A gene to a nanomachine. Virology 384:352-359. [DOI] [PMC free article] [PubMed] [Google Scholar]
- 20.Fedor, M. J., and E. Daniell. 1980. Acetylation of histone-like proteins of adenovirus type 5. J. Virol. 35:637-643. [DOI] [PMC free article] [PubMed] [Google Scholar]
- 21.Gastaldelli, M., N. Imelli, K. Boucke, B. Amstutz, O. Meier, and U. F. Greber. 2008. Infectious adenovirus type 2 transport through early but not late endosomes. Traffic 9:2265-2278. [DOI] [PubMed] [Google Scholar]
- 22.Greber, U. F., I. Singh, and A. Helenius. 1994. Mechanisms of virus uncoating. Trends Microbiol. 2:52-56. [DOI] [PubMed] [Google Scholar]
- 23.Greber, U. F., M. Suomalainen, R. P. Stidwill, K. Boucke, M. Ebersold, and A. Helenius. 1997. The role of the nuclear pore complex in adenovirus DNA entry. EMBO J. 16:5998-6007. [DOI] [PMC free article] [PubMed] [Google Scholar]
- 24.Greber, U. F., and M. Way. 2006. A super highway to virus infection. Cell 124:741-754. [DOI] [PubMed] [Google Scholar]
- 25.Greber, U. F., P. Webster, J. Weber, and A. Helenius. 1996. The role of the adenovirus protease on virus entry into cells. EMBO J. 15:1766-1777. [PMC free article] [PubMed] [Google Scholar]
- 26.Greber, U. F., M. Willetts, P. Webster, and A. Helenius. 1993. Stepwise dismantling of adenovirus 2 during entry into cells. Cell 75:477-486. [DOI] [PubMed] [Google Scholar]
- 27.Harlow, E., B. R. Franza, Jr., and C. Schley. 1985. Monoclonal antibodies specific for adenovirus early region 1A proteins: extensive heterogeneity in early region 1A products. J. Virol. 55:533-546. [DOI] [PMC free article] [PubMed] [Google Scholar]
- 28.Haruki, H., M. Okuwaki, M. Miyagishi, K. Taira, and K. Nagata. 2006. Involvement of template-activating factor I/SET in transcription of adenovirus early genes as a positive-acting factor. J. Virol. 80:794-801. [DOI] [PMC free article] [PubMed] [Google Scholar]
- 29.Hindley, C. E., F. J. Lawrence, and D. A. Matthews. 2007. A role for transportin in the nuclear import of adenovirus core proteins and DNA. Traffic 8:1313-1322. [DOI] [PMC free article] [PubMed] [Google Scholar]
- 30.Imelli, N., Z. Ruzsics, D. Puntener, M. Gastaldelli, and U. F. Greber. 2009. Genetic reconstitution of the human adenovirus type 2 temperature-sensitive 1 mutant defective in endosomal escape. Virol. J. 6:174. [DOI] [PMC free article] [PubMed] [Google Scholar]
- 31.Kalin, S., B. Amstutz, M. Gastaldelli, N. Wolfrum, K. Boucke, M. Havenga, F. DiGennaro, N. Liska, S. Hemmi, and U. F. Greber. 2010. Macropinocytotic uptake and infection of human epithelial cells with species B2 adenovirus type 35. J. Virol. 84:5336-5350. [DOI] [PMC free article] [PubMed] [Google Scholar]
- 32.Le, L. P., H. N. Le, A. R. Nelson, D. A. Matthews, M. Yamamoto, and D. T. Curiel. 2006. Core labeling of adenovirus with EGFP. Virology 351:291-302. [DOI] [PMC free article] [PubMed] [Google Scholar]
- 33.Lehmberg, E., J. A. Traina, J. A. Chakel, R. J. Chang, M. Parkman, M. T. McCaman, P. K. Murakami, V. Lahidji, J. W. Nelson, W. S. Hancock, E. Nestaas, and E. Pungor, Jr. 1999. Reversed-phase high-performance liquid chromatographic assay for the adenovirus type 5 proteome. J. Chromatogr. B Biomed. Sci. Appl. 732:411-423. [DOI] [PubMed] [Google Scholar]
- 34.Lieberman, P. M. 2008. Chromatin organization and virus gene expression. J. Cell. Physiol. 216:295-302. [DOI] [PMC free article] [PubMed] [Google Scholar]
- 35.Lindert, S., M. Silvestry, T. M. Mullen, G. R. Nemerow, and P. L. Stewart. 2009. Cryo-electron microscopy structure of an adenovirus-integrin complex indicates conformational changes in both penton base and integrin. J. Virol. 83:11491-11501. [DOI] [PMC free article] [PubMed] [Google Scholar]
- 36.Matthews, D. A., and W. C. Russell. 1998. Adenovirus core protein V is delivered by the invading virus to the nucleus of the infected cell and later in infection is associated with nucleoli. J. Gen. Virol. 79(Pt. 7):1671-1675. [DOI] [PubMed] [Google Scholar]
- 37.Meier, O., K. Boucke, S. V. Hammer, S. Keller, R. P. Stidwill, S. Hemmi, and U. F. Greber. 2002. Adenovirus triggers macropinocytosis and endosomal leakage together with its clathrin-mediated uptake. J. Cell Biol. 158:1119-1131. [DOI] [PMC free article] [PubMed] [Google Scholar]
- 38.Meier, O., and U. F. Greber. 2003. Adenovirus endocytosis. J. Gene Med. 5:451-462. [DOI] [PubMed] [Google Scholar]
- 39.Meulenbroek, R. A., K. L. Sargent, J. Lunde, B. J. Jasmin, and R. J. Parks. 2004. Use of adenovirus protein IX (pIX) to display large polypeptides on the virion—generation of fluorescent virus through the incorporation of pIX-GFP. Mol. Ther. 9:617-624. [DOI] [PubMed] [Google Scholar]
- 40.Mirza, M. A., and J. Weber. 1982. Structure of adenovirus chromatin. Biochim. Biophys. Acta 696:76-86. [DOI] [PubMed] [Google Scholar]
- 41.Mothes, W., N. M. Sherer, J. Jin, and P. Zhong. 2010. Virus cell-to-cell transmission. J. Virol. 84:8360-8368. [DOI] [PMC free article] [PubMed] [Google Scholar]
- 42.Nakano, M. Y., K. Boucke, M. Suomalainen, R. P. Stidwill, and U. F. Greber. 2000. The first step of adenovirus type 2 disassembly occurs at the cell surface, independently of endocytosis and escape to the cytosol. J. Virol. 74:7085-7095. [DOI] [PMC free article] [PubMed] [Google Scholar]
- 43.Nakano, M. Y., and U. F. Greber. 2000. Quantitative microscopy of fluorescent adenovirus entry. J. Struct. Biol. 129:57-68. [DOI] [PubMed] [Google Scholar]
- 44.Nguyen, E. K., G. R. Nemerow, and J. G. Smith. 2010. Direct evidence from single-cell analysis that human α-defensins block adenovirus uncoating to neutralize infection. J. Virol. 84:4041-4049. [DOI] [PMC free article] [PubMed] [Google Scholar]
- 45.Paulus, C., A. Nitzsche, and M. Nevels. 2010. Chromatinisation of herpesvirus genomes. Rev. Med. Virol. 20:34-50. [DOI] [PubMed] [Google Scholar]
- 46.Perez-Berna, A. J., R. Marabini, S. H. Scheres, R. Menendez-Conejero, I. P. Dmitriev, D. T. Curiel, W. F. Mangel, S. J. Flint, and C. San Martin. 2009. Structure and uncoating of immature adenovirus. J. Mol. Biol. 392:547-557. [DOI] [PMC free article] [PubMed] [Google Scholar]
- 47.Puntener, D., and U. F. Greber. 2009. DNA-tumor virus entry—from plasma membrane to the nucleus. Semin. Cell Dev. Biol. 20:631-642. [DOI] [PubMed] [Google Scholar]
- 48.Russell, W. C. 2009. Adenoviruses: update on structure and function. J. Gen. Virol. 90:1-20. [DOI] [PubMed] [Google Scholar]
- 49.Ruzsics, Z., M. Wagner, A. Osterlehner, J. Cook, U. Koszinowski, and H. G. Burgert. 2006. Transposon-assisted cloning and traceless mutagenesis of adenoviruses: development of a novel vector based on species D. J. Virol. 80:8100-8113. [DOI] [PMC free article] [PubMed] [Google Scholar]
- 50.Saban, S. D., M. Silvestry, G. R. Nemerow, and P. L. Stewart. 2006. Visualization of alpha-helices in a 6-angstrom resolution cryoelectron microscopy structure of adenovirus allows refinement of capsid protein assignments. J. Virol. 80:12049-12059. [DOI] [PMC free article] [PubMed] [Google Scholar]
- 51.San Martin, C., and R. M. Burnett. 2003. Structural studies on adenoviruses. Curr. Top. Microbiol. Immunol. 272:57-94. [DOI] [PubMed] [Google Scholar]
- 52.Silvestry, M., S. Lindert, J. G. Smith, O. Maier, C. M. Wiethoff, G. R. Nemerow, and P. L. Stewart. 2009. Cryo-electron microscopy structure of adenovirus type 2 temperature-sensitive mutant 1 reveals insight into the cell entry defect. J. Virol. 83:7375-7383. [DOI] [PMC free article] [PubMed] [Google Scholar]
- 53.Spearman, C. 1908. The method of ‘right and wrong cases’ (constant stimuli) without Gauss' formulae. Br. J. Psychol. 2:227-442. [Google Scholar]
- 54.Stewart, P. L., S. D. Fuller, and R. M. Burnett. 1993. Difference imaging of adenovirus: bridging the resolution gap between X-ray crystallography and electron microscopy. EMBO J. 12:2589-2599. [DOI] [PMC free article] [PubMed] [Google Scholar]
- 55.Strunze, S., L. C. Trotman, K. Boucke, and U. F. Greber. 2005. Nuclear targeting of adenovirus type 2 requires CRM1-mediated nuclear export. Mol. Biol. Cell 16:2999-3009. [DOI] [PMC free article] [PubMed] [Google Scholar]
- 56.Sung, M. T., T. M. Cao, R. T. Coleman, and K. A. Budelier. 1983. Gene and protein sequences of adenovirus protein VII, a hybrid basic chromosomal protein. Proc. Natl. Acad. Sci. U. S. A. 80:2902-2906. [DOI] [PMC free article] [PubMed] [Google Scholar]
- 57.Suomalainen, M., M. Y. Nakano, K. Boucke, S. Keller, R. P. Stidwill, and U. F. Greber. 1999. Microtubule-dependent minus and plus end-directed motilities are competing processes for nuclear targeting of adenovirus. J. Cell Biol. 144:657-672. [DOI] [PMC free article] [PubMed] [Google Scholar]
- 58.Tal, M., A. Silberstein, and E. Nusser. 1985. Why does Coomassie brilliant blue R interact differently with different proteins? A partial answer. J. Biol. Chem. 260:9976-9980. [PubMed] [Google Scholar]
- 59.Trotman, L. C., N. Mosberger, M. Fornerod, R. P. Stidwill, and U. F. Greber. 2001. Import of adenovirus DNA involves the nuclear pore complex receptor CAN/Nup214 and histone H1. Nat. Cell Biol. 3:1092-1100. [DOI] [PubMed] [Google Scholar]
- 60.Ugai, H., A. V. Borovjagin, L. P. Le, M. Wang, and D. T. Curiel. 2007. Thermostability/infectivity defect caused by deletion of the core protein V gene in human adenovirus type 5 is rescued by thermo-selectable mutations in the core protein X precursor. J. Mol. Biol. 366:1142-1160. [DOI] [PMC free article] [PubMed] [Google Scholar]
- 61.Ugai, H., M. Wang, L. P. Le, D. A. Matthews, M. Yamamoto, and D. T. Curiel. 2010. In vitro dynamic visualization analysis of fluorescently labeled minor capsid protein IX and core protein V by simultaneous detection. J. Mol. Biol. 395:55-78. [DOI] [PMC free article] [PubMed] [Google Scholar]
- 62.van Oostrum, J., and R. M. Burnett. 1985. Molecular composition of the adenovirus type 2 virion. J. Virol. 56:439-448. [DOI] [PMC free article] [PubMed] [Google Scholar]
- 63.Vayda, M. E., A. E. Rogers, and S. J. Flint. 1983. The structure of nucleoprotein cores released from adenovirions. Nucleic Acids Res. 11:441-460. [DOI] [PMC free article] [PubMed] [Google Scholar]
- 64.Walkiewicz, M. P., N. Morral, and D. A. Engel. 2009. Accurate single-day titration of adenovirus vectors based on equivalence of protein VII nuclear dots and infectious particles. J. Virol. Methods 159:251-258. [DOI] [PMC free article] [PubMed] [Google Scholar]
- 65.Weber, J. M., and G. Khittoo. 1983. The role of phosphorylation and core protein V in adenovirus assembly. J. Gen. Virol. 64(Pt. 9):2063-2068. [DOI] [PubMed] [Google Scholar]
- 66.Wickham, T. J., P. Mathias, D. A. Cheresh, and G. R. Nemerow. 1993. Integrin alpha v beta 3 and integrin alpha v beta 5 promote adenovirus internalization but not virus attachment. Cell 73:309-319. [DOI] [PubMed] [Google Scholar]
- 67.Xue, Y., J. S. Johnson, D. A. Ornelles, J. Lieberman, and D. A. Engel. 2005. Adenovirus protein VII functions throughout early phase and interacts with cellular proteins SET and pp32. J. Virol. 79:2474-2483. [DOI] [PMC free article] [PubMed] [Google Scholar]
- 68.Zubieta, C., G. Schoehn, J. Chroboczek, and S. Cusack. 2005. The structure of the human adenovirus 2 penton. Mol. Cell 17:121-135. [DOI] [PubMed] [Google Scholar]
Associated Data
This section collects any data citations, data availability statements, or supplementary materials included in this article.


