Abstract
Although A-type potassium currents are found in type II hair cells in the inner ear of most species, the molecular mechanisms for activation and inactivation of the IA current remain unknown. In frog semicircular canal hair cells, for example, there appears to be two classes of currents having either fast or slow inactivation (Norris et al., 1992; Russo et al., 2007). It has been suggested that somehow the “ball and chain” mechanism (N-terminus motif) is modified by alternative splicing to account for the two classes of inactivation. To examine other possibilities, we cloned alpha and beta subunits that comprise the A-type potassium channel complex in adult and embryonic pigeon brain, cochlea and labyrinth. By sequence homology, we concluded that the subunits present were Kvα1.4 and Kvβ1.1. The sequence of the open reading frame for Kvα1.4 contained the N-terminus, pore and C-terminus motifs for N-and C-type inactivation. The sequence for Kvβ1.1 displayed amino acids consistent with assembly and association with Kvα1.4 alpha subunits. Kvα1.4 and Kvβ1.1 were transfected either singly or in combination into CHO cells. These cells and native hair cells from the pigeon utricle were patch clamped and the inactivation properties of the A-type current were studied. In the native hair cells, the A-type current was identified by its pharmacological (4-AP; IC50 = 11μM) and voltage dependent inactivation properties. A comparison of the mean time constants from best fitted single exponential and sum of two exponential equations to the ionic current inactivation revealed the following. In CHO cells when Kvα1.4 was expressed alone, the mean time constant (τ1 = 107 ms ±19, N =32) was significantly (P < 0.001) longer and the mean peak amplitude (2.28 nA ±0.39, N=32) was smaller than when Kvα1.4 and Kvβ1.1 were expressed in CHO cells. Moreover, the co-transfection of Kvα1.4 and Kvβ1.1 into CHO cells caused a shift in the steady state inactivation curve parameter Vo 30 mV in the hyperpolarized direction relative to CHO cells expressing only Kvα1.4. Similarly, Kvα1.4 transfected CHO cells produced longer time constants and smaller amplitudes than those found for native utricular hair cells. These data lead us to conclude that while the amino acid motifs are present in Kvα1.4 and Kvβ1.1 to suggest N-and C-type inactivation, co-assembly and association of Kvα1.4 and Kvβ1.1 may also produce changes in the time dependent inactivation properties of vestibular hair cells.
Keywords: potassium channels, A-type, inactivation, 4-AP, clone, alpha subunit, beta subunit, utricle, CHO cells
INTRODUCTION
The A-type potassium current (IA) was first identified and characterized by Connor and Stevens(Connor and Stevens, 1971). The features of this current have been reviewed by Rudy (1988) and include fast transient activation, steady state and time dependent inactivation (< 100 ms at room temperature) and sensitivity to mM concentrations of 4-aminopyridine (4-AP). IA contributes to the latency of the first action potential, the repolarization of the action potential and the inter-spike interval of the action potential train.
IA has been identified in the sensory cells (hair cells) in various end organs of the inner ear including the frog sacculus (Lewis and Hudspeth, 1983; Hudspeth and Lewis, 1988; Catacuzzeno et al., 2003); frog semicircular canals (Norris et al., 1992; Russo et al., 1995; Masetto et al., 1996; Russo et al., 2007), pigeon semicircular canals (Lang and Correia, 1989); pigeon utricle (Weng and Correia, 1999); guinea-pig semicircular canals (Griguer et al., 1993) and developing rat utricle (Lennan et al., 1999). IA has also been found in auditory hair cells from the chick (Murrow and Fuchs, 1990) and from the frog’s auditory basilar papilla (Smotherman and Narins, 1999). Since only- goldfish saccular hair cells (Sugihara and Furukawa, 1989) have action potential like spikes, other physiological functions of IA have been proposed. For example, it has been proposed that the rapid activation of IA (causing cell hyperpolarization) may oppose depolarization caused by transduction current (Masetto et al., 1994); or IA activation and inactivation may dampen vibratory responses in the endolymph-perilymph system (Norris et al., 1992) or finally, it has been proposed that the inactivation of IA (causing hair cell membrane depolarization) may oppose adaptation of the transduction current (Fuchs, 1992).
Based on parameters derived from best fitted sum of two exponential functions to IA current inactivation in hair cells in the frog semicircular canal neuroepithelium, it has been proposed that two classes of potassium A-current channels exist; one with primarily fast inactivation kinetics and one with primarily slow inactivation kinetics (Norris et al., 1992). Subsequently, it has been found that these two classes are located in different regions of the frog semicircular canal neuroepithelium (crista) (Russo et al., 2007). Also, other neurons, particularly in the hypothalamus (Halliwell et al., 1986) have been shown to demonstrate two classes of Atype channels with both fast and slow inactivation kinetics.
At a molecular level, A-type channels with different inactivation kinetics could be produced by N-type inactivation, C-type inactivation and/or association of certain alpha and beta subunits comprising the A-type ion channel protein complex. Chimeras of the Drosophila mutant Shaker gene provided mRNAs that coded for A-type channels with different inactivation properties (Zagotta et al., 1989; Hoshi et al., 1990). Similar findings were observed for alpha subunits of a mammalian shaker-related gene Kvα1.4 [RKC4 (Beckh and Pongs, 1990); HK2 (Tamkun et al., 1991)]. These chimeric mutations involved an amino (N)-terminus motif of the protein which led to the formulation of a “ball and chain” model of N-type inactivation (Hoshi et al., 1990; Hoshi et al., 1991). It has been hypothesized (Hoshi et al., 1990) that the amino-acid motif consists of residues acting as a tether (or chain) and residues with positive charges acting as a ball. Given the appropriate conditions, conformational changes occur and, the ball “swings” and binds to the intracellular region of the pore; obstructing it. It was found that mutations which mapped to one part of the chain enhanced inactivation while mutations to the ball or another part of the chain removed inactivation (Hoshi et al., 1991). Based on this result, recently, it has been proposed that in frog semicircular canal hair cells, splice variants of mRNAs that code for the chain of the ball and chain motif could cause expression of chains of different lengths possibly leading to the fast and slow classes of hair cells based on their rates of inactivation (Russo et al., 2007).
When 40–100 amino acids were deleted from the N-terminus of shaker and Kvα1.4 subunit sequences, the fast N-type inactivation was removed but a slow inactivation remained. This slow inactivation was named C-type inactivation because additional site-specific mutations near the pore and carboxyl (C) terminus removed the remaining slow inactivation (Hoshi et al., 1990; Hoshi et al., 1991; Rasmusson et al., 1995; Bett and Rasmusson, 2004). Finally, different classes of A-type current inactivation could be produced by certain beta subunits co-assembling with certain alpha subunits in the endoplasmic reticulum (ER) (Nagaya and Papazian, 1997) and subsequently being associated in the plasmalemma. Amplified product for Kvβ1.1 and Kvα1.4 subunit transcripts has been detected in the chick cochlea (Rajeevan et. al., 1999). Associations of alpha and beta subunits when expressed in oocytes and when compared to the alpha subunit alone have been shown to accelerate inactivation (Rettig et al., 1994).
Previously, macroscopic currents with fast and slow activation and inactivation kinetics have been demonstrated in hair cells in the neuroepithelium of the pigeon utricle (Weng and Correia, 1999). In the present paper, we explore the molecular mechanisms that might cause those differences in kinetics. Our data, presented here, leads us to suggest that: variation in inactivation time constants shown by the pigeon A-type conductance in utricular hair cells is possibly attributable to both N-type and C-type inactivation and alpha/beta subunit association. We show that the amino acid motifs thought to underlie N-type and C-type inactivation in other species are conserved in the pigeon pKvα1.4 subunit sequence. Furthermore, we demonstrate that the accessory beta subunit transcripts are present along with alpha subunit transcripts in both embryonic and adult pigeon hair cells. This suggests that the code for these subunits is not significantly down regulated during the pigeon’s development. Employing the heterologous expression system, Chinese hamster ovary (CHO) cells, we demonstrate that Kvβ1.1 when co-assembled with the Kvα1.4 subunit lead to an acceleration of inactivation; an increase in amplitude and a 30 mV leftward shift in the voltage dependent inactivation curve.
EXPERIMENTAL PROCEDURES
Native Hair Cell Electrophysiology
Hair cells in labyrinthine slices were patch clamped in whole cell mode using methods previously described in detail (Weng and Correia, 1999). Briefly, utricles were harvested and incubated in DMEM augmented with 24 mM NaHCO3, 15 mM PIPES, 50 mg/l ascorbate, and 1.5% fetal calf serum. Tissue and medium were maintained at 37°C, pH 7.4, and an osmolality of 320 mosmol/kg H2O, in a saturated 95% O2-5% CO2 environment. At varying intervals (2 – 6 hours), one of the utricles, was taken from the incubator, embedded in 4% agar, and quickly covered by a partially frozen high magnesium bath solution containing (in mM): 3.0 KCl, 145.0 NaCl, 0.1 CaCl2, 7.5 MgCl2, 15.0 HEPES, 10.0 glucose, 50.0 mg/l ascorbate, and 2.0 sodium pyruvate. The utricle was sliced in a plane perpendicular to its long axis, using a vibratory microtome (Campden, London, UK). Individual slices (150–250μm in thickness) were then transferred to a dish with a # 1 glass cover slip bottom. The slice was held in place by a weighted nylon mesh and bathed in an oxygen-saturated bath solution containing (in mM): 3.0 KCl, 145.0 NaCl, 2.0 CaCl2, 1.0 MgSO4, 15.0 HEPES, 10.0 glucose, 50.0 mg/l ascorbate, and 2.0 sodium pyruvate. The bath solution was titrated to a pH of 7.4 with NaOH or HCl and to an osmolality of 320 mosmol/kg H2O. The dish was mounted on a microscope stage and the cells were viewed using differenential interference contrast (DIC) microscopy optics including an “Optovar” magnifier and a 40× water-immersion objective (Zeiss Axioskop, Thornwood, NY, USA),. The temperature of the bath was 23°C and the bath was changed at a rate of 1.2 ml/min. The patch pipettes contained (in mM): 140 KCl, 1 CaCl2, 2 MgCl2, 10 HEPES, and 11 EGTA. The pipette solution was titrated to a pH of 7.4 with KOH or HCl and to an osmolality of 315 mosmol/kg H2O. The electrodes were back-filled with a solution containing a perforating agent. The perforating agent (either Amphotericin B, Sigma No.A-4888 or Nystatin, Sigma No. N3503, Sigma-Aldrich, St. Louis, MO, USA) was dissolved completely in dimethyl sulfoxide (DMSO). Five milligrams of the perforating agent was dissolved in 50 μl of DMSO. This stock solution was diluted to a final concentration of 250μg/ml in a back-fill solution. The back–fill solution contained (in mM): 95 KMeSO4, 45 KCl, 2 CaCl2 and 2 MgCl2. Care was taken to ensure that the final concentration of DMSO was ≤ 0.25%. The tip of the electrode was filled up to 600 μm with bath solution. The access resistance for the perforated-patch recordings varied between 6 and 20 MΩ. The electrode junction potential and electrode capacitance were compensated using the amplifier’s analogue circuitry. No attempt was made to compensate for series resistance. The clamp speed did not limit the analysis of the activation kinetics. Stimuli were generated and voltage and current signals were sampled using AD/DA converters (DigiData 1200, Axon instruments/Molecular Devices, Sunnyvale, CA, USA) that were controlled by a personal computer (PC) running data acquisition software (Clampex 6.3, Axon Instruments). The upper cut-off frequency of the amplifier’s (Axopatch 200, Axon instruments) filter was set at 2 kHz. The digital sampling frequency was two to five times the filter’s upper cut-off frequency.
Four-aminopyridine (4-AP) was superfused onto the native hair cells in the slice using a pressurized computerized superfusion system (model DAD-12; Alfred Liss Associates Scientific Instruments, Westbury, NY, USA). The superfusion pipette (100 μm bore) was placed 30 μm from the cell, and the flow rate varied from 1–5 μl/s. The cells were superfused with 4-AP for 60–120 s as recordings were made. Drug wash out was with the normal bath solution for 180–240 seconds.
Electrophysiology Data Analysis
To study IA in native hair cells, a voltage clamp protocol (See Fig. 5A) was used that has been previously published (Lang and Correia, 1989). A prepulse was given to step the hair cell membrane potential to either −30 mV or −110mV from a holding potential of −60 mV. The prepulse duration was for 500ms. Then a test pulse of −10mV was applied for 200 ms. The −110 mV prepulse potential was used to remove IA steady state inactivation. The −30 mV prepulse was used to inactivate IA but to activate all the other outward currents. The test pulse current traces following prepulses of either −110 mV or −30 mV were subtracted from one another thereby providing a trace which was an unbiased estimate of IA.
Fig. 5.
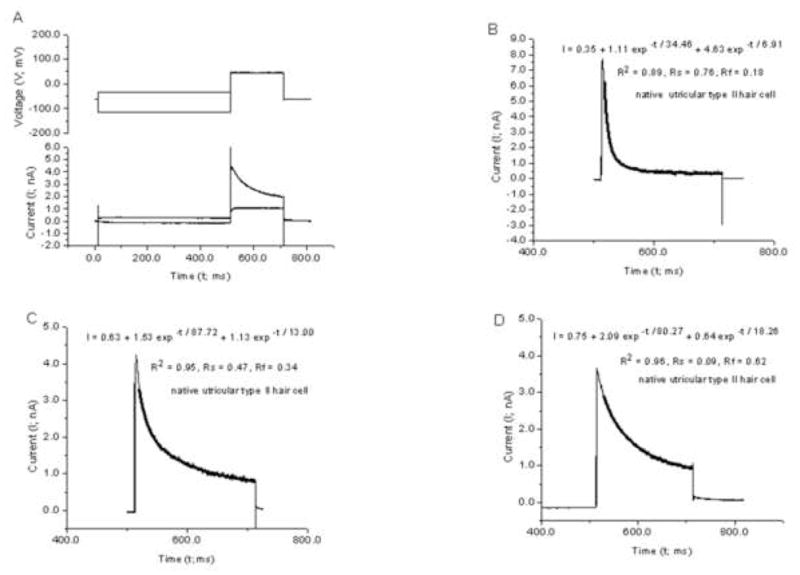
Current traces resulting from voltage clamped native type II hair cells in a pigeon utricular slices. (A) Voltage protocol and the total current trace during and following a prepulse of −110 mV and −30 mV. (B–D) Traces in which the total current during the test pulse (+ 50 mV) following the −30 mV prepulse was subtracted from the total current following the −110 mV prepulse. The trace shown in (D) resulted from the subtraction operation on the two currents shown in (A). The dark line overlaying each current trace in B–D corresponds to the curve generated from evaluating equations for the best fitted sum of two exponential functions (Eq. 1). The equation with best fitted parameters is inset in each figure as is the coefficient of determination, R2 (a goodness of fit estimate) and the proportion of fast and slow decay in the current inactivation, Rf (Eq. 2) and Rs (Eq. 3), respectively. Traces representing two extremes in inactivation decay, reflected by Rf values of 0.18 and 0.62, are presented in Panels B and D, respectively. A trace representing Rf and Rs values near the average (0.42) is shown in Panel C.
This trace was curve fitted with a single or double exponential of the form:
| (1) |
Where A0 is a constant current offset, A1 and A2 are the coefficients of the current decay terms and the τs are the time constants of current decay.
From the double exponential equation, two statistics were formed (Norris et al., 1992):
| (2) |
| (3) |
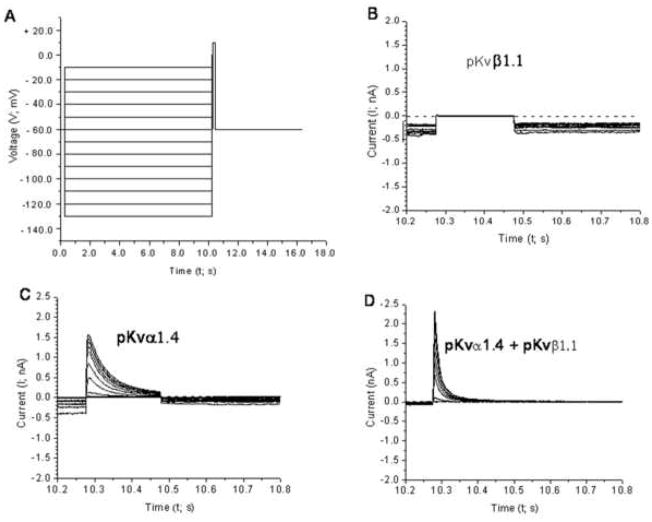
A similar protocol (See Fig. 8A) was used to test CHO cells transfected with pKvα1.4 and pKvβ1.1 either singly or in combination. This protocol consisted of 10 s prepulses from −130 to −10 mV in 10 mV increments followed by a 200 ms test pulse at + 10 mV. Boltzmann functions of the form below were fitted to the normalized current as a function of prepulse amplitude.
Fig. 8.
Representative ionic currents from CHO cells transfected with ORF DNA synthesized from the sequences of (B) pKvβ1.1, (C) pKvα1.4 and (D) pKvβ1.1 plus pKvα1.4. Panel A shows the voltage prepulse and test pulse protocol which generated the current traces in this and the following 2 figures. Panels B–D show the currents measured during the test pulse following prepulse of different amplitudes. The dashed line in (B) indicates the zero current level. No leak subtraction was performed. No current could be measured following transfection of pKvb1.1 alone (see Panel B). Co-transfection of pKvβ1.1 plus pKvα1.4 shortened the inactivation time constant and increased the peak amplitude (compare panels C and D).
| (4) |
where;
A2 = max current; A1 = min current; V = voltage, V0 = V where I = (A1 +A2)/2, δV = slope of I/V function.
A dose- response curve for 4-AP was formed using a voltage protocol consisting of a series of steps from −60 to +50 mV in 10 mV increments. Different concentrations of 4-AP were randomly applied to the hair cells and current was measured before and after application of 4-AP. Only the currents from the 50 mV test protocol were used (See Fig. 7 inset) to make the dose – response curve. The peak of the complex total current during the + 50 mV test pulse before the application of 4-AP was divided into the corresponding point of the complex total current after the application of 4AP. This fraction was plotted as a function of 4-AP concentration. The 4-AP concentrations used were 0.005, 0.01, 0.1, 1.0, and 10.0 mM. These resulting data points were fitted with a one site binding curve of the form.
Fig. 7.
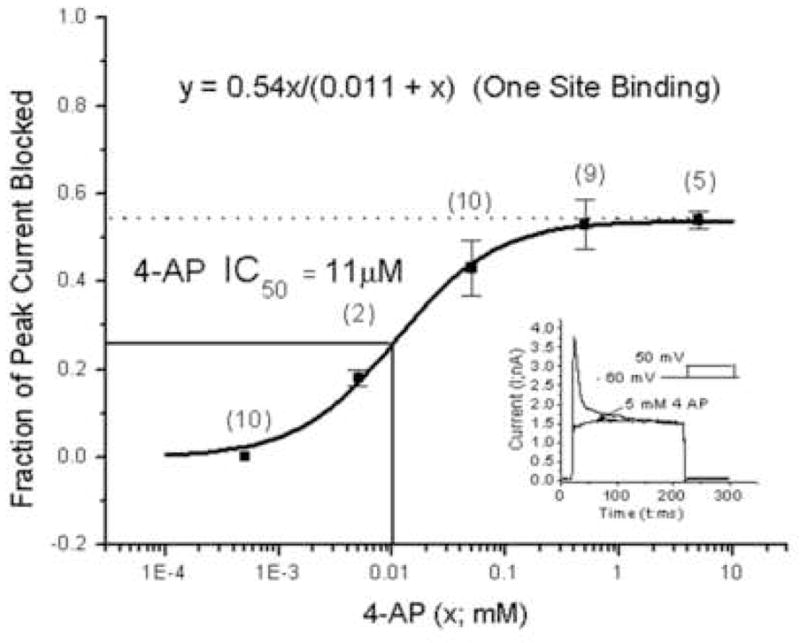
A dose - response curve for the fractional block of total current by 4-AP. 4-AP is a highly specific blocker for the IA current. Each data point and error bar represents the mean and standard error of the mean. The number in parenthesis above each mean point equals the number of observations comprising the mean. Shown in the inset are two current traces; the higher peak amplitude trace corresponds to the total current before drug application and the lower peak amplitude trace is the total current during and following application of 5mM 4-AP. The latter curve is composed of the remaining outward currents in the type II hair cell. The curve connecting each point in the dose - response curve results from evaluation of the equation for a one site binding system. That equation (with best fitted parameters) is inset in the figure as is the IC50 value of 11μM.
| (5) |
Where I = current; x is 4-AP concentration, B = the saturation coefficient and K is the 50% binding point or in the case of an antagonist the IC50.
Cloning Pigeon Kv alpha 1.4 and Kv beta 1.1
Kvα1.4 and Kvβ1.1 were independently cloned from both pigeon brain and pigeon ampullae total RNA using an RT-PCR-based strategy. Total RNA was isolated from pigeon brain and ampullae using the RNaqueous kit (Ambion/Applied Biosystems, Austin, Texas, USA). Synthesis of cDNA and PCR amplification of the open reading frames (ORF) for both Kvα1.4 and Kvβ1.1 were performed as previously described (Correia et al., 2004) using primers 5′GGATCCACCATGGAGGTTGCAATGGTGAGTGCAG3′ and 5′GTGGACTTTTACACATCAGTTTCCACAG3′ for Kvα1.4 and 5′GGATCCACCATGCAGGTGTCCATCGCCTGCAC3′ and 5′GTCGACATTATGATCTGTAGTCCTTCTTG3′ for Kvβ1.1. The primer extension time for Kvα1.4 was eight minutes and the Kvβ1.1 extension time was five minutes. Primer design was based upon the nucleotide sequence of the respective chicken ORFs (Genbank accession numbers U82356 and U87787). Primers introduced unique restriction sites into the amplified DNA (5′ Bam HI, 3′ SalI) to facilitate the insertion of the respective ORF into pcDNA 3.1 (Invitrogen, Carlsbad, CA, USA). Both ORFs were also cloned into a pCMS-EGFP vector (BD Biosciences/Clonetech, San Jose, CA). For this vector system, the 5′ BamHI site was converted to a blunt end using T4 DNA polymerase (Invitrogen) prior to digestion of the DNA with Sal I. Each of the plasmid constructs used in this study were confirmed by DNA sequence analysis. The GenBank accession numbers for the nucleotide sequence of the ORF for pigeon Kvα1.4 is AY058914 and Kvβ1.1 is AY058915.
RT-PCR Assays
Total RNA from brain, cochlea and labyrinth of 14–15 day pigeon embryos and adult pigeons was isolated using either the Totally RNA kit or the RNaqueous kit (Ambion/Applied Biosystems). RNA quality was assessed by analysis with a RNA Nano-Chip using the Agilent 2100 Bioanalyzer (Agilent Technologies, Santa Clara, CA, USA). First strand cDNA synthesis was performed utilizing the RETROscript kit (Ambion/Applied Biosystems) using conditions recommended by the manufacturer. RNA samples were DNase treated using DNA-free (Ambion/Applied Biosystems) and tested for DNA contamination using an RT-PCR assay for the L19 ribosomal protein gene. L19 primers (5′TGAGGAGGATGCGGATCCTGAGG3′, 5′TGCCTTCAGCTTGTGGATGTGCTC3′) target a 155 base sequence in the L19 mRNA while a 420 bp DNA is amplified from the L19 gene. RT-PCR assays for Kvα1.4 were designed to amplify a two Kb DNA using target-specific primers: (5′ATGGAGGTTGCAATGGTGAGTGCAG3′, 5′CACATCAGTTTCCACAGAATTTGAATTC3′) and the FailSafe buffer-A PCR system (Epicentre Biotechnologies, Madison WI, USA). A 1.2 kb Kvβ1.1 target was amplified using primers (5′ATGCAGGTGTCCATCGCCTGCAC3′, 5′ATGATCTGTAGTCCTTCTTGCTGTAG3′) and FailSafe buffer-D PCR system. Cycle conditions for both targets were denaturation at 94°C for 30 seconds, annealing at 62°C for 30 seconds and a primer extension at 72°C for seven minutes for a total of 40 cycles. Amplified DNAs were analyzed by electrophoresis on 0.85% agarose gels and visualized by ethidium bromide staining.
CHO Cell Culture and Transfection
CHO-S cells were obtained from Invitrogen (Invitrogen/Gibco) and maintained in complete media in T75 flasks at 37°C, 95% relative humidity and 5% CO2. The complete media contained Dulbecco’s modified Eagle’s medium (DMEM; Invitrogen), 10% fetal bovine serum (heat-inactivated, Invitrogen), 1× nonessential amino acids (Sigma, St. Louis, MO), and 1× penicillin/streptomycin/neomycin antibiotics (Invitrogen/GIBCO). The CHO cells were split twice at week and a T75 flask seeded at a ratio of 1:20. After 25 passages, cells were discarded and a new vial of CHO cells were trypsinized, counted with a hemocytometer, and plated into 35-mm Petri dishes at a density of 3 × 10⁵ cells/dish (2 ml). When the CHO cells were ~ 80–90 % confluent, they were transfected, using liposome-mediated methods, with plasmids encoding the ORFs of Kvα1.4 and Kvβ1.1 singly or in combination. The CHO cells were co-transfected with EGFP. The transfection efficiency was 60–80%. The cells were incubated post transfection for 24, 48, and 72 h in 2 ml of complete medium. The cells were removed from the 35-mm Petri dishes using a non-enzymatic dissociation solution (Specialty Media, Phillipsburg, NJ, USA) and centrifuged at 500 g. After the supernatant was removed, the cells were re-suspended in the extracellular bath solution and plated on the cover slip bottom of the recording dish, which had previously been coated twice with poly-D-lysine (0.5 μg/ml). In other cases, cells were cultured on 25-mm circular cover-slips. Surface tension held the cover-slips to the recording dish bottom.
CHO cell electrophysiology
The whole cell ruptured patch recordings of transfected CHO cells has been described in more detail elsewhere (Correia et al., 2004). Briefly, electrodes, pulled on a P-2000 puller (Sutter Instruments, Novato, CA, USA), were made from blanks with an internal glass filament. The glass blanks were borosilicate (0.75 ID, 1.50 OD, no. 1B150F-3; World Precision Instruments, Sarasota, FL, USA). The borosilicate blanks were initially washed with Chromerge (Fisher Scientific, Hampton, NH, USA), silanized with 5% dimethyldichlorosilane (Sigma) in chloroform (Electron Microscopy Sciences, Hatfield, PA, USA), then subsequently washed multiple times and dry heat sterilized at 240°C. The whole cell recording electrode impedance was typically 2–5 MΩ. Series resistance (mean = 7.2 ± 2.3 MΩ, N=6) and capacitance (mean = 15.3 ± 6.9 pF, N=6) were compensated between 80 and 98% with a typical value of 95%. No online leak subtraction was performed. Subsequently, in some cases, leak subtraction was performed digitally. Whole cell currents were amplified 1× using an Axopatch 200 amplifier (Axon Instruments). Signals were acquired using a Digidata 1200 interface (Axon Instruments). The whole cell currents were filtered at 2 kHz and sampled at 5 kHz. Cells that showed green fluorescence, when viewed using FITC epifluorescence and DIC transmitted light, were selected for patch clamp recording. The cells were viewed through the optics of an Axoskop microscope (Carl Zeiss, Thornwood, NY, USA). The pipette and bath solutions were the same as used for native cells in the labyrinthine slice preparation (see above).
Animals
In one set of experiments, adult white king pigeons (Columbia livia) of either sex, weighing from 200 to 700 g and with ages ranging from 3 to 12 mo, provided the tissue for labyrinthine slices and lysates for RT-PCR.
In separate experiments, four to seven day old white king pigeon fertilized eggs provided embryological tissue for RT-PCR. The eggs were maintained in a Turn × incubator (Lyon Electric Co., Chula Vista, CA) until day 14 or 15. The eggs were turned hourly and maintained at 38°C, and a relative humidity of 60%. On days 14 or 15, the embryos were decapitated and the brain, labyrinths and cochleae were removed and placed in lyses buffer (see subsequent procedures in RT-PCR Assays section).
All experimental procedures were conducted only after approval by the institutional animal care and use committee and followed the guidelines put forth in the Guide for the Care and Use of Laboratory Animals, Institute of Laboratory Animal Resources, Commission on Life Sciences, National Research Council, 1996 and the Declaration of Helsinki. Every effort was made to minimize the number of animals used and their suffering.
Statistical Analysis
Statistical analysis was performed using two programs: Systat V12 (Systat Software, Inc. San Jose, CA ) and SPSS V10 (SPSS Inc. Chicago Illinois). One way and two way ANOVAs were performed using a univariate general linear model. In most cases means were compared using Tukey and Bonferroni post hoc tests. When the results from these two tests differed both sets of results are given. Data is usually expressed as mean ± 1 standard error of the mean unless otherwise stated.
RESULTS
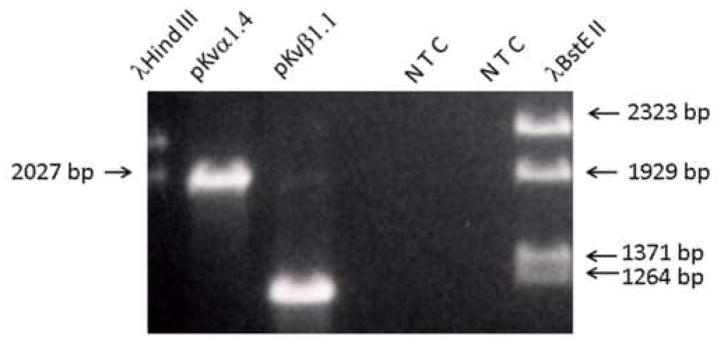
Primers designed from the chicken Kvα1.4 and Kvβ1.1 were used to isolate the pigeon counterparts from brain total RNA using an RT-PCR strategy (Fig 1.) The 1989 base pair (bp) pKvα1.4 product and the 1208 bp pKvβ1.1 DNA product (Fig. 1) were cloned and sequenced to confirm their identity as pKvα1.4 and pKvβ1.1. The sequence identity at the nucleotide level and in parenthesis, the theoretical translated protein level, between pKvα1.4 and chicken AF084460 (NM_204899), rat NM_012971 (NP_037103) and human L02751 (NP_002224) Kvα1.4 is 95 (96), 77 (84) and 78 (84) percent. While the nucleotide sequence identity between pKvβ1.1 (AY058915) and cKvβ1.1 (NM_204906) is 88% the identity between pKvβ1.1 and hKvβ1.1 (NM_002233) is only 45%.
Fig. 1.
PAGE gel showing 1989 base pair (bp) and 1208 bp products (lanes 2 and 3) derived from pigeon brain and labyrinth lysate using chicken cKvα1.4 and cKvβ1.1 primers. Also shown in lanes 1 and 7 is product from sizing ladders and no product from no template negative controls, NTC, (lanes 5 and 6). The 1989 and 1208 amplicons were excised, TA cloned and sequenced. The sequences corresponded to Kvα1.4 and Kvβ1.1 in other non avian species. The ORF pigeon sequences can be found in Genbank under accession numbers AY058914 and AY058915 for pKvα1.4 and pKβ1.1, respectively.
The 1989 bp nucleotide sequence for KVα1.4 was compared the chicken genome (http://genome.ucsc.edu/ggi-bin/hgBlat) and a match with 94.2 % identity was found to nucleotides on chromosome 5 starting at 4538012 and ending at 4540000. This region contained only exons and no introns. Thus unless the gene encoding for pigeon KVα1.4 acquired introns for some reason, the possibility of splice variants is precluded by the absence of introns.
A 50 residue segment from the amino terminus of Kvα1.4 that comprises the motif which forms part of the “ball and chain” mechanism for N-type inactivation (Hoshi et al., 1991) is shown in Fig. 2A. The amino acid identity for this motif when pKvα1.4, rKvα1.4 and hKvα1.4 are compared is 94%. When the sequence length is extended to 82 residues, however, the identity drops to 77%. Mutants with amino acids 2-82 deleted in Kvα1.4 derived from ferret ventricle (Tseng-Crank et al., 1993; Comer et al., 1994) and drosophila shaker channel (ShBΔ6-46) (Hoshi et al., 1991) showed an absence of fast (N-type) inactivation but activation kinetics and slow inactivation (C-type inactivation) were unaffected.
Fig. 2.
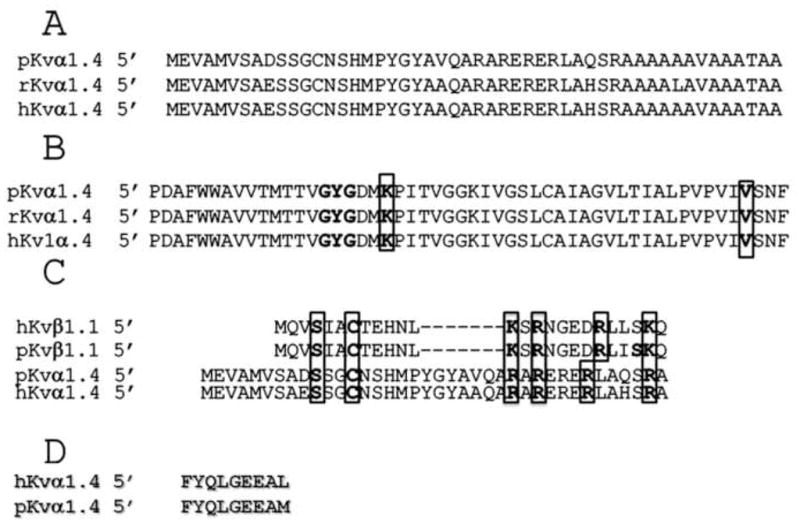
Partial sequences from human, rat and pigeon Kvα1.4 and Kvβ1.1. (A) 46/50 residues at the N-terminus of Kvα1.4 are identical across the species shown. This region is known to be associated with N - type inactivation (B) Alignment of sequences near the pore region (indicated by the GYG motif) and S6 transmembrane region of Kvα1.4. There is 100% identity of amino acid residues in this region across the species shown. Mutant sequences with a deleted N terminus Kvα1.4 ORF (to eliminate N-type Inactivation) and with changes in the framed lysine (K) and valine (V) residues, when expressed in oocytes, showed currents with C-type inactivation. (C) Comparison of the amino-terminus of pigeon and human Kvα1.4 and Kvβ.1.1. In both species the cystine (C) which renders the motif sensitive to oxidation (Ruppersberg et al., 1991) is framed and found in both pKvα1.4 and pKvβ1.1 as is the serine/cystine motif followed by a region rich in positively charged amino acids (framed lysines and arginines). Dashes correspond to gaps in the sequences. The serine/cystine and lysine/arginine regions are thought to comprise the α- and β- “ball and chain” regions (inactivating domains) related to N-type inactivation. (D) residues of a Kvβ1 subunit binding domain region found in the Kvα1.4 amino terminus that is necessary for Kvα and Kvβ interaction (Sewing et al., 1996). The association and binding domain shown is almost completely conserved in pigeon and human.
Fig. 2B shows an amino acid segment of Kvα1.4 between the pore region and the 6th transmembrane spanning domain (S6). The pore region is identified by the highly conserved GYG amino acid motif. Near this motif is a lysine (bolded and framed) and further toward the carboxyl end, on the intracellular side of S6, is a valine (V) (bolded and framed). A valine to alinine or a lysine to tyrosine mutation combined with an N-terminus deleted (FKΔ2-146) mutant (leading to absence of N-type inactivation) alters: the inactivation time constant; recovery from inactivation and inverts the relation between C-type inactivation and [K+]o (Hoshi et al., 1990; Hoshi et al., 1991; Rasmusson et al., 1995; Bett and Rasmusson, 2004). These conditions are hallmarks of C-type inactivation and N-type/C-type interaction. As shown in Fig. 2B, this Kvα1.4 domain is completely conserved from pigeon to man.
Fig 2C presents the N-terminus portion of the human and pigeon Kvα1.4 and Kvβ1.1 sequences. It can be seen that the human and pigeon Kvβ1.1 motifs do not differ. Moreover, the Kvβ1.1 N-terminus sequence like the N-terminus sequence for Kvα1.4 (responsible for N-type inactivation) have a serine-cystine motif (bolded and framed) followed by a group of positively charged amino acids (bolded and framed lysines and arginines). The cystine residue (Fig. 2C) present in both Kvα1.4 and Kvβ1.1 subunits render the inactivating mechanisms sensitive to oxidation/reduction reactions (Ruppersberg et al., 1991). Fig. 2D presents motifs for the Kvβ1 subunit putative binding domain (Sewing et al., 1996) found in Drosophila.. This sequence is conserved and also found on the pKVα1.4 and hKVα1.4 amino termini.
The open reading frames for pKvα1.4 and pKvβ1.1 were analyzed (www.cbs.dtu.dk) for potential glycosolation, acetylation and phosphorylation sites. For the motifs presented in Fig. 2A–C no glycosolation or acetylation sites were present. However, the serine and tyrosine sites within these sequences (Fig. 2A–C) have a high probability (P > 0.75) of being a phosphorylation site.
Expression of Kvα1.4 and Kvβ1.1 in pigeon brain, cochlea and labyrinth in both 14–15 day old pigeon embryos and in the adult pigeon are shown in Fig. 3 and Fig. 4, respectively.
Fig. 3.
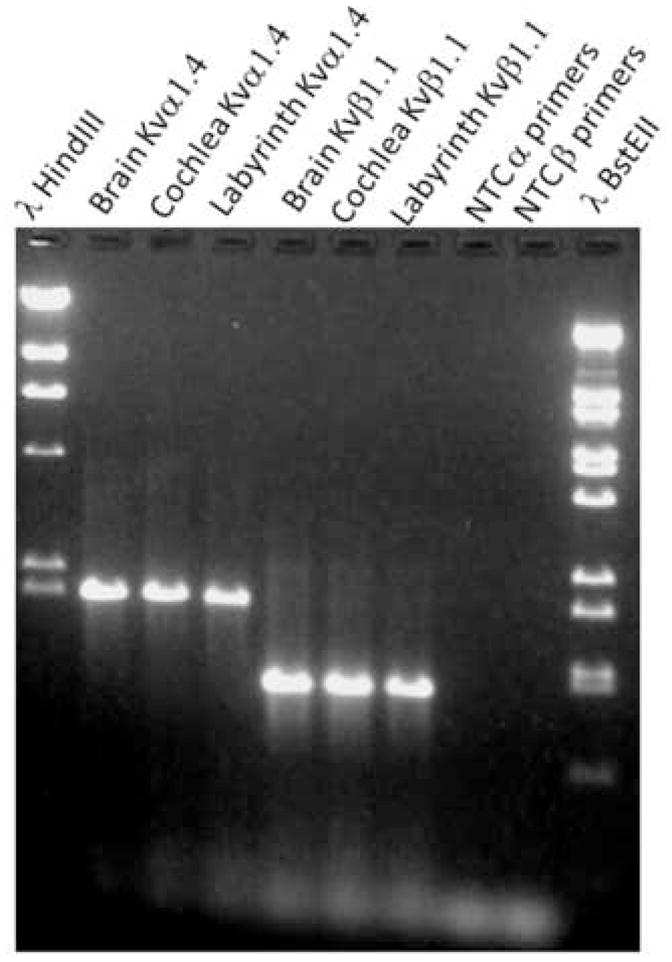
A PAGE gel that resulted from RT-PCR analysis using pKvα1.4 and pKvβ1.1 primers. The lysates were from 14–15 day old pigeon embryos. The lysates were obtained from different organs (brain, cochlea and labyrinth (semicircular canals and utricles)). The lysates (10μg/lane), in sample buffer, were plated into lanes 2–7. The same ladders used in Fig. 1 are shown in lanes 1 and 10. The absence of product illustrated in lanes 8 and 9 resulted from no-template controls for each of the primer pairs (lanes 8 and 9). Primer dimer products (faint bands) are present at the bottom of the gel.
Fig. 4.
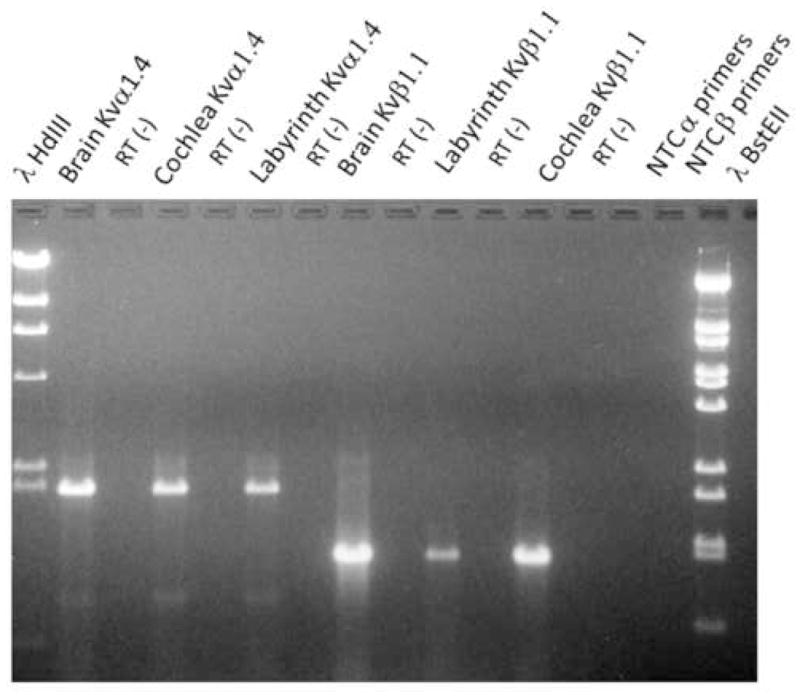
A PAGE gel that resulted from RT-PCR analysis using pKvα1.4 and pKvβ1.1 primers. RNA lysate (10μg/lane) was obtained using adult pigeon brain, cochlea and labyrinth. Amplicons can be seen in lanes 2, 4, 8, 10 and 12. However, in alternate lanes (3, 5, 7, 9, 11 and 13), and in lanes 14 and 15 there is no product. This absence of product resulted from two sets of negative controls. In one set, the RT step (RT (−)) was omitted and in the other, template was omitted for each of the primer pairs. The faint bands at locations other than 1989 bp and 1208 bp were not seen in other gels and were not sequenced. It can be noticed that there is variation in brightness of bands when Kvβ1.1 primers were used even though the same amount of lysate was used. The brightest band was found when brain lysate was used followed by cochlea lysate followed by labyrinth lysate.
Fig. 3 demonstrates that pKvα1.4 and pKvβ1.1 transcripts are found in the brain, cochlea and labyrinths of 14 – 15 day pigeon embryos. Fig. 4 reveals that the same messages are present in adult pigeons. This result suggests that these transcripts are present throughout the pigeon’s life.
While the amplicons for Kvα1.4 are equally intense for RNA from each tissue source in the adult pigeon, the intensity of the Kvβ1.1 product is less bright but present in the labyrinth of the adult animal. However, we have no corroborative evidence to suggest that pKvβ1.1 is down regulated in the adult pigeon labyrinth. In both Figs. 3 and 4 the no- template negative controls (NTC) showed no product. Kvα1.4 and Kvβ1.1 message has been demonstrated previously in the avian developing cochlea (Rajeevan et al., 1999) but the presence of these transcripts in the unborn and adult avian labyrinth and brain is new.
Fig. 5 illustrates the unmasking of the A-type current from the other outward conductances known to be present in pigeon utricular type II hair cells. In addition to the A-type potassium conductance, there is outward delayed rectifier potassium conductance that is sensitive to linopiridine and XE991 (Rennie et al., 2001). Additionally, there is an outward calcium activated potassium conductance IK(Ca) (Lang and Correia, 1989) and four inward currents (Lang and Correia, 1989; Correia, 1992; Masetto and Correia, 1997; Correia et al., 2004). Fig. 5A shows the voltage protocol used and the resulting current traces during the prepulses and test pulse. No inactivating current is present during the test pulse following the −30 mV pre-pulse. This current is comprised of IKD and IK(Ca) and inward currents. Fig. 5D shows the trace that results when the two traces shown during the test pulse in Fig. 5A are subtracted from one another. Overlaid on the subtracted trace is the best fitted curve (dark line) resulting from the evaluation of Eq. 1 from 80% of the peak to the end of the test pulse. Inset Rf and Rs values show that the proportion of Rs in this cell is below average (0.42) and the proportion of Rf is above average (0.42). Figs. 5B and Fig. 5C show traces with fitted curves and with Rf values below average and near the average, respectively.
Fig. 6 presents histograms showing the distributions of Rf, Rs and Rf combined with Rs.
Fig. 6.
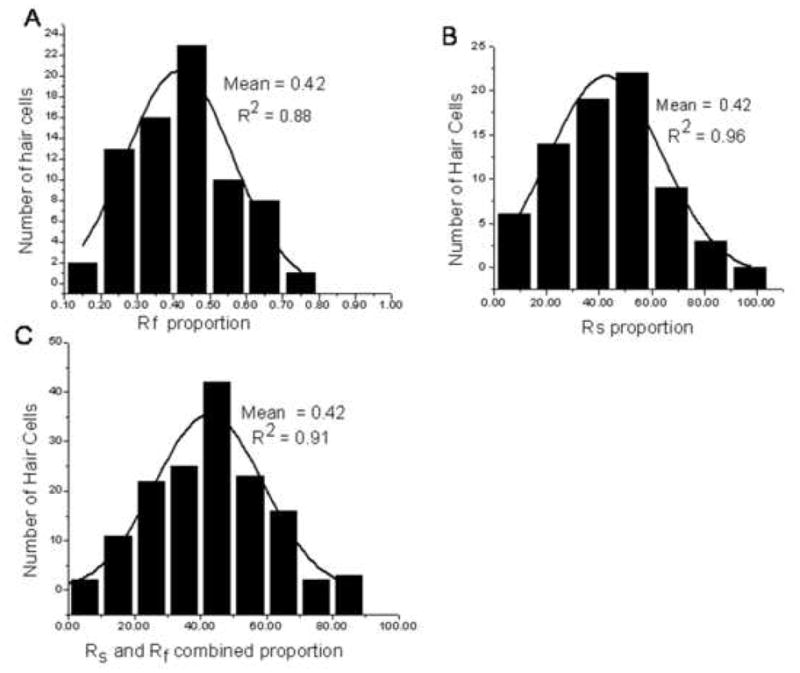
Histograms summarizing the proportion of the fast (Rf) and slow (Rs) components of current inactivation. Each histogram is based on 72 utricular type II hair cells. Each bar histogram is overlaid by a curve generated from best fitted equations for a Gaussian distribution. In all cases the histograms were well fitted by the equation for a normal distribution (Kolmogorov-Smirnov test P < 0.001). Inset in each histogram panel are the mean and R2 values. Notice that the distributions for Rf (A), Rs (B) and Rf + Rs (C) are unimodal. There was no significant difference (P > 0.05) between the Rf and Rs means when tested using the ANOVA Tukey post hoc test.
Three points are illustrated in these figures. First, the histograms are unimodal, second they are well fit by a Gaussian distribution (P < 0.001, Kolmogorov – Smirnov test) and third the mean for Rf, Rs and Rf + Rs are equal to each other. This is different from the case of type II hair cells in the frog (Norris et al., 1992) where the Rf distribution is bimodal.
Figure 7 illustrates the effects of various concentrations of 4-AP on the total current in utricular type II hair cells. Each data point in the graph is the ratio of total current measured during a test pulse before and after the application of 4-AP. The denominator of the ratio is the peak current before 4-AP and the numerator is a corresponding point at the same time in the test pulse after application of 4-AP.
It can be seen that when a saturating dose of 4-AP was used, the total current and IA (because of the specificity of 4-AP for blocking IA), was reduced 46% at the asymptotic value (indicated by the dotted line). The mean data points in the graph were fitted with a one site binding equation (Eq. 5). Evaluation of Eq. 5 resulted in the dark thick curve. The best fitted parameters inserted in the equation which produced the curve are inset in the figure. From the parameters of the best fitted curve the AP IC50 = 11μM and is indicated by solid lines projected on to each axis.
Figs. 8B–D illustrate representative ionic currents in CHO cells during the test pulse of the voltage protocol shown in Fig. 8A. In Fig. 8B only pKvβ1.1 was transiently transfected into the cell; in Fig. 8C only pKvα1.4 was transiently transfected into the cell and in Fig. 8D both pKvα1.4 + pKvβ1.1 were co-transfected into the cell.
It can be noticed that no current (zero current indicated by dashed line) was observed during the test pulse when only pKvβ1.1 was transfected into the CHO cell. In Fig. 8C inactivation was seen when pKvα1.4 was transfected into the cell. The inactivation was accelerated when pKvα1.4 and pKvβ1.1 were co-transfected into the cell (Fig. 8D). Also, it can be noticed that when large amplitude hyperpolarizing prepulses were used; the current amplitude was larger in CHO cells co-transfected with pKvα1.4 and pKvβ1.1 compared to cells transfected with only pKvα1.4.
Fig. 9 illustrates current traces, during the test pulse, in CHO cells expressing pKvα1.4 alone (A–B) and those expressing pKvα1.4 + pKvβ1.1 (C–D). It can be noticed that the decay seems accelerated in the CHO cells co-transfected with pKvα1.4 + pKvβ1.1. The current traces do not return to zero because of the duration of the test pulse and residual leak currents.
Fig. 9.
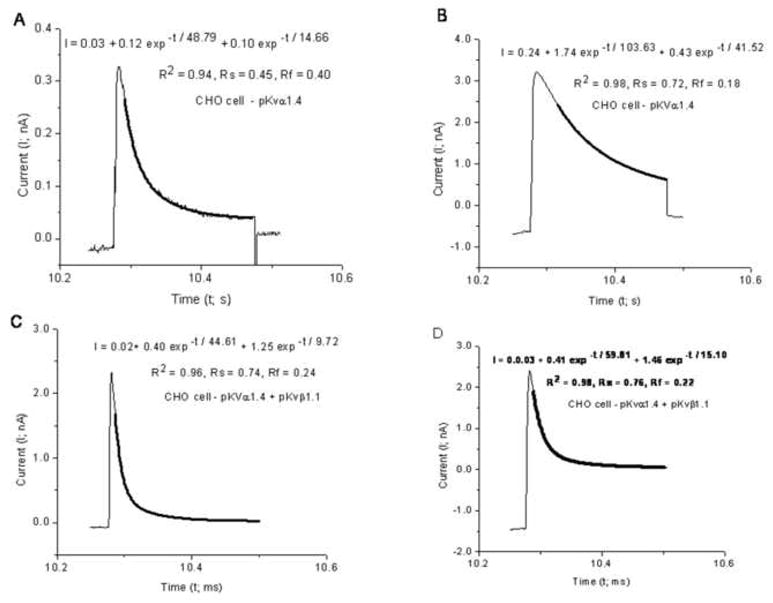
Currents measured during the test pulse (+10 mV) from different CHO cells transfected with either (A–B) pKva1.4 alone or co-transfected with (C–D) pKvβ1.1. The dark overlaid curves represent the best fitted sum of two exponentials. The equations that generated these curves with best fitted parameters are inset as is R2, Rf and Rs. Note that the inactivation is accelerated in C–D compared to A–B.
Fig. 10 compares mean data for (A) amplitude and (B) steady state inactivation properties in CHO cells expressing pKvα1.4 + pKvβ1.1 and those expressing pKvα1.4 alone.
Fig. 10.
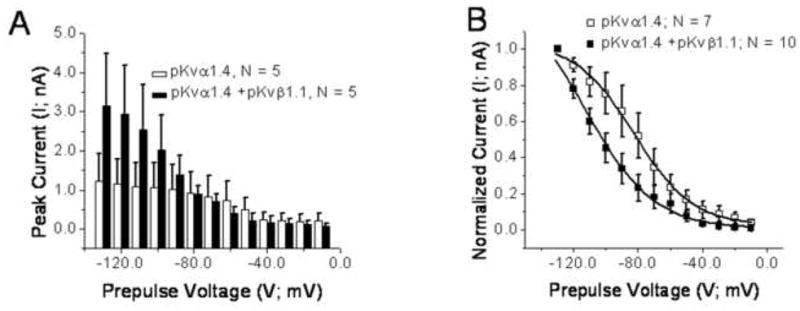
Plots of mean current (± SEM) in CHO cells transfected with pKvα1.4 alone (white symbols) and co-transfected with pKvα1.4 + pKvβ1.1 (black symbols). The numbers of cells contributing to the means are inset in the graphs. (A) Histogram showing the mean current during the protocol shown in Fig. 8A. It can be seen that the currents for co-transfection of pKvα1.4 and pKvβ1.1 produce larger amplitudes on average, particularly for large negative prepulses. A Tukey post hoc test for a univariate general model produced a significant difference (P < 0.001) between mean amplitudes across prepulse voltages when pKvα1.4 and pKvα1.4 + pKvβ1.1 were compared. (B) Mean (±SEM) normalized current plotted as a function of prepulse voltage. The solid lines are evaluations of best fitted Boltzmann equations (Eq. 4). For pKvα1.4, I = 0.025 + (1.040 – 0.025)/(1 + exp ((V − (−82.729)/18.143)); R2 = 0.99; for pKvα1.4 + pKvβ1.1, I = 0.006 + (1.337 – 0.006/(1 + exp ((V + (−113.025)/21.237)); R2 = 0.99. The V0 value for the best fitted Boltzmann curves in Panel B showed a shift of 30 mV in the hyperpolarized direction for cells transfected with pKvα1.4 + pKvβ1.1 when compared to CHO cells transfected with pKvα1.4 alone.
In Fig. 10, it can be seen that for large hyperpolarizing pre-pulses, the amplitudes are greater on average for cells expressing pKvα1.4 + pKvβ1.1 but, as the pre-pulses become more depolarized the difference inverts. One reason for this inversion is that the mean amplitudes do not decay exponentially in cells transfected with pKvα1.4 as they do with cells transfected with Kvα1.4 and Kvβ1.1. The reason for this difference in mean decay remains unknown. However, across all pre-pulse voltage levels there is a statistically significant difference between the mean amplitudes for Kvα1.4 vs. Kvα1.4 + Kvβ1.1 (P < 0.001, ANOVA Tukey post test).
In Fig. 10B normalized current (I/Imax) is plotted as a function of prepulse voltage for cells expressing pKvα1.4 + pKvβ1.1 and those expressing pKvα1.4 alone. Boltzmann functions (Eq. 4) were fitted to the plots. The V0 voltage for the best fitted Boltzmann curve for cells expressing pKvα1.4 + pKvβ1.1 was found to be −113 mV and for cells expressing pKvα1.4 alone was −83 mV; thus a leftward shift of 30 mV. Equations with best fitted coefficients are presented in the Fig. 10 legend. Thus, co-transfection of the beta subunit with the alpha subunit causes a hyperpolarized shift in the steady state inactivation curve.
The histograms in Fig. 11 compare the amplitudes (framed inset) and time constants for native hair cells, CHO cells transfected with pKvα1.4 and CHO cells co-transfected with pKvα1.4 and pKvβ1.1. The histograms on the left side of the figure correspond to the best fitted time constant obtained from fitting a single exponential to time dependent inactivation of the current; the histograms on the right side of the figure correspond to the two best fitted time constants derived from fitting the sum of two exponentials to the current inactivation. The amplitude corresponds to the peak response minus any baseline shift.
Fig. 11.
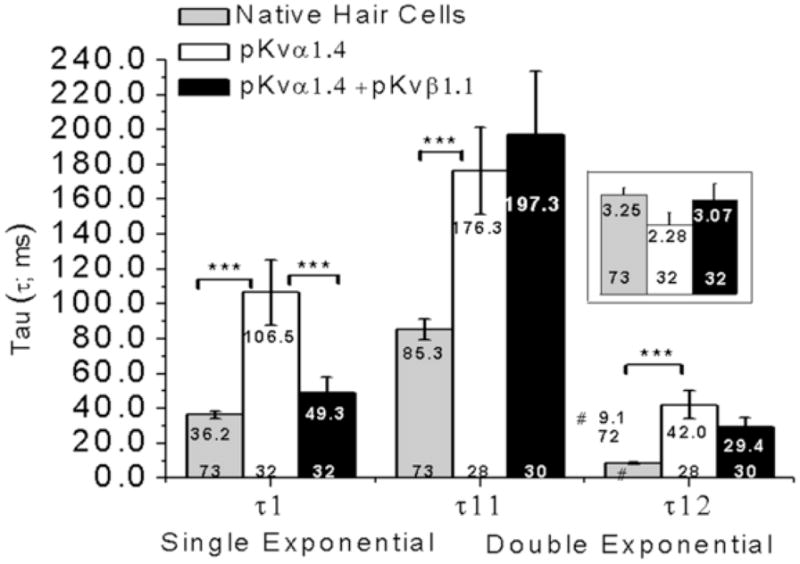
Histograms of mean amplitudes (inset in framed rectangle) and mean best fitted time constants (inset in each bar). The time constants were obtained from fitting current inactivation with a single exponential (τ1) and the sum of two exponential functions (τ11 and τ12). The mean value is shown at the top of each bar and the number of observations at the bottom. ANOVA Tukey post-test comparisons are indicated by downward ticks pointing at the bars compared. Statistical significance is designated by asterisks indicating the statistical level of significance; *** = P < 0.001.
Comparison of the means for the single exponential fit indicates that the time constant for both native cells and cells transfected with pKvα1.4 + pKvβ1.1 was statistically significantly shorter than the time constant for cells transfected with pKvα1.4 alone (ANOVA, Tukey post hoc test, P < 0.001). Moreover, on average, native cells may co-express pKvα1.4 + pKvβ1.1 since there is no significant difference between τ1 for native hair cells when directly compared to CHO cells co-expressing pKvα1.4 and pKvβ1.1 (t = 1.66, d.f. = 38, P = 0.105). When the sum of two exponentials was fitted to the current inactivation, the mean time constants τ11 and τ12 were was significantly shorter in native cells when compared to cells transfected with pKvα1.4 (ANOVA, Tukey post hoc test, P < 0.001).
DISCUSSION
The major novel findings of this paper are: (1) Kvα1.4 and Kvβ1.1 transcripts are found in the pigeon brain, pigeon cochlea and pigeon labyrinth (Figs. 1–4). (2) Transcripts for the above alpha and beta subunits are presumably present throughout development in the brain, cochlea and labyrinths of the pigeon since both 14–15 day embryos and adults express the transcripts (Fig. 3–4). (3) The pKvα1.4 open reading frame for the sequence cloned from pigeon labyrinth, cochlea and brain contain conserved residues (Fig 2) previously shown to be associated with N-type and C-type shaker inactivation (Zagotta et al., 1989; Hoshi et al., 1990; Zagotta and Aldrich, 1990; Hoshi et al., 1991; Tseng-Crank et al., 1993) as well as inactivation caused by association of Kvα1.4 and Kvβ1.1 subunits (Rettig et al., 1994). (4) The pKα1.4 and pKvβ1.1 N-terminus ORFs contain serine/cystine residues followed by a positive amino acid (K, R, R, K) motif (Fig. 2C) that correspond to the α ball and chain inactivating domain of the pKvα1.4 subunit (Rettig et al., 1994; Heinemann et al., 1995; Nagaya and Papazian, 1997) and the β ball and chain inactivating domain of the pKvβ1.1 subunit (Rettig et al., 1994; Imbrici et al., 2006). Thus, pKvα1.4 and pKvβ1.1 possess the residues supporting the α – and β – ball and chain analogy for the N-type inactivated state (Hoshi et al., 1990). (5) Pharmacological properties (Fig. 7) of the A-type current in pigeon utricular type II native hair cells produced unanticipated findings. Using a one-site binding model, the IC50 for 4-AP binding was found to be 11 μM and the saturation binding concentration was found to be ~1 mM. The IC50 concentration of 11 μM corresponds closely to an IC50 for 4-AP of 10 μM obtained for the A-type current in cochlear outer hair cells (Nenov et al., 1997) but the saturation binding concentration (complete block) is an order of magnitude less than 10–12 mM noted for frog saccular (Catacuzzeno et al., 2003) and semicircular canal hair cells (Russo et al., 1995). A second surprising result was that when the sum of two exponentials was fitted to the current inactivation of IA in pigeon native utricular hair cells and parameters Rf (Eq. 2) and Rs (Eq. 3) were calculated, a unimodal normal distribution (Fig. 6) and not a bimodal distribution was obtained for Rf and Rs. In frog semicircular canal type II hair cells, the distribution of Rf, an indicator of the proportion of “fast” inactivation, was bimodally distributed indicating two classes of hair cells; one with fast inactivation and one with slow inactivation. This is apparently not the case for pigeon utricular type II hair cells. (6) CHO cells, transiently transfected with pKvα1.4, pKvβ1.1 and co-transfected with pKvα1.4 and pKvβ1.1, produced the following results: No current was produced in cells transfected with pKvβ1.1 alone (Fig. 8B). To our knowledge there are no reports of Kvβ subunit transfection alone producing ionic currents except when they are co-transfected with Kvα subunits. Kvα1.4 transfected into CHO cells produce current inactivation fitted by a mean single exponential time constant of τ1=107 ms (± 19, n = 32). This mean time constant was larger than mean single time constants for native hair cell inactivation, τ1=36 ms (± 2, n = 73), or inactivation in CHO cells with co-expression of pKvα1.4 and pKvβ1.1; τ1=49 ms (± 7, n = 32). As indicated in Fig. 11, the differences were statistically significant. The mean amplitude of the isolated peak A-type current measured in CHO cells transfected with pKvα1.4 alone (2.28 nA ± 0.39, n = 32) was less than the mean peak amplitude measured in CHO cells transfected with pKvα1.4 and pKvβ1.1 (3.07 nA ± 0.53, n = 32) and native hair cells (3.25 nA ± 0.23, n = 32).. These differences were not statistically significant (ANOVA Tukey post test P >0.05). However, when mean amplitudes obtained from CHO cells transfected with pKvα1.4 were compared with mean amplitudes of CHO cells co-transfected with pKvα1.4 and pKvβ1.1 following prepulses of different voltage levels (Fig. 10), the mean amplitudes across all pre-pulse voltage levels were significantly different (ANOVA univariate general linear model Tukey post test P < 0.001). These results suggest that native hair cells may contain co-assembled and associated pKvα1.4 and pKvβ1.1 subunit complexes and that these associated subunits shorten the inactivation time constant fitted by a single exponential function and increase the peak amplitude. These results are consistent findings of other investigators using transcripts from other tissues in other heterologous systems (Rettig et al., 1994; Imbrici et al., 2006).
The mean square error was reduced by 20% or greater in 88% of the native hair cells when fitted by the sum of 2 exponentials. No attempt was made to constrain the fit by using the best fitted τ1 as a start value for τ11. The improvement in mean square error suggests that most of the time, the sum of 2 exponentials equations fitted the data better than the equation for a single exponential. This finding provides a rationale for the use of the Rf and Rs parameters. (7) Using the protocol shown in Fig. 8A, peak and normalized current amplitude for CHO cells transfected with pKvα1.4 alone and co-transfected with pKvα1.4 and pKvβ1.1 were plotted in Fig 10 as a function of prepulse voltage. In the case of the data plotted in Fig. 10B, Boltzmann functions were fitted to the curves for each cell type. It can be visualized in the plots and deduced from the best fitted parameters of the fitted Boltzmann functions that co-transfection of pKvα1.4 and pKvβ1.1 caused a negative shift in the voltage dependence of inactivation. From the best fitted parameters given in the Fig. 10 legend it can be concluded that the co-transfection of pKvα1.4 and pKvβ1.1 shifted the inactivation curves 30 mV in the hyperpolarizing direction. These findings are supported by previous results in other systems. England et al. (1995) studied hKvβ3 and hKvα1.5 in the human heart. They found that association of the alpha and beta subunits, following injection into oocytes, accelerated inactivation and shifted the inactivation curve 18 mV in a hyperpolarizing direction and slowed deactivation of the expressed current. Imbrici et al. (2006) found that human Kvβ1.1 and Kvβ1.2 subunits injected into oocytes modulated the functional properties of tandemly linked Kv1.4-1.1 wild-type channels expressed in the oocytes. The modulation included among other things a) increasing the rate and amount of N-type inactivation, b) slowing the rate of recovery from inactivation (a feature associated with C-type inactivation), and c) negatively shifting the voltage dependence of inactivation.
We cloned both the alpha (pKvα1.4) and beta (pKvβ1.1) subunit from pigeon and demonstrated the expression of both subunits in brain, cochlea and labyrinth of embryos and adults; we showed that the subunits’ ORFs contain the appropriate conserved residues to produce N- and C- type inactivation and to associate into an alpha-beta subunit complex. For comparison, we isolated an A-type current from utricular type II hair cells in epithelial slices. We confirmed its identity as an A-type potassium current by its voltage and pharmacological properties. We studied the current by fitting the single and double exponential functions to the current’s inactivation. We found that in contrast to frog semicircular canal type II hair cells (Norris et al., 1992; Russo et al., 2007), there were not two “classes” of A-type currents based on speed of inactivation but one group of cells with inactivation parameters Rf and Rs normally distributed about the mean which was roughly 50% slow and 50% fast. This fact along with our inability to find alternatively spliced sequences for the alpha subunit and the probable absence of introns in the gene coding for pKvα1.1 cause us to suggest that only one class of IA channels are found in pigeon utricular hair cells. For this class of channels, however, motifs (Fig. 2) are present to support N-type and C-type inactivation of the A-type current in pigeon utricular hair cells modeled by the “ball and chain” mechanism in the alpha subunit (pKvα1.4) (Hoshi et al., 1990; Hoshi et al., 1991; Rasmusson et al., 1995). Our discovery of the (pKvβ1.1) subunits makes us suspect that co-assembly and association of pKvα1.4 and pKvβ1.1 takes place in pigeon utricular type II hair cells. Moreover, when pKvβ1.1 associates with pKvα1.4, the time constant of inactivation is shortened, the peak amplitude is increased and the voltage dependence of the inactivation is displaced 30 mV in a hyperpolarized direction.
Finally, we suggest that the model of association of alpha and beta subunits, each with ball and chain mechanisms (as supported by our electrophysiological and molecular biology results), provides a flexible molecular explanation for differences in inactivation properties seen in pigeon utricular type II hair cells (Weng and Correia, 1999). Furthermore, this model furnishes another mechanism for the modulation of the hair cell membrane potential because association of alpha and beta subunits causes a shift in the steady state inactivation curve and makes IA more or less available following small depolarizations.
Acknowledgments
Molly Behymer, Leroy Hung and Deon Uffort contributed to the data analysis. The authors thank the following colleagues for reading and commenting on the manuscript: Federica Farinelli Ph.D., and Gang Q. Li M.D. This work was supported in part by a grant from the NIH (NIDCD # DC-10273) to MJC.
ABBREVIATIONS
- IA
A-type potassium current
- 4-AP
4-aminopyridine
- N
NH3 terminus
- C
COOH terminus
- CHO
Chinese hamster ovary
- PC
personal computer
- PIPES
Piperazine-N,N′-bis-2-ethanesulfonic acid
- HEPES
N-(2-Hydroxyethyl) piperazine-N′-(ethanesulfonic acid)
- DIC
differential interference contrast
- DMSO
dimethyl sulfoxide
- EGFP
enhanced green fluorescent protein
- DMEM
Dulbecco’s modified Eagle’s medium
- PAGE
polyacrylamide gel electrophoresis
- ORF
open reading frame
- RT – PCR
reverse transcriptase – polymerase chain reaction
- IA
A-type potassium current
- R2
coefficient of determination
Footnotes
Publisher's Disclaimer: This is a PDF file of an unedited manuscript that has been accepted for publication. As a service to our customers we are providing this early version of the manuscript. The manuscript will undergo copyediting, typesetting, and review of the resulting proof before it is published in its final citable form. Please note that during the production process errors may be discovered which could affect the content, and all legal disclaimers that apply to the journal pertain.
References
- Beckh S, Pongs O. Members of the RCK potassium channel family are differentially expressed in the rat nervous system. EMBO J. 1990;9:777–782. doi: 10.1002/j.1460-2075.1990.tb08173.x. [DOI] [PMC free article] [PubMed] [Google Scholar]
- Bett GC, Rasmusson RL. Inactivation and recovery in Kv1.4 K+ channels: lipophilic interactions at the intracellular mouth of the pore. J Physiol. 2004;556:109–120. doi: 10.1113/jphysiol.2003.055012. [DOI] [PMC free article] [PubMed] [Google Scholar]
- Catacuzzeno L, Fioretti B, Franciolini F. Voltage-gated outward K currents in frog saccular hair cells. J Neurophysiol. 2003;90:3688–3701. doi: 10.1152/jn.00308.2003. [DOI] [PubMed] [Google Scholar]
- Comer MB, Campbell DL, Rasmusson RL, Lamson DR, Morales MJ, Zhang Y, Strauss HC. Cloning and characterization of an Ito-like potassium channel from ferret ventricle. Am J Physiol. 1994;267:H1383–H1395. doi: 10.1152/ajpheart.1994.267.4.H1383. [DOI] [PubMed] [Google Scholar]
- Connor JA, Stevens CF. Prediction of repetitive firing behaviour from voltage clamp data on an isolated neurone soma. J Physiol. 1971;213:31–53. doi: 10.1113/jphysiol.1971.sp009366. [DOI] [PMC free article] [PubMed] [Google Scholar]
- Correia MJ. Filtering properties of hair cells. Ann N Y Acad Sci. 1992;656:49–57. doi: 10.1111/j.1749-6632.1992.tb25199.x. [DOI] [PubMed] [Google Scholar]
- Correia MJ, Wood TG, Prusak D, Weng T, Rennie KJ, Wang HQ. Molecular characterization of an inward rectifier channel (IKir) found in avian vestibular hair cells: cloning and expression of pKir2.1. Physiol Genomics. 2004;19:155–169. doi: 10.1152/physiolgenomics.00096.2004. [DOI] [PubMed] [Google Scholar]
- England SK, Uebele VN, Shear H, Kodali J, Bennett PB, Tamkun MM. Characterization of a voltage-gated K+ channel beta subunit expressed in human heart. Proc Natl Acad Sci U S A. 1995;92:6309–6313. doi: 10.1073/pnas.92.14.6309. [DOI] [PMC free article] [PubMed] [Google Scholar]
- Fuchs PA. Ionic currents in cochlear hair cells. Progress in Neurobiology. 1992;39:493–505. doi: 10.1016/0301-0082(92)90003-w. [DOI] [PubMed] [Google Scholar]
- Griguer C, Kros CJ, Sans A, Lehouelleur J. Potassium currents in type II vestibular hair cells isolated from the guinea-pig’s crista ampullaris [published erratum appears in Pflugers Arch 1994 May;427(1–2):193] Pflugers Arch. 1993;425:344–352. doi: 10.1007/BF00374185. [DOI] [PubMed] [Google Scholar]
- Halliwell JV, Othman IB, Pelchen-Matthews A, Dolly JO. Central action of dendrotoxin: selective reduction of a transient K conductance in hippocampus and binding to localized acceptors. Proc Natl Acad Sci U S A. 1986;83:493–497. doi: 10.1073/pnas.83.2.493. [DOI] [PMC free article] [PubMed] [Google Scholar]
- Heinemann SH, Rettig J, Wunder F, Pongs O. Molecular and functional characterization of a rat brain Kv beta 3 potassium channel subunit. FEBS Lett. 1995;377:383–389. doi: 10.1016/0014-5793(95)01377-6. [DOI] [PubMed] [Google Scholar]
- Hoshi T, Zagotta WN, Aldrich RW. Biophysical and molecular mechanisms of Shaker potassium channel inactivation. Science. 1990;250:533–538. doi: 10.1126/science.2122519. [DOI] [PubMed] [Google Scholar]
- Hoshi T, Zagotta WN, Aldrich RW. Two types of inactivation in Shaker K+ channels: effects of alterations in the carboxy-terminal region. Neuron. 1991;7:547–556. doi: 10.1016/0896-6273(91)90367-9. [DOI] [PubMed] [Google Scholar]
- Hudspeth AJ, Lewis RS. A model for electrical resonance and frequency tuning in saccular hair cells of the bull-frog, Rana catesbeiana. Journal of Physiology. 1988;400:275–297. doi: 10.1113/jphysiol.1988.sp017120. [DOI] [PMC free article] [PubMed] [Google Scholar]
- Imbrici P, D’Adamo MC, Kullmann DM, Pessia M. Episodic ataxia type 1 mutations in the KCNA1 gene impair the fast inactivation properties of the human potassium channels Kv1.4-1.1/Kvbeta1.1 and Kv1.4-1.1/Kvbeta1.2. Eur J Neurosci. 2006;24:3073–3083. doi: 10.1111/j.1460-9568.2006.05186.x. [DOI] [PubMed] [Google Scholar]
- Lang DG, Correia MJ. Studies of solitary semicircular canal hair cells in the adult pigeon. II. Voltage-dependent ionic conductances. J Neurophysiol. 1989;62:935–945. doi: 10.1152/jn.1989.62.4.935. [DOI] [PubMed] [Google Scholar]
- Lennan GW, Steinacker A, Lehouelleur J, Sans A. Ionic currents and current-clamp depolarisations of type I and type II hair cells from the developing rat utricle. Pflugers Arch. 1999;438:40–46. doi: 10.1007/s004240050877. [DOI] [PubMed] [Google Scholar]
- Lewis RS, Hudspeth AJ. Voltage- and ion-dependent conductances in solitary vertebrate hair cells. Nature. 1983;304:538–541. doi: 10.1038/304538a0. [DOI] [PubMed] [Google Scholar]
- Masetto S, Correia MJ. Electrophysiological properties of vestibular sensory and supporting cells in the labyrinth slice: Before and during regeneration. J Neurophysiol. 1997;78:1913–1927. doi: 10.1152/jn.1997.78.4.1913. [DOI] [PubMed] [Google Scholar]
- Masetto S, Russo G, Prigioni I. Differential expression of potassium currents by hair cells in thin slices of frog crista ampullaris. J Neurophysiol. 1994;72:443–455. doi: 10.1152/jn.1994.72.1.443. [DOI] [PubMed] [Google Scholar]
- Masetto S, Russo G, Prigioni I. Regional distribution of hair cell ionic currents in frog vestibular epithelium. Annals of the New York Academy of Sciences. 1996;19(781):663–665. doi: 10.1111/j.1749-6632.1996.tb15753.x. [DOI] [PubMed] [Google Scholar]
- Murrow BW, Fuchs PA. Preferential expression of transient potassium current (IA) by ‘short’ hair cells of the chick’s cochlea. Proceedings of the Royal Society of London - Series B: Biological Sciences. 1990;242:189–195. doi: 10.1098/rspb.1990.0123. [DOI] [PubMed] [Google Scholar]
- Nagaya N, Papazian DM. Potassium channel alpha and beta subunits assemble in the endoplasmic reticulum! Lost Data. 1997;272:3022–3027. doi: 10.1074/jbc.272.5.3022. [DOI] [PubMed] [Google Scholar]
- Nenov AP, Norris C, Bobbin RP. Outwardly rectifying currents in guinea pig outer hair cells. Hearing Research. 1997;105:146–158. doi: 10.1016/s0378-5955(96)00207-9. [DOI] [PubMed] [Google Scholar]
- Norris CH, Ricci AJ, Housley GD, Guth PS. The inactivating potassium currents of hair cells isolated from the crista ampullaris of the frog. J Neurophysiol. 1992;68:1642–1653. doi: 10.1152/jn.1992.68.5.1642. [DOI] [PubMed] [Google Scholar]
- Rasmusson RL, Morales MJ, Castellino RC, Zhang Y, Campbell DL, Strauss HC. C-type inactivation controls recovery in a fast inactivating cardiac K+ channel (Kv1.4) expressed in Xenopus oocytes. J Physiol. 1995;489 (Pt 3):709–721. doi: 10.1113/jphysiol.1995.sp021085. [DOI] [PMC free article] [PubMed] [Google Scholar]
- Rennie KJ, Weng T, Correia MJ. Effects of KCNQ channel blockers on K(+) currents in vestibular hair cells. Am J Physiol Cell Physiol. 2001;280:C473–C480. doi: 10.1152/ajpcell.2001.280.3.C473. [DOI] [PubMed] [Google Scholar]
- Rettig J, Heinemann SH, Wunder F, Lorra C, Parcej DN, Dolly JO, Pongs O. Inactivation properties of voltage-gated K+ channels altered by presence of beta-subunit. Nature. 1994;369:289–294. doi: 10.1038/369289a0. [DOI] [PubMed] [Google Scholar]
- Rudy B. Diversity and ubiquity of K channels. Neuroscience. 1988;25:729–749. doi: 10.1016/0306-4522(88)90033-4. [DOI] [PubMed] [Google Scholar]
- Ruppersberg JP, Stocker M, Pongs O, Heinemann SH, Frank R, Koenen M. Regulation of fast inactivation of cloned mammalian IK(A) channels by cysteine oxidation. Nature. 1991;352:711–714. doi: 10.1038/352711a0. [DOI] [PubMed] [Google Scholar]
- Russo G, Calzi D, Martini M, Rossi ML, Fesce R, Prigioni I. Potassium currents in the hair cells of vestibular epithelium: position-dependent expression of two types of A channels. Eur J Neurosci. 2007;25:695–704. doi: 10.1111/j.1460-9568.2007.05327.x. [DOI] [PubMed] [Google Scholar]
- Russo G, Masetto S, Prigioni I. Isolation of A-type K+ current in hair cells of the frog crista ampullaris. Neuroreport. 1995;6:425–428. doi: 10.1097/00001756-199502000-00005. [DOI] [PubMed] [Google Scholar]
- Sewing S, Roeper J, Pongs O. Kv beta 1 subunit binding specific for shaker-related potassium channel alpha subunits. Neuron. 1996;16:455–463. doi: 10.1016/s0896-6273(00)80063-x. [DOI] [PubMed] [Google Scholar]
- Smotherman MS, Narins PM. The electrical properties of auditory hair cells in the frog amphibian papilla. J Neurosci. 1999;19:5275–5292. doi: 10.1523/JNEUROSCI.19-13-05275.1999. [DOI] [PMC free article] [PubMed] [Google Scholar]
- Sugihara I, Furukawa T. Morphological and functional aspects of two different types of hair cells in the goldfish sacculus. J Neurophysiol. 1989;62:1330–1343. doi: 10.1152/jn.1989.62.6.1330. [DOI] [PubMed] [Google Scholar]
- Tamkun MM, Knoth KM, Walbridge JA, Kroemer H, Roden DM, Glover DM. Molecular cloning and characterization of two voltage-gated K+ channel cDNAs from human ventricle. FASEB J. 1991;5:331–337. doi: 10.1096/fasebj.5.3.2001794. [DOI] [PubMed] [Google Scholar]
- Tseng-Crank J, Yao JA, Berman MF, Tseng GN. Functional role of the NH2-terminal cytoplasmic domain of a mammalian A-type K channel. J Gen Physiol. 1993;102:1057–1083. doi: 10.1085/jgp.102.6.1057. [DOI] [PMC free article] [PubMed] [Google Scholar]
- Weng T, Correia MJ. Regional distribution of ionic currents and membrane voltage responses of type II hair cells in the vestibular neuroepithelium. J Neurophysiol. 1999;82:2451–2461. doi: 10.1152/jn.1999.82.5.2451. [DOI] [PubMed] [Google Scholar]
- Zagotta WN, Aldrich RW. Alterations in activation gating of single Shaker A-type potassium channels by the Sh5 mutation. J Neurosci. 1990;10:1799–1810. doi: 10.1523/JNEUROSCI.10-06-01799.1990. [DOI] [PMC free article] [PubMed] [Google Scholar]
- Zagotta WN, Hoshi T, Aldrich RW. Gating of single Shaker potassium channels in Drosophila muscle and in Xenopus oocytes injected with Shaker mRNA. Proc Natl Acad Sci U S A. 1989;86:7243–7247. doi: 10.1073/pnas.86.18.7243. [DOI] [PMC free article] [PubMed] [Google Scholar]


