Abstract
The 2H,13C,15N-labeled, 148-residue integral membrane protein OmpX from Escherichia coli was reconstituted with dihexanoyl phosphatidylcholine (DHPC) in mixed micelles of molecular mass of about 60 kDa. Transverse relaxation-optimized spectroscopy (TROSY)-type triple resonance NMR experiments and TROSY-type nuclear Overhauser enhancement spectra were recorded in 2 mM aqueous solutions of these mixed micelles at pH 6.8 and 30°C. Complete sequence-specific NMR assignments for the polypeptide backbone thus have been obtained. The 13C chemical shifts and the nuclear Overhauser effect data then resulted in the identification of the regular secondary structure elements of OmpX/DHPC in solution and in the collection of an input of conformational constraints for the computation of the global fold of the protein. The same type of polypeptide backbone fold is observed in the presently determined solution structure and the previously reported crystal structure of OmpX determined in the presence of the detergent n-octyltetraoxyethylene. Further structure refinement will have to rely on the additional resonance assignment of partially or fully protonated amino acid side chains, but the present data already demonstrate that relaxation-optimized NMR techniques open novel avenues for studies of structure and function of integral membrane proteins.
About one-third of the genes in living organisms are assumed to encode integral membrane proteins (e.g., refs. 1–3), and three-dimensional (3D) structure determination of this class of proteins is fundamental to the understanding of a wide spectrum of biological functions. Notwithstanding the crucial importance of work in this area, the database of 3D membrane protein structures is still small, which reflects the challenge presented by this class of molecules to structural biologists. In particular, the solution NMR techniques that commonly are applied with biological macromolecules (e.g., refs. 4 and 5) so far only in few instances have been used with membrane proteins (e.g., refs. 6 and 7) or membrane-binding polypeptides (e.g., refs. 8 and 9), whereby appropriate detergents were used to keep the proteins in solution. Suitable micelles for such studies must ensure the structural and functional integrity of the membrane protein, should be a good mimic of the natural environment in the cell membrane, and need to be sufficiently small to allow rapid Brownian motions of the mixed micelles in solution (e.g., refs. 10–12). The large size of the structures obtained upon reconstitution and solubilization of membrane proteins in detergent micelles actually has limited the application of solution NMR techniques to such systems because of the slow tumbling in solution and the concomitantly large linewidths. New NMR techniques are now available to extend the size limits for NMR in solution, i.e., transverse relaxation-optimized spectroscopy (TROSY) (13) and cross-correlated relaxation-enhanced polarization transfer (CRINEPT) (14), and high-quality NMR spectra have been presented for proteins in structures with molecular masses of up to and beyond 100 kDa (15, 16). It was suggested previously that studies of membrane proteins reconstituted in soluble micelles would be particularly attractive applications of these new techniques (14, 17–20). In this paper, we document an initial implementation of this approach with the outer membrane protein X from Escherichia coli (OmpX).
The integral membrane protein OmpX consists of a polypeptide chain with 148 amino acid residues and a molecular mass of 16.5 kDa. The biological function of OmpX is not known, although it has been suggested that it binds foreign proteins on the E. coli cell surface, possibly as part of a cellular defense mechanism, and that this binding affinity is used to achieve cell adhesion and invasion (21–23). A crystal structure of OmpX has been solved at 1.9-Å resolution (23). It shows an eight-stranded, antiparallel β-barrel, with loops or tight turns connecting successive pairs of β-strands and a remarkable array of aromatic side chains facing the membrane interior on the OmpX surface.
Relaxation-optimized NMR techniques (13, 14) enable the recording of high-resolution spectra with large structures in solution, but because the complexity of the NMR spectra increases with the size of the molecule studied, their preferred current use is with large structures that yield rather simple spectra (15, 17–20). In studies with membrane proteins solubilized in micelles, this can be achieved by suitable isotope labeling, where the unlabeled detergent or/and lipid molecules do not interfere with the observation of the NMR signals of the 13C- and 15N-labeled protein, although they usually represent a large fraction of the overall mass of the mixed micelles.
Materials and Methods
Production of OmpX and NMR Sample Preparation.
OmpX was overexpressed in E. coli BL21(DE3)pLysS cells harboring the plasmid pET3b-OmpX. Transformed cells first were grown at 37°C in 10 ml of LB and then were inoculated directly in 1 liter of isotope-labeled minimal medium (24). For the preparation of the uniformly 2H,13C,15N-labeled protein, 1 g/liter 15NH4Cl (>98% 15N), and 6 g/liter [13C6]glucose (>98% 13C) were dissolved in 99% D2O, and the culture was grown at 37°C. At OD600 ≈ 0.3, protein overexpression was induced with 1 mM isopropyl β-d-thiogalactopyranoside, and the cells were harvested by centrifugation once they had reached the stationary phase at OD600 ≈ 0.5, which was attained approximately 5 h after induction. The pellet was resuspended in a buffer containing 20 mM Tris⋅HCl and 5 mM EDTA (TE buffer) at pH = 8.0 and sonicated for 20 min on ice. The solution was centrifuged at 4°C for 1 h at 4,300 × g. Then, the pellet was homogenized in 2% (vol/vol) Triton X-100 in TE buffer at pH 8.0 and shaken for 20 min at 37°C. The solution was centrifuged again at 4°C for 1 h at 4,300 × g, and the pellet was resuspended in TE buffer at pH 8.0, shaken for 1 h at 37°C, and centrifuged as above. The new pellet was dissolved in 6 M guanidine hydrochloride (Gdn⋅HCl) in TE buffer at pH 8.5 and shaken for 2 h at 37°C. Finally, the solution was centrifuged for 20 min at 14,300 × g, and the supernatant was retained for the protein reconstitution in dihexanoyl phosphatidylcholine (DHPC) micelles.
Solubilization and reconstitution of OmpX into detergent micelles was performed by slowly diluting the protein solution in 6 M Gdn⋅HCl into a 6-fold excess of refolding buffer [3% DHPC (Avanti Polar Lipids)/20 mM Tris⋅HCl/5 mM EDTA/0.6 M l-arginine, pH 8.5] at 4°C, using a peristaltic pump. The OmpX/DHPC solution then was dialyzed against 2.5 liters of dialysis buffer (20 mM Tris/5 mM EDTA/100 mM NaCl, pH 8.5) at 4°C for 20 min, using a 15-ml Slide-A-Lyzer 10-kDa-cutoff dialysis cassette (Pierce) to remove the residual Gdn⋅HCl and l-arginine. The short duration of the dialysis is critical, because otherwise too much DHPC would be lost, resulting in OmpX precipitation. The protein solution was concentrated to 2 ml in a Biomax 10-kDa ultrafiltration device (Millipore). This solution then was transferred to a Centricon ultrafiltration device with 10-kDa molecular mass cutoff (Millipore), and the dialysis buffer was exchanged against the NMR buffer (20 mM phosphate/100 mM NaCl/0.05% NaN3/3% DHPC/3% D2O, pH 6.8) by successive concentration/dilution steps. Finally, the sample was concentrated to a volume of 300 μl. The detergent concentration in the OmpX/DHPC NMR sample was checked by analysis of one-dimensional 1H-NMR spectra and adjusted to 300 mM by adding solid DHPC to the solution. The final protein concentration was about 2 mM.
NMR Spectroscopy.
All NMR experiments were recorded at 30°C on a Bruker DRX750 spectrometer (Bruker, Karlsruhe, Germany) equipped with four radio-frequency channels for generating the 1H, 2H, 13C and 15N pulses, and a 1H-{13C,15N}-triple resonance probe head with an actively shielded z-gradient coil. The following parameters were used for the individual experiments: two-dimensional (2D) [15N,1H]-TROSY (13) and 2D [15N,1H]-COSY (correlation spectroscopy; ref. 25) [data size 150(t1) × 1,024(t2) complex points, t1max(15N) = 65.7 ms, t2max(1H) = 97.5 ms]; 3D [15N,1H]-TROSY-HNCA (HNCA, amide proton-to-nitrogen-to-α-carbon correlation; ref. 26) and 3D HNCA (27) [data size 35(t1) × 60(t2) × 1,024(t3) complex points, t1max(15N) = 15.3 ms, t2max(13C) = 12 ms, t3max(1H) = 75.6 ms]; 3D [15N,1H]-TROSY-HNCACB (28) [35(t1) × 82(t2) × 1,024(t3) complex points, t1max(15N) = 15.3 ms, t2max(13C) = 7.5 ms, t3max(1H) = 75.6 ms]; 3D [15N,1H]-TROSY-HN(CO)CA (28) [34(t1) × 44(t2) × 1,024(t3) complex points, t1max(15N) = 14.9 ms, t2max(13C) = 8.8 ms, t3max(1H) = 75.6 ms]; [15N,1H]-TROSY-HNCO (26) [35(t1) × 40(t2) × 1,024(t3) complex points, t1max(15N) = 15.3 ms, t2max(13C) = 10.6 ms, t3max(1H) = 75.6 ms]; and [1H,1H]-NOESY-[15N,1H]-TROSY (29) [31(t1) × 128(t2) × 1,024(t3) complex points, t1max(15N) = 13.6 ms, t2max(1H) = 14.2 ms, t3max(1H) = 75.6 ms, nuclear Overhauser effect spectroscopy (NOESY) mixing time 300 ms]. All experiments were recorded with 32 scans. Before Fourier transformation, the data matrices were multiplied with a 65°-shifted sine bell window in the acquisition dimension and a 75°-shifted sine bell window in the indirect dimensions (30). For data processing and spectral analysis we used the programs prosa (31) and xeasy (32), respectively.
Results and Discussion
Following the procedures described by Pautsch et al. (33), OmpX was expressed in E. coli, isolated from inclusion bodies, and reconstituted in DHPC micelles. The purity of OmpX was better than 97%, as judged by SDS/PAGE, N-terminal sequencing, and NMR spectroscopy. Using the protocol described in Materials and Methods, which does not include any chromatography step, we obtained yields after solubilization of the protein pellet in 6 M Gdn⋅HCl of about 25 mg of OmpX per liter of minimal medium in 99% D2O. The yield after refolding and consecutive purification was about 15 mg of OmpX per liter of this growth medium.
The choice of the detergent was a critical factor for obtaining high-quality NMR spectra of OmpX in aqueous solution. Concentrated solutions of DHPC (up to 400 mM) have relatively low viscosity, which supports obtaining NMR spectra with narrow linewidths. The optimal detergent concentration for solubilizing OmpX was determined by analyzing a series of 2D [15N,1H]-TROSY spectra recorded at a protein concentration of 2 mM with variable DHPC concentration. Below about 50 mM DHPC, the NMR lines were broad and some signals were not observed at all. Above about 100 mM DHPC, the lines became sharper and the protein linewidths did not change significantly when the DHPC concentration was increased further up to 400 mM. Based on these observations, all NMR experiments were performed at 30°C with the following sample of OmpX/DHPC: 2 mM OmpX in 97% H2O/3% D2O containing 20 mM phosphate buffer at pH 6.8, 100 mM NaCl, and 300 mM DHPC.
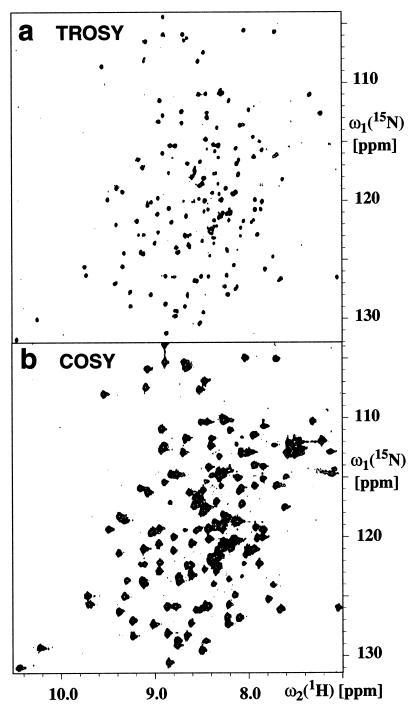
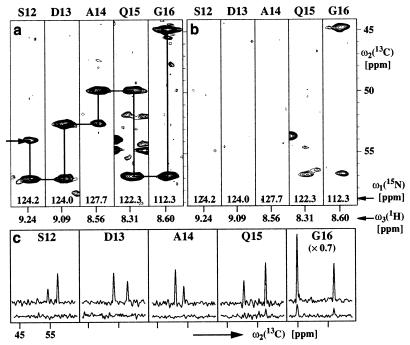
Fig. 1 compares a 2D [15N,1H]-TROSY spectrum of OmpX/DHPC with a conventional 2D [15N,1H]-HSQC spectrum of the same sample measured under identical conditions. The two spectra clearly contain peaks in the same positions, except that some signals from side-chain 15N—1H2 groups near (ω1 = 113 ppm, ω2 = 7.5 ppm) are absent in the [15N,1H]-TROSY spectrum of Fig. 1a (13, 29). However, the lines in the [15N,1H]-TROSY spectrum of Fig. 1a are much narrower than the corresponding signals in the [15N,1H]-COSY spectrum (Fig. 1b), and, hence, the crowded spectral regions are much better resolved in Fig. 1a than in Fig. 1b. From comparison of the line shapes in the two spectra of Fig. 1 and from 15N-spin relaxation measurements (34, 35), we estimate that the effective rotational correlation time for the 15N—1H bonds is of the order of 25 ns, which indicates that the molecular mass of the OmpX/DHPC mixed micelles is larger than 60,000 Da. This size estimate is in good agreement with the sensitivity gain observed in the [15N,1H]-TROSY-HNCA experiment when compared with the corresponding conventional HNCA spectrum (26), because, for interior residues, an approximately 10-fold enhancement is observed (Fig. 2c).
Figure 1.
Contour plots of 15N—1H correlation spectra measured with a 2 mM solution of 2H,13C,15N-labeled OmpX in DHPC micelles (20 mM phosphate/100 mM NaCl/0.05% NaN3/300 mM DHPC/3% 2H2O/solvent H2O, pH 6.8, T = 30°C) at a 1H resonance frequency of 750 MHz. (a) 2D [15N,1H]-TROSY. (b) 2D [15N,1H]-COSY. The two spectra were recorded and processed identically (see text). The measuring time for each spectrum was 4 h.
Figure 2.
(a) [ω2(13C), ω3(1H)] strips from a 3D [15N,1H]-TROSY-HNCA spectrum. The strips were taken at the 15N chemical shifts (indicated at the bottom of the strips) of residues 12–16 and are centered about the corresponding 1HN chemical shifts. At the top of each strip, the sequence-specific assignment is indicated by the one-letter amino acid symbol and the sequence position. Horizontal and vertical lines connect the intraresidual and sequential HNCA connectivities and, thus, outline the sequential assignment pathway. (b) Same presentation as a for the corresponding 3D HNCA spectrum. (c) Cross sections along the ω2(13C) dimension through the peaks in a and b. The upper traces correspond to the 3D [15N,1H]-TROSY-HNCA spectrum shown in a, and the lower ones correspond to the conventional 3D HNCA spectrum shown in b.
Sequence-Specific Resonance Assignments.
Similar to previous observations with the 110-kDa protein DHNA (15), the improved line shape in the [15N,1H]-TROSY spectrum (Fig. 1) corresponds to a sensitivity gain of one to two orders of magnitude in TROSY-type triple resonance experiments (26) when compared with the corresponding conventional triple resonance schemes (Fig. 2). This enabled obtaining sequence-specific resonance assignments for OmpX/DHPC, using the 3D [15N,1H]-TROSY-HNCA, 3D [15N,1H]-TROSY-HNCACB, and 3D [15N,1H]-TROSY-HN(CO)CA experiments (15) (Fig. 3a). In addition, a large proportion of the resonance assignments were confirmed independently by using a 3D [1H,1H]-NOESY- [15N,1H]-TROSY spectrum (see the following section).
Figure 3.
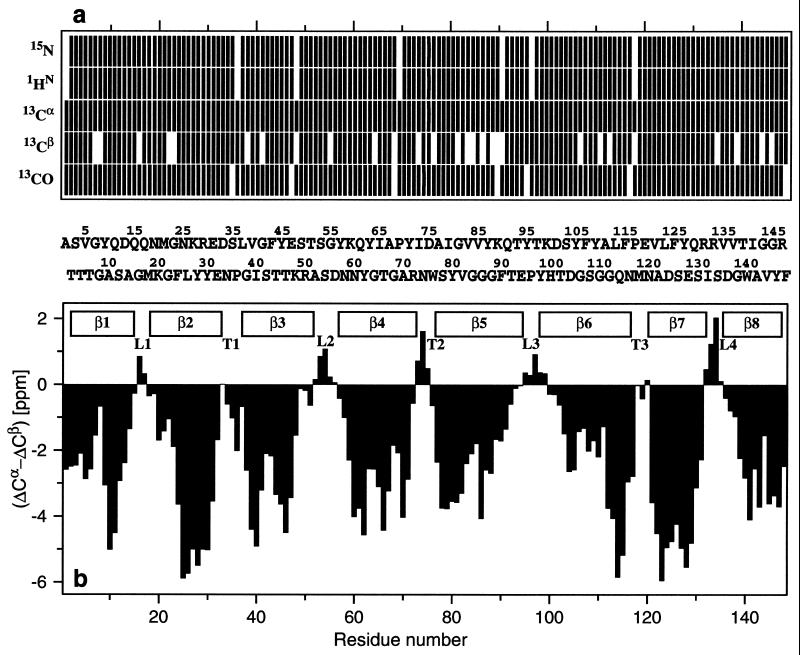
(a) Survey of the NMR assignments for OmpX/DHPC
obtained by TROSY-type triple-resonance experiments. The residues for
which the 1HN, 15N,
13Cα, 13Cβ, and
13CO chemical shifts have been assigned are indicated by
vertical bars in the respective rows. In the center, separating
a and b, the amino acid sequence is
indicated by the one-letter amino acid symbols, where the entries have
been distributed over two rows, i.e., residue 1 is in the upper row,
residue 2 is in the lower row, etc. (b) Plot of
(ΔCα − ΔCβ) vs. the amino acid
sequence. ΔCα and ΔCβ were obtained as
the differences between the experimental 13Cα
and 13Cβ chemical shifts in OmpX/DHPC and
the corresponding random coil shifts. The value of
(ΔCα − ΔCβ) for a particular
residue i represents the average over the three
consecutive residues i − 1, i and
i + 1, and was calculated as follows:
 (41). Negative values of
(ΔCα − ΔCβ) indicate that residue
i is located in a regular β-strand (positive values
would indicate location in a regular helical structure). The positions
of the regular secondary structure elements in the crystal structure of
OmpX are indicated at the top, and the external loops (L) and
periplasmatic turns (T) are labeled according to Vogt and Schulz
(23).
In the 3D [15N,1H]-TROSY-HNCA experiment (Fig. 2a) a 10-fold sensitivity gain was obtained on average when compared with the conventional 3D HNCA spectrum (Fig. 2b). As observed previously for the water-soluble, 110-kDa protein 7,8-dihydroneopterin aldolase (DHNA) (15), larger enhancements are seen for residues in the protein core, whereas smaller enhancements prevail for flexible loops near the protein surface. Examples of relatively high and low sensitivity gains in Fig. 2 are 15-fold and 5-fold signal enhancements for Ser-12 and Gly-16, respectively (Fig. 2c). For all 15N—1H moieties in OmpX/DHPC, the cross-peaks corresponding to the sequentially preceding and the intraresidual 13Cα atoms could be detected unambiguously in the 3D [15N,1H]-TROSY-HNCA spectra (Figs. 2 a and c and 3a). For comparison, a conventional 3D HNCA spectrum (27) was recorded under identical conditions (Fig. 2b). For only 14 of the 148 residues of OmpX/DHPC, the intraresidual and sequential HNCA connectivities both could be detected, and for 16 additional residues, the intraresidual connectivity was observed.
In some instances the sequential and intraresidual peaks could not be distinguished unambiguously in the 3D [15N,1H]-TROSY-HNCA spectrum, either because of peak overlap or because the two peaks had nearly equal intensity. In these cases, the sequential connectivities were identified in a 3D [15N,1H]-TROSY-HN(CO)CA spectrum (28). In the 3D [15N,1H]-TROSY-HNCACB spectrum, only part of the sequential 13Cβ peaks could be observed, which is due to the inherently lower sensitivity of this experiment when compared with 3D [15N,1H]-TROSY-HNCA. However, the intraresidual 13Cβ connectivities were observed for all residues, so that the information on the 13Cβ chemical shifts is also available. Overall, the extent of the assignments is 98% for the backbone 1HN and 15N spins, 100% for 13Cα, 94% for 13Cβ, and 98% for 13CO (Fig. 3). The chemical shift lists have been deposited with the BioMagResBank (http://www.bmrb.wisc.edu) under the accession number 4936.
Regular Secondary Structure Identification.
Information on the secondary structure in OmpX/DHPC was obtained from the 13C chemical shifts (37–40) and from 1H–1H NOEs. The differences between the 13Cα and 13Cβ chemical shifts observed in OmpX and the corresponding random coil values, ΔCα and ΔCβ, were evaluated, and in Fig. 3b, the parameter (ΔCα − ΔCβ) is plotted vs. the OmpX sequence. Consecutive residues with negative values of (ΔCα − ΔCβ) have been shown to reflect the presence of β-strands in soluble proteins (37–41). The β-strands thus identified for OmpX/DHPC agree identically with those in the x-ray crystal structure of OmpX (23), indicating that the well-established secondary structure identification from 13C chemical shifts in soluble proteins works in similar ways for membrane proteins reconstituted in water-soluble micelles.
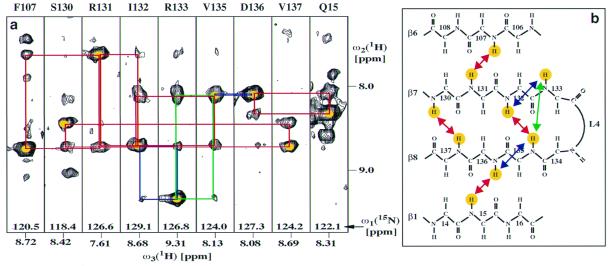
The arrangement of the eight β-strands identified in Fig. 3 into one or several β-sheets was investigated by identification of long-range dNN(i,j) NOEs (4) in a 3D [1H,1H]-NOESY-[15N,1H]-TROSY spectrum recorded with a NOESY mixing time of 300 ms. Fig. 4a presents [ω1(1H), ω3(1H)] strips with interstrand dNN(i,j) NOEs from this experiment. For each pair of neighboring β-strands, a sufficient number of dNN(i,j) NOEs could be assigned unambiguously to establish the relative orientation of the β-strands and to predict the hydrogen-bonding register (Fig. 4b). These data are again in agreement with the crystal structure (23). As an additional benefit, the data from the 3D [1H,1H]-NOESY-[15N,1H]-TROSY spectrum afforded an independent check of a large proportion of the sequential assignments obtained with the 3D triple-resonance experiments (Fig. 3a).
Figure 4.
(a) [ω1(1H), ω3(1H)] strips from a 3D [1H,1H]-NOESY-[15N,1H]-TROSY spectrum taken at the 15N chemical shifts of the residues indicated at the top of each strip. Yellow dots indicate diagonal peaks, blue lines connect sequential dNN cross-peaks with the diagonal peaks, green lines indicate medium-range dNN(i,i+2) NOEs, and red lines show long-range dNN(i,j) NOEs between neighboring β-strands. (b) Positions in the OmpX structure of the NOEs in the spectral regions shown in a. The same color code as in a is used to identify the amide protons that correspond to the diagonal peaks in a and for the arrows that indicate the NOE connectivities.
3D Structure Calculation.
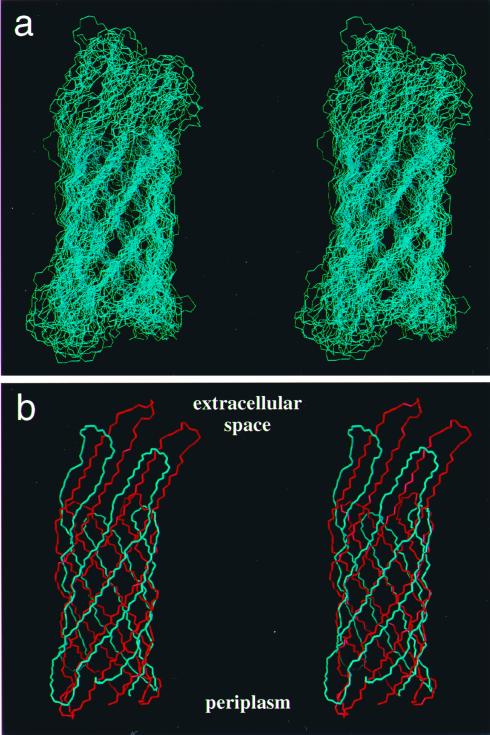
To test the comprehensiveness of the set of conformational constraints obtained with the presently described procedures, we performed a structure calculation with the program dyana (42). Distance constraints for the structure calculation were obtained from a 3D [1H,1H]-NOESY-[15N,1H]-TROSY spectrum with a mixing time of 300 ms. The program dyana was used to convert the NOE intensities into upper-distance limits and to derive constraints for the backbone torsion angles φ and ψ from Cα chemical-shift values (40). The final input consisted of 107 upper-limit distance constraints derived from 1HN—1HN NOEs of the kind shown in Fig. 4 and 140 dihedral angle constraints derived from the 13Cα chemical shifts, i.e., for all residues with ΔCα values smaller than −1.5 ppm, the dihedral angles were constrained to −200° ≤ φ ≤ −80° and 40° ≤ ψ ≤ 220° (40). The final structure was calculated by using the torsion angle dynamics protocol of dyana with 8,000 steps, and it was started with 100 randomized conformers. The 20 conformers with the lowest final dyana target function values were used to represent the 3D fold of OmpX in DHPC micelles. The statistics on the structure calculation (Table 1) show that only low precision was achieved, as expected from this type of input data. This is clearly visualized in a superposition of the 20 dyana conformers (Fig. 5a), which also shows, however, that the polypeptide backbone fold can be followed readily. A comparison of the mean NMR structure with the x-ray crystal structure (23) shows good qualitative coincidence of the global backbone fold (Fig. 5b).
Table 1.
Structure calculation for OmpX in DHPC micelles with the program DYANA
| Quantity | Value* |
|---|---|
| NOE upper distance limits | 107 |
| Dihedral angle constraints† | 140 |
| Residual target function, Å2 | 0.07 ± 0.03 |
| Residual NOE violations | |
| Number >0.1 Å | 0 |
| Maximum, Å | 0.08 ± 0.05 |
| Residual angle violations | |
| Number >2.0° | 0 |
| Maximum, ° | 0.01 ± 0.01 |
| Average pairwise rmsd, Å | |
| Backbone atoms (2–147) | 3.96 ± 0.43 |
| Backbone of β-sheet‡ | 3.11 ± 0.32 |
Except for the top two entries, the average for the 20 energy-minimized conformers with the lowest residual dyana target function values and the standard deviation among them are given.
Ψ, φ dihedral angle constraints were obtained from the 13Cα chemical shifts as described in ref. 40 and implemented in the macro cashifts of dyana (ref. 42; see text).
The β-sheet comprises the eight strands 2–14, 20–32, 37–51, 57–72, 77–94, 98–118, 121–132, and 135–147 (Fig. 3b).
Figure 5.
Stereoviews of the polypeptide backbone fold in OmpX. (a) Superposition of the 20 dyana conformers that were selected to represent the NMR structure of OmpX. The superposition is for pairwise global best fit of the N, Cα, and C′ backbone atoms of the β-sheet amino acid residues in conformers 2–20 with the corresponding atoms in the conformer with the smallest residual target function value (Table 1). (b) Comparison of the mean NMR structure (blue) and the x-ray crystal structure (red) after superposition as in a. Periplasmatic and extracellular spaces are indicated according to ref. 23. The figure was prepared with the program molmol (43).
Conclusions
The results presented in this paper demonstrate that transverse relaxation-optimized NMR spectroscopy (13–20) could be used for obtaining polypeptide backbone assignments for a membrane protein reconstituted in soluble detergent micelles, in much the same ways as TROSY was applied previously for obtaining assignments of an oligomeric soluble protein of molecular mass of 110 kDa (15). The sequence-specific polypeptide backbone assignments thus obtained represent a foundation for studies of dynamic processes by relaxation measurements and for establishing structure–activity relationships by investigating binding of membrane proteins to smaller ligands (44). Although the backbone assignments were sufficient for a low-precision definition of the chainfold in OmpX, a similar result can only be anticipated for other β-barrel folds. Broader use of solution NMR techniques for structural studies of reconstituted membrane proteins will be contingent on further methods development for additional assignments of at least part of the amino acid side chains.
Acknowledgments
We thank J. Vogt and G. E. Schulz for kindly providing the plasmid used to produce OmpX, Prof. K. Pervushin for helpful discussions in the early phases of the project, and Mrs. M. Geier for the careful processing of the manuscript. Financial support was obtained from the Schweizerischer Nationalfonds (Project 31.49047.96).
Abbreviations
- 2D and 3D
two- and three-dimensional
- COSY
correlation spectroscopy
- NOE
nuclear Overhauser effect
- NOESY
NOE spectroscopy
- TROSY
transverse relaxation-optimized spectroscopy
- HNCA
amide proton-to-nitrogen-to-α-carbon correlation
- OmpX
outer membrane protein X from E. coli
- DHPC
dihexanoyl phosphatidylcholine (1,2-dihexanoyl-sn-glycero-3-phosphocholine)
- Gdn⋅HCl
guanidine hydrochloride
Footnotes
Data deposition: The chemical shift lists reported in this paper have been deposited with the BioMagResBank, www.bmrb.wisc.edu (accession no. 4936).
References
- 1.Walker J E, Saraste M. Curr Opin Struct Biol. 1996;6:457–459. doi: 10.1016/s0959-440x(96)80109-6. [DOI] [PubMed] [Google Scholar]
- 2.Kühlbrandt W, Gouaux E. Curr Opin Struct Biol. 1999;9:445–447. doi: 10.1016/S0959-440X(99)80062-1. [DOI] [PubMed] [Google Scholar]
- 3.Bowie J. Curr Opin Struct Biol. 2000;10:435–437. doi: 10.1016/s0959-440x(00)00111-1. [DOI] [PubMed] [Google Scholar]
- 4.Wüthrich K. NMR of Proteins and Nucleic Acids. New York: Wiley; 1986. [Google Scholar]
- 5.Cavanagh J, Fairbrother W J, Palmer A G, III, Skelton N J. Protein NMR Spectroscopy. Principles and Practice. New York: Academic; 1996. [Google Scholar]
- 6.Opella S J. Nat Struct Biol. 1997;4:845–848. [PubMed] [Google Scholar]
- 7.Marassi F M, Opella S J. Curr Opin Struct Biol. 1998;8:640–648. doi: 10.1016/s0959-440x(98)80157-7. [DOI] [PMC free article] [PubMed] [Google Scholar]
- 8.Braun W, Wider G, Lee K H, Wüthrich K. J Mol Biol. 1983;169:921–948. doi: 10.1016/s0022-2836(83)80143-0. [DOI] [PubMed] [Google Scholar]
- 9.Pervushin K, Orekhov V Y, Popov A I, Musina L Y, Arseniev A S. Eur J Biochem. 1994;219:571–583. doi: 10.1111/j.1432-1033.1994.tb19973.x. [DOI] [PubMed] [Google Scholar]
- 10.McDonnell P A, Opella S. J Magn Reson B. 1993;102:120–125. [Google Scholar]
- 11.Vinogradova O, Sönnichsen F, Sanders C R, II. J Biomol NMR. 1998;4:381–386. doi: 10.1023/a:1008289624496. [DOI] [PubMed] [Google Scholar]
- 12.Sanders C R, Oxenoid K. Biochem Biophys Acta Biomembr. 2000;1508:129–145. doi: 10.1016/s0005-2736(00)00308-4. [DOI] [PubMed] [Google Scholar]
- 13.Pervushin K, Riek R, Wider G, Wüthrich K. Proc Natl Acad Sci USA. 1997;94:12366–12371. doi: 10.1073/pnas.94.23.12366. [DOI] [PMC free article] [PubMed] [Google Scholar]
- 14.Riek R, Wider G, Pervushin K, Wüthrich K. Proc Natl Acad Sci USA. 1999;96:4918–4923. doi: 10.1073/pnas.96.9.4918. [DOI] [PMC free article] [PubMed] [Google Scholar]
- 15.Salzmann M, Pervushin K, Wider G, Senn H, Wüthrich K. J Am Chem Soc. 2000;122:7543–7548. [Google Scholar]
- 16.Salzmann M, Pervushin K, Wider G, Senn H, Wüthrich K. J Biomol NMR. 1999;14:85–88. doi: 10.1023/a:1008346931993. [DOI] [PubMed] [Google Scholar]
- 17.Wüthrich K. Nat Struct Biol. 1998;5:492–495. doi: 10.1038/728. [DOI] [PubMed] [Google Scholar]
- 18.Wider G, Wüthrich K. Curr Opin Struct Biol. 1999;9:594–601. doi: 10.1016/s0959-440x(99)00011-1. [DOI] [PubMed] [Google Scholar]
- 19.Riek R, Pervushin K, Wüthrich K. Trends Biochem Sci. 2000;25:462–468. doi: 10.1016/s0968-0004(00)01665-0. [DOI] [PubMed] [Google Scholar]
- 20.Pervushin K. Q Rev Biophys. 2000;333:161–197. doi: 10.1017/s0033583500003619. [DOI] [PubMed] [Google Scholar]
- 21.de Kort G, Bolton A, Martin G, Stephen J, van de Klundert J A. Infect Immunol. 1994;62:4722–4726. doi: 10.1128/iai.62.11.4722-4726.1994. [DOI] [PMC free article] [PubMed] [Google Scholar]
- 22.Stoorvogel J, van Bussel M J, van de Klundert J A. FEMS Microbiol Lett. 1987;48:277–281. [Google Scholar]
- 23.Vogt J, Schulz G E. Structure (London) 1999;7:1301–1309. doi: 10.1016/s0969-2126(00)80063-5. [DOI] [PubMed] [Google Scholar]
- 24.Hochuli M, Szyperski T, Wüthrich K. J Biomol NMR. 2000;17:33–42. doi: 10.1023/a:1008329124672. [DOI] [PubMed] [Google Scholar]
- 25.Mori S, Abeygunawardana C, O'Neil Johnson M, van Zijl P C M. J Magn Reson B. 1995;108:94–98. doi: 10.1006/jmrb.1995.1109. [DOI] [PubMed] [Google Scholar]
- 26.Salzmann M, Pervushin K, Wider G, Senn H, Wüthrich K. Proc Natl Acad Sci USA. 1998;95:13585–13590. doi: 10.1073/pnas.95.23.13585. [DOI] [PMC free article] [PubMed] [Google Scholar]
- 27.Grzesiek S, Bax A. J Magn Reson. 1992;96:432–440. [Google Scholar]
- 28.Salzmann M, Wider G, Pervushin K, Senn H, Wüthrich K. J Am Chem Soc. 1999;121:844–848. [Google Scholar]
- 29.Pervushin K, Braun D, Fernández C, Wüthrich K. J Biomol NMR. 2000;17:195–202. doi: 10.1023/a:1008399320576. [DOI] [PubMed] [Google Scholar]
- 30.DeMarco A, Wüthrich K. J Magn Reson. 1976;24:201–204. [Google Scholar]
- 31.Güntert P, Dötsch V, Wider G, Wüthrich K. J Biomol NMR. 1992;2:619–629. [Google Scholar]
- 32.Bartels C, Xia T, Billeter M, Güntert P, Wüthrich K. J Biomol NMR. 1995;5:1–10. doi: 10.1007/BF00417486. [DOI] [PubMed] [Google Scholar]
- 33.Pautsch A, Vogt J, Model K, Siebold C, Schulz G E. Proteins Struct Funct Gen. 1999;34:167–172. [PubMed] [Google Scholar]
- 34.Kay L E, Torchia D A, Bax A. Biochemistry. 1989;28:8972–8979. doi: 10.1021/bi00449a003. [DOI] [PubMed] [Google Scholar]
- 35.Szyperski T, Luginbühl P, Otting G, Wüthrich K. J Biomol NMR. 1993;3:151–164. doi: 10.1007/BF00178259. [DOI] [PubMed] [Google Scholar]
- 36.Salzmann M, Wider G, Pervushin K, Wüthrich K. J Biomol NMR. 1999;15:181–184. doi: 10.1023/a:1008358030477. [DOI] [PubMed] [Google Scholar]
- 37.Spera S, Bax A. J Am Chem Soc. 1991;113:5490–5492. [Google Scholar]
- 38.Wishart D S, Sykes B D, Richards F M. J Mol Biol. 1991;222:311–333. doi: 10.1016/0022-2836(91)90214-q. [DOI] [PubMed] [Google Scholar]
- 39.Wishart D S, Sykes B D. J Biomol NMR. 1994;4:171–180. doi: 10.1007/BF00175245. [DOI] [PubMed] [Google Scholar]
- 40.Luginbühl P, Szyperski T, Wüthrich K. J Magn Reson. 1995;109:229–233. [Google Scholar]
- 41.Metzler W J, Constantine K L, Friedrichs M S, Bell A J, Ernst E G, Lavoie T B, Mueller L. Biochemistry. 1993;32:13818–13829. doi: 10.1021/bi00213a010. [DOI] [PubMed] [Google Scholar]
- 42.Güntert P, Mumenthaler C, Wüthrich K. J Mol Biol. 1997;273:283–298. doi: 10.1006/jmbi.1997.1284. [DOI] [PubMed] [Google Scholar]
- 43.Koradi R, Billeter M, Wüthrich K. J Mol Graphics. 1996;14:51–55. doi: 10.1016/0263-7855(96)00009-4. [DOI] [PubMed] [Google Scholar]
- 44.Shuker S B, Hajduk P J, Meadows R P, Fesik S W. Science. 1996;274:1531–1534. doi: 10.1126/science.274.5292.1531. [DOI] [PubMed] [Google Scholar]


