Abstract
GABA type A receptors (GABAA-Rs) are potential targets of ethanol. However, there are multiple subtypes of this receptor, and, thus far, individual subunits have not been definitively linked with specific ethanol behavioral actions. Interestingly, though, a chromosomal cluster of four GABAA-R subunit genes, including α2 (Gabra2), was associated with human alcoholism (Am J Hum Genet 74:705–714, 2004; Pharmacol Biochem Behav 90:95–104, 2008; J Psychiatr Res 42:184–191, 2008). The goal of our study was to determine the role of receptors containing this subunit in alcohol action. We designed an α2 subunit with serine 270 to histidine and leucine 277 to alanine mutations that was insensitive to potentiation by ethanol yet retained normal GABA sensitivity in a recombinant expression system. Knockin mice containing this mutant subunit were tested in a range of ethanol behavioral tests. These mutant mice did not develop the typical conditioned taste aversion in response to ethanol and showed complete loss of the motor stimulant effects of ethanol. Conversely, they also demonstrated changes in ethanol intake and preference in multiple tests. The knockin mice showed increased ethanol-induced hypnosis but no difference in anxiolytic effects or recovery from acute ethanol-induced motor incoordination. Overall, these studies demonstrate that the effects of ethanol at GABAergic synapses containing the α2 subunit are important for specific behavioral effects of ethanol that may be relevant to the genetic linkage of this subunit with human alcoholism.
Introduction
γ-Aminobutyric acid A receptors (GABAA-Rs) represent the major inhibitory class of neurotransmitter receptors in the mammalian brain. They are pentameric in structure, with five subunits forming an ion pore. Seven classes of GABAA receptor subunits have been described to date (α1–6, β1–3, γ1–3, δ, ε, θ1–3, π, ρ1–3), allowing for extensive heterogeneity in receptor subunit composition across neuronal cell types and brain regions. However, most native GABAA-Rs are thought to consist of two α, two β, and one γ or a δ subunit.
GABAA-Rs mediate a number of pharmacological effects, including sedation/hypnosis, anxiolysis, and anesthesia for drugs such as barbiturates, benzodiazepines, neuroactive steroids, and intravenous anesthetics. There is also considerable evidence that ethanol enhances the function of GABAA-Rs, although we are only beginning to elucidate the specific roles of each receptor subtype and its component subunits in ethanol-induced behavior modification. (Boehm et al., 2004; Wallner et al., 2006; Harris et al., 2008; Lobo and Harris, 2008).
Subunit composition of GABAA-Rs have profound effects on receptor pharmacology (Ebert et al., 1997), suggesting that behavioral sensitivity to ethanol (and other drugs that alter GABAA-R function) may depend on which subunits are present (or absent) in specific brain circuits. Evidence supporting such pharmacological and behavioral specificity comes from knockin mouse studies. These mice possess a point mutation that alters one aspect of protein function (e.g., response to a drug), leaving all other aspects of protein function intact. These studies show that whereas α1 subunit-containing receptors mediate the sedative, amnestic, and anticonvulsant actions of diazepam (Rudolph et al., 1999; McKernan et al., 2000), α2 subunit-containing receptors mediate its anxiolytic actions (Löw et al., 2000; Rudolph and Möhler, 2004). In addition, studies of mice with a mutation in the α2 subunit implicated this subunit in cocaine addiction (Dixon et al., 2010).
A number of studies relating human allelic variation to alcoholism and other alcohol phenotypes have found linkage with GABAA-R clusters. The Collaborative Studies on Genetics of Alcoholism and other groups have identified a region of chromosome 4p associated with alcoholism, which includes a cluster of four GABAA-R subunits, wherein the strongest linkage lies with α2 (Edenberg et al., 2004; Enoch et al., 2008; Soyka et al., 2008). Moreover, studies assessing single-nucleotide polymorphisms near the human α2 gene have been shown to modulate the amount of α2 mRNA and protein in human brain and behavioral sensitivity to alcohol (Haughey et al., 2008). In addition, the relative abundance of α2 subunits alters the function and alcohol sensitivity of recombinant GABAA-Rs (Hurley et al., 2009).
The GABAA-R α2 subunit accounts for approximately 26% of GABAA-Rs (McKernan and Whiting, 1996) and is strongly expressed in many brain regions, with the highest levels in hippocampus, amygdala, bed nucleus of the stria terminalis, nucleus accumbens, neocortex, olfactory system, and hypothalamus (Pirker et al., 2000). It coassembles mainly with β2 and γ2 subunits and is found postsynaptically, although receptors with α, β, and γ2 subunits may also occur in extrasynaptic regions (McKernan and Whiting, 1996; Farrant and Nusser, 2005). Given the implication of α2 in alcoholism and its relatively high expression in many brain regions, it is important to determine the role of α2-containing GABAA-Rs in the behavioral actions of ethanol.
Traditionally, the approach to investigating the behavioral importance of a gene has been to study global knockout mice. Indeed, this has been done for multiple subunits of GABAA-R, including α2 (Boehm et al., 2004). Deletion of α2 reduced the duration of the loss of righting reflex (LORR) produced by ethanol but did not markedly affect alcohol consumption or other behavioral effects (Boehm et al., 2004). However, deletion of any GABAA subunit may lead to the development of compensatory changes in other systems and complicate the interpretation of behavioral data (Ponomarev et al., 2006). Such compensatory changes and other limitations of null mutants can often be avoided by constructing knockin mice in which the wild-type gene is replaced by a mutant sequence possessing a drug-insensitive, but otherwise normally responsive, protein. Indeed, knockin mice with Ser270 to histidine and Leu277 to alanine mutations in the α1 subunit of the GABAA-R, showed alterations in specific ethanol-induced behavioral effects (Werner et al., 2006). To extend these studies, we generated mice with Ser270 to His and Leu277 to Ala mutations in the α2 subunit of GABAA-Rs (Werner et al., 2010).
In the present study, we used these α2 knockin mice to test the hypothesis that α2-containing GABAA-Rs mediate specific behavioral responses to ethanol. We demonstrated that mutant α2(H270, A277)β2/3γ2S GABAA-R expressed in Xenopus oocytes did not show ethanol enhancement of GABA action. In addition, ethanol-induced behavioral responses were assessed in α2 gene knockin mice harboring the same mutation. In these mice some, but not all, ethanol-induced behavioral responses were reduced or eliminated.
Materials and Methods
Animals.
Wild-type mice (homozygous for serine at 270 and leucine at 277; referred to as SL/SL) and knockin mice (homozygous for histidine at 270 and alanine at 277; referred to as HA/HA) used for these experiments were produced from heterozygous (SL/HA) breeding pairs at the University of Pittsburgh (Pittsburgh, PA) or the University of Texas (Austin, TX). All mice were genotyped by Southern blot (University of Pittsburgh) or polymerase chain reaction (University of Texas). Southern blot analysis of tail DNA was performed as described previously (Werner et al., 2010). Mouse genotypes were determined by polymerase chain reactions performed on DNA derived from tail biopsies. Primers 5′-TTG AGC CGA TGA GTA ATG GGT CAC-3′ and 5′-GAG GGA ATT TCG AGC ACT GAT GCT-3′ amplified a 391-base pair fragment from the wild-type allele. Primers 5′-CAC ATC AGT GCT CGG AAT TCC GC-3′ and 5′-CCC TTA AAG GAT CTC AGG CAA GAA-3′ amplified a 304-base pair fragment from the knockin allele. To facilitate scoring, wild-type and knockin reactions were performed separately on each sample.
Mice were originally produced on a mixed C57BL/6J×129SvJ background and subsequently backcrossed to C57BL/6J for two to four generations as described previously (Werner et al., 2010). After weaning, mice were housed under specific pathogen-free conditions at the University of Pittsburgh and in a conventional facility at the University of Texas with ad libitum access to rodent chow and water with 12-h light/dark cycles (lights on at 7:00 AM). All mice were of the C57BL/6J N4 genetic background and between 8 and 12 weeks of age for behavioral experiments, except as specified below. Both male and female mice were used. Each mouse was used for only one experiment, and all mice were ethanol naive at the start of each experiment. All experiments were approved by Institutional Animal Care and Use Committees and conducted in accordance with National Institutes of Health guidelines with regard to the use of animals in research.
Electrophysiology in Xenopus Oocytes.
For detailed materials and methods, see Borghese et al. (2006) and Werner et al. (2010). In brief, Xenopus laevis oocytes were manually isolated, treated with collagenase, and injected with cDNA encoding GABAA subunits (α/β/γ 1:1:3 in ng/oocyte). The cDNAs were human α2 (wild-type and mutated), rat β2, human β3, and human γ2. Recordings were carried out 1 to 3 days after injection. The oocytes were placed in a rectangular chamber, continuously perfused with buffer at room temperature, and voltage-clamped at −70 mV.
All drugs were applied by bath perfusion. All solutions were prepared the day of the experiment. To study the ethanol (1, 10, 100, and 200 mM) modulation of GABA currents, the GABA concentration equivalent to EC5–10 was determined after 1 mM GABA gave the maximal current, and then ethanol was coapplied with EC5–10 GABA, preceded by 1-min application of ethanol alone. Percentage change was then calculated as the percentage change from the control response to EC5–10 GABA in the presence of ethanol. All experiments shown include data obtained from oocytes taken from at least two different frogs.
Pooled data were represented as mean ± S.E.M. Statistical significance was determined by using either t test or two-way ANOVA followed by Bonferroni post tests.
Alcohol Preference Drinking, 24-Hour Access.
A two-bottle choice protocol was carried out as described previously (Blednov et al., 2003). In brief, mice were allowed to acclimate for 1 week to individual housing. Two drinking tubes were continuously available to each mouse, and tubes were weighed daily. One tube always contained water. Food was available ad libitum, and mice were weighed every 4 days. After 4 days of water consumption (both tubes), mice were offered 3% ethanol (v/v) versus water for 4 days. Tube positions were changed daily to control for position preferences. Quantity of ethanol consumed (g/kg body weight/24 h) was calculated for each mouse, and these values were averaged for every concentration of ethanol. Immediately after 3% ethanol treatment, a choice between 6% (v/v) ethanol and water was offered for 4 days, then 9% (v/v) ethanol for 4 days, then 12% (v/v) ethanol for 4 days, then 15% (v/v) ethanol for 4 days, and, finally, 18% (v/v) ethanol for 4 days. Throughout the experiment, evaporation/spillage estimates were calculated daily from two bottles placed in an empty cage, one containing water and the other containing the appropriate ethanol solution.
Preference for Nonalcohol Tastants, 24-Hour Access.
Wild-type or knockin mice were also tested for saccharin and quinine consumption. One tube always contained water, and the other contained the tastant solution. Mice were serially offered saccharin (2,3-dihydro-3-oxobenzisosulfonazole sodium salt; Sigma-Aldrich, St. Louis, MO) (0.033 and 0.066%) and quinine (quinine hemisulfate salt monohydrate; Sigma-Aldrich) (0.03 and 0.06 mM), and intakes were calculated. Each concentration was offered for 4 days, with bottle position changed daily. For each tastant, the low concentration was always presented first, followed by the higher concentration. Between tastant testing, mice had access to two bottles with water for 2 weeks.
Ethanol Drinking: Limited Access Drinking in the Dark Phase (One-Bottle DID).
Another approach for consumption of ethanol (15% solution) has been described under conditions of limited access, which achieves pharmacologically significant levels of ethanol drinking (Rhodes et al., 2005). In brief, starting at 3 h after lights off, the water bottles were replaced with a bottle containing a 15% ethanol solution. The ethanol bottle remained in place for either 2 h (first 3 days) or 4 h (day 4) and then was replaced with the water bottles. Other than this short period of ethanol drinking, mice had unlimited access to water. The ethanol bottles were weighed before placement and after removal of the bottles from each experimental cage. In a separate experiment, ethanol-naive mice were exposed with ethanol (15%) intake from one bottle for 2 h daily during 9 consecutive days.
Ethanol Drinking: Limited Access in the Dark Phase (Two-Bottle Choice DID).
This was similar to the one-bottle DID test described above except that two bottles containing 15% ethanol and water were placed in the cage (Blednov and Harris, 2008). The ethanol and water bottles remained in place for 3 h. After their removal, mice had unlimited access to one bottle of water. The positions of bottles during 3-h access were changed daily to avoid potential side preference. The ethanol and water bottles were weighed before placement and after removal of the bottles from each experimental cage.
Ethanol Drinking: 24-Hour Access Every Other Day (Intermittent Drinking).
During the 1970s, several studies showed that intermittent access to ethanol induced high voluntary ethanol consumption (Wayner and Greenberg, 1972; Wise, 1973; Pinel and Huang, 1976). Although the mechanism of this phenomenon is not understood, the behavioral impact is clear, a substantial increase of ethanol intake compared with continuous daily access to ethanol and water. Simms et al. (2008) resurrected this experimental approach and showed that it produces reproducibly high levels of voluntarily ethanol consumption in Long-Evans or Wistar rats. Therefore, we also assessed ethanol consumption by using a paradigm adapted from Wise (1973) and Simms et al. (2008) using intermittent access to 15% ethanol. Animals were given access to one bottle of ethanol and one bottle of water during 24-h sessions every other day. The placement of the ethanol bottle was alternated each ethanol drinking session (day) to control for side preferences.
Conditioned Taste Aversion.
Subjects were adapted to a water-restriction schedule (2 h of water per day) over a 7-day period. At 48-h intervals over the next 10 days (days 1, 3, 5, 7, 9 and 11), all mice received 1-h access to a solution of saccharin [0.15% (w/v) sodium saccharin in tap water]. Immediately after 1-h access to saccharin, mice received injections of saline or ethanol (2.5 g/kg) (days 1, 3, 5, 7, and 9). All mice also received 30-min access to tap water 5 h after each saccharin access period to prevent dehydration (days 1, 3, 5, 7, and 9). On intervening days, mice had 2-h continuous access to water at standard times in the morning (days 2, 4, 6, 8 and 10). Reduced consumption of the saccharin solution is used as a measure of conditioned taste aversion (CTA).
Loss of Righting Reflex.
Sensitivity to ethanol (3.25 or 3.5 g/kg) was determined by using the standard duration of LORR assay in mice of the C57BL/6J N4 (age 9–14 weeks) genetic background. Ethanol was diluted in 0.9% saline (20% v/v) and administered in doses adjusted by injected volumes. Mice were injected with ethanol, and when they became ataxic they were placed in the supine position in V-shaped plastic troughs until they were able to right themselves three times within 30 s. LORR was defined as the time from being placed in the supine position until the mice regained their righting reflex. During all LORR assays normothermia was maintained with the aid of a heat lamp.
Rotarod.
Mice were trained on a fixed speed rotarod (Economex; Columbus Instruments, Columbus, OH; speed of rod, 5.0 rpm), and training was considered complete when mice were able to remain on the rotarod for 60 s. Every 15 min after injection of ethanol (2 g/kg i.p.) each mouse was placed back on the rotarod, and latency to fall was measured until the mouse was able to stay on the rotarod for 60 s.
Elevated Plus Maze.
Mice (C57BL/6J N3 genetic background; age 8–13 weeks) were evaluated for basal anxiety and ethanol-induced anxiolysis by using the elevated plus maze. Mice were transported to the testing room 1 day before testing. Animals were tested between 9:00 and 11:00 AM under ambient room light. Mice were weighed and injected with 1.0 g/kg ethanol or saline 10 min before testing. Each mouse was placed on the central platform of the maze facing an open arm. Mice were allowed to freely explore the maze for 5 min during which the following measurements were manually recorded: number of open arm entries, number of closed arm entries, total number of entries, time spent in open arms, and time spent in closed arms. A mouse was considered to be on the central platform or any arm when all four paws were within its perimeter.
Motor Activity (Open Field).
Wild-type and mutant mice of both sexes were tested for basal locomotor activity and ethanol-induced locomotor stimulation and sedation as described previously (Chandra et al., 2008). In brief, mice (8–12 weeks of age) were injected with saline or 0.75, 1.0, or 1.5 g ethanol/kg body weight 10 min before testing. Locomotor activity was quantified by the number of photobeam breaks in automated activity boxes (MED Associates, St. Albans, VT) during the 10-min test session.
Rationale for the Behavioral Tests.
Two-bottle choice is the most widely used test of ethanol preference and intake and allows measurement of voluntary consumption. It seems to be related to other measures of alcohol reward (Green and Grahame, 2008). Other tests for ethanol intake produce high levels of ethanol consumption by limiting access to ethanol. We used one- and two-bottle DID and intermittent access drinking to compare three types of limited access drinking. Because the ethanol produces taste responses (sweet and bitter) it is critical to analyze the sensitivity of the genotypes to bitter (quinine solutions) and sweet (saccharin solutions) tastes to determine whether changes in alcohol consumption are secondary to changes in taste. Conditioned taste aversion is used as the index of aversive properties to ethanol, and the response in this test is negatively correlated with voluntary ethanol intake (Green and Grahame, 2008). Duration of loss of righting reflex measures the anesthetic or sedative activities of ethanol, and for some mutant mice it is negatively correlated with voluntary ethanol consumption (Crabbe et al., 2006). Acute ethanol withdrawal shows the sensitivity to the development of ethanol physical dependence and also negatively correlates with ethanol intake in the two-bottle choice paradigm (Metten et al., 1998). The rotarod test measures an aspect of motor incoordination and recovery from acute ethanol intoxication. The behavior in the elevated-plus maze and open-field tests serves as an indicator for the level of anxiety and response to the acute stress, behaviors that are regulated by GABAergic systems.
Drug Injection.
All injectable ethanol (Aaper Alcohol and Chemical, Shelbyville, KY or Pharmco, Brookfield, CT) solutions were made in 0.9% saline (20% v/v) and injected intraperitoneally with a volume of 0.2 ml/10 g of body weight.
Ethanol Metabolism.
Animals were given a single dose of ethanol (3.8 g/kg i.p.), and blood samples were taken from the retro-orbital sinus 30, 60, 120, 180, and 240 min after injection. Blood ethanol concentration values, expressed as milligram of ethanol per milliliter of blood, were determined spectrophotometrically by an enzyme assay (Lundquist, 1959).
Statistical Analysis.
Data were reported as the mean ± S.E.M. The statistics software programs Prism (GraphPad Software Inc., San Diego, CA) or Statview (Abacus Concepts, Berkeley, CA) were used. Statistics for the analysis of data obtained in CTA experiments was performed with Statistica version 6 (StatSoft, Tulsa, OK). Analysis of variance (two-way ANOVA with Fischer's or Bonferroni post hoc tests) and Student's t test were carried out to evaluate differences between groups. To evaluate differences within groups, analysis of variance (one-way ANOVA with Fischer's or Bonferroni posttests) was carried out.
Results
Ethanol Actions on Recombinant Receptors.
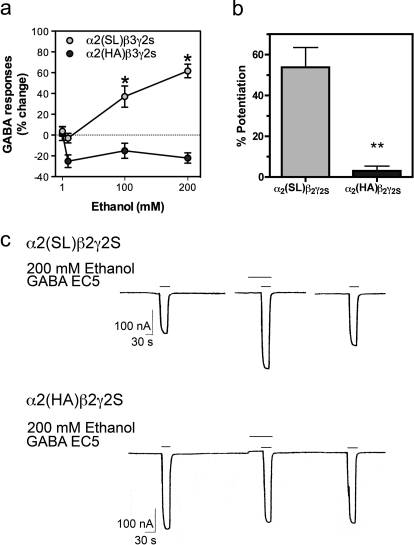
GABAA receptors containing either wild-type (S270, L277, or SL) or mutant (H270, A277 or HA) α2 subunits along with β2γ2 or β3γ2 subunits were expressed in Xenopus oocytes. Increasing concentrations of ethanol produced potentiation of submaximal GABA responses in α2(SL)β3γ2s receptors. In contrast, ethanol did not potentiate GABA responses in α2(HA)β3γ2s receptors and even produced a small inhibition (Fig. 1a). A two-way ANOVA of the effect of ethanol on GABA responses in α2(SL)β3γ2s and α2(HA)β3γ2s receptors showed a significant effect of receptor (F1,39 = 54.99), ethanol concentration (F1,39 = 10.53), and interaction (F3,39 = 16.03); p values were in all cases less than 0.0001 (n = 7–8).
Fig. 1.
Ethanol modulation of GABA responses in wild-type (SL) and mutant (HA) α2β3γ2s GABAA receptors expressed in Xenopus oocytes. a, GABA responses in α2β3γ2s GABAA receptors. Pooled data are represented as mean ± S.E.M. (n = 7–8). Effects of ethanol were tested with EC5–10 GABA. *, p < 0.01, significant differences from wild type for the same concentration of ethanol (two-way ANOVA followed by Bonferroni post test). b, GABA responses in α2β2γ2s GABAA receptors. Pooled data are represented as mean ± S.E.M. (n = 4 each). **, p < 0.01, Student's t test; difference between responses in wild-type and mutant GABA receptors. c, the actual tracing from oocyte recording with α2β2γ2s GABAA receptors.
Similar results were obtained with α2β2γ2s receptors: ethanol (200 mM) potentiated α2 wild type-containing receptors (54 ± 10%), but ethanol had no effect on mutant α2-containing receptors (3 ± 2%; p < 0.01, Student's t test; n = 4 each) (Fig. 1b). Recordings from single oocytes are shown in Fig. 1c.
Conditioned Taste Aversion.
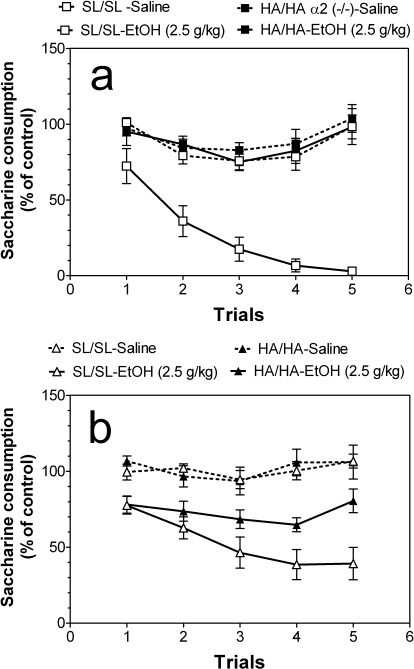
Consumption of saccharin during the 1-h period varied with sex (male mice: 79 ± 3.4 g/kg and 76 ± 3.6 g/kg body weight for wild-type and mutant mice, respectively; female mice: 117 ± 6.7 g/kg and 116 ± 5.3 g/kg body weight for wild-type and mutant mice, respectively). To correct for these initial differences in tastant consumption, intake was calculated as a percentage of the trial 0 consumption for each subject by dividing the amount of saccharin solution consumed on five subsequent conditioning trials by the amount of saccharin solution consumed on trial 0 (before conditioning). Ethanol-saccharin pairings produced reduction in saccharin intake across trials compared with saline-saccharin pairings (Fig. 2), indicating the development of CTA in wild-type mice of both sexes (males: F1,45 = 139, p < 0.001, effect of treatment; F4,45 = 9.7, p < 0.001, effect of trial; F4,45 = 5.2, p < 0.01, treatment × trial interaction and females: F1,65 = 63; p < 0.001, effect of treatment) as well as for knockin female mice: F1,60 = 38, p < 0.001, effect of treatment. However, the mutant male mice did not develop CTA; there were no differences between saline- and ethanol-treated groups of male mutant mice (Fig. 2a). Comparison of saline-treated groups of wild-type and mutant mice of corresponding sex also did not reveal significant differences over time. Dependence on trial was present only for the saline-saline comparison of male mice (F4,40 = 3.9, p < 0.001, main effect of trial). However, wild-type mice of both sexes developed significantly stronger CTA than knockin mice of both sexes (comparison of ethanol-treated groups of wild-type and mutant mice of corresponding sex) (males: F1,45 = 149, p < 0.001, effect of treatment; F4,45 = 8.5, p < 0.001, effect of trial; F4,45 = 6, p < 0.001, treatment × trial interaction and females: F1,85 = 16, p < 0.001, effect of treatment; F4,85 = 3.3, p < 0.05, effect of trial).
Fig. 2.
α2 Knockin mice develop weaker conditioned taste aversion for ethanol. a, male mice (n = 5 for saline injection for both genotypes; n = 5–6 for groups with ethanol injection). b, female mice (n = 5 for saline injection for both genotypes; n = 9–10 for groups with ethanol injection). No differences between saline-treated groups of wild-type and mutant mice of corresponding sex were found (two-way ANOVA). Wild-type mice of both sexes developed significantly stronger CTA than knockin mice of both sexes (comparison of ethanol-treated groups of wild-type and mutant mice of corresponding sex) (males: p < 0.001; females: p < 0.001; two-way ANOVA). Values represent mean ± S.E.M.
Ethanol Consumption.
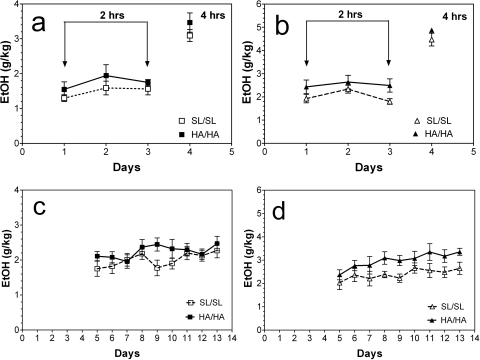
In limited access to 15% ethanol without free choice (one-bottle DID model), mutant and wild-type male mice consumed similar amounts of ethanol both during the first 3 days with 2-h access (a trend toward significance: F1,51 = 2.9, p = 0.09, main effect of genotype) and at day 4 with 4-h access to ethanol (Fig. 3a). On the contrary, female mutant mice (Fig. 3b) consumed slightly larger amounts of ethanol during the first 3 days with 2-h access (F1,42 = 7.5, p < 0.01, main effect of genotype). No differences in the amount of consumed ethanol were found at day 4 with 4-h access to ethanol in either sex (Fig. 3, a and b). However, during 9 days with 2-h daily access mutant mice of both sexes consumed larger amounts of ethanol than their wild-type littermates (F1,153 = 6.9, p < 0.01, main effect of genotype for male mice; F1,126 = 23, p < 0.001, main effect of genotype for female mice) (Fig. 3, c and d).
Fig. 3.
Ethanol intake in a limited access (one-bottle DID) model. a, male mice (n = 8–11 per genotype). The amount of ethanol consumed (g/kg) with 2- or 4-h access periods is shown. No differences between wild-type and mutant male mice were found (two-way ANOVA). b, female mice (n = 7–9 per genotype). Female mutant mice consumed larger amounts of ethanol during first 3 days with 2-h access (p < 0.01; two-way ANOVA). c, male mice (n = 8–11 per genotype). Male mutant mice consumed larger amounts of ethanol during 9 days with 2-h access (p < 0.01; two-way ANOVA). d, female mice (n = 7–9 per genotype). Female mutant mice consumed larger amounts of ethanol during 9 days with 2-h access (p < 0.001; two-way ANOVA). Values represent mean ± S.E.M.
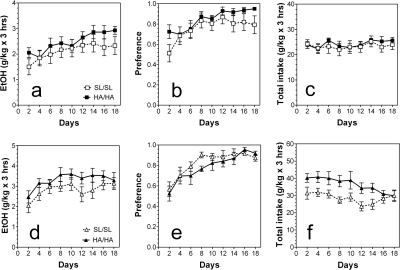
Over 18 days of limited daily access to 15% ethanol but with free choice between ethanol and water (two-bottle DID model: 15%) male mutant mice consumed slightly larger amounts of ethanol (F1,126 = 6.3, p < 0.05, main effect of genotype; F8,126 = 2.3, p < 0.05, main effect of days) (Fig. 4a) and showed slightly higher preference for ethanol (F1,126 = 6.6, p < 0.05, main effect of genotype; F8,126 = 3.7, p < 0.001, main effect of days) (Fig. 4b). No differences between genotypes for male mice in the amount of consumed fluid were found (Fig. 4c). Female mutant mice also consumed larger amounts of ethanol (F1,108 = 9.9, p < 0.01, main effect of genotype; F8,108 = 2.2, p < 0.05, main effect of days) (Fig. 4d) and larger amount of fluid (F1,108 = 31, p < 0.001, main effect of genotype; F8,108 = 2, p < 0.05, main effect of days) (Fig. 4f). However, no differences were observed between genotypes for female mice in preference for ethanol (Fig. 4e).
Fig. 4.
Ethanol intake in limited access (two-bottle DID) model. a–c, male mice. a, amount of ethanol consumed given as g/kg/3 h. b, preference for ethanol as a percentage of fluid intake. c, total fluid intake (alcohol solution + water) given as g/kg/3 h. Male mutant mice consumed slightly larger amounts of ethanol (p < 0.05; two-way ANOVA) and showed slightly higher preference for ethanol (p < 0.05; two-way ANOVA) than wild-type littermates. No differences between genotypes for male mice in the amount of consumed fluid were found (two-way ANOVA) (n = 7–9 per genotype). d–f, female mice. d, amount of ethanol consumed given as g/kg/3 h. e, preference for ethanol as a percentage of fluid intake. f, total fluid intake given as g/kg/3 h. Female mutant mice consumed larger amounts of ethanol (p < 0.01; two-way ANOVA) and larger amounts of fluid (p < 0.001; two-way ANOVA) than wild-type littermates. No differences were observed between genotypes for female mice in preference for ethanol (two-way ANOVA) (n = 6–8 per genotype). Values represent mean ± S.E.M.
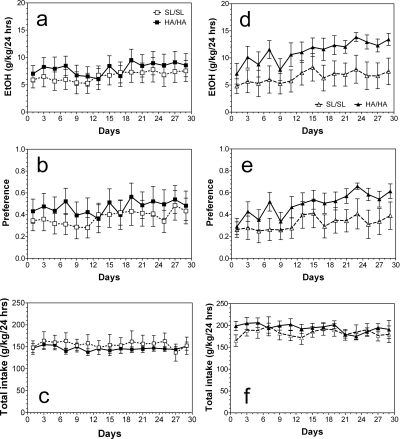
Mutant male mice consumed ethanol with a slightly higher preference than wild-type male mice over 1 month of intermittent drinking (every other day drinking) (F1,180 = 4.7, p < 0.05, main effect of genotype) (Fig. 5b). No significant differences in the amount of ethanol consumed and the total amount of fluid consumed were found for male mice (Fig. 5, a and c). However, mutant female mice consumed larger amounts of ethanol (F1,180 = 40, p < 0.001, main effect of genotype) (Fig. 5d) with higher preference for ethanol (F1,180 = 24, p < 0.001, main effect of genotype) (Fig. 5e) than their wild-type littermates. Total fluid intake was also slightly elevated in mutant female mice (F1,180 = 5.3, p < 0.05, main effect of genotype) (Fig. 5f).
Fig. 5.
Ethanol intake in a two-bottle choice test with intermittent access to ethanol (every other day drinking). a–c, male mice. a, amount of ethanol consumed given as g/kg/24 h. b, preference for ethanol as a percentage of fluid intake. c, total fluid intake given as g/kg/24 h. Mutant male mice consumed ethanol with a slightly higher preference than wild-type male mice (p < 0.05; two-way ANOVA). No significant differences in amount of ethanol consumed and total amount of fluid consumed were found (two-way ANOVA) (n = 7 per genotype). d–f, female mice. d, amount of ethanol consumed given as g/kg/24 h. e, preference for ethanol as a percentage of fluid intake. f, total fluid intake given as g/kg/24 h. Mutant female mice consumed larger amounts of ethanol (p < 0.001; two-way ANOVA) with higher preference for ethanol (p < 0.001; two-way ANOVA) than their wild-type littermates. Total fluid intake was also slightly elevated in mutant female mice (p < 0.05; two-way ANOVA) (n = 7 per genotype). Values represent mean ± S.E.M.
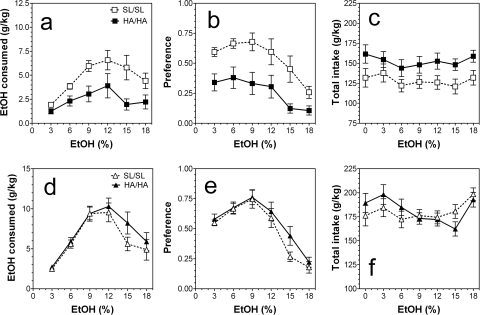
In the two-bottle free-choice paradigm in which mice could drink either water or an increasing series of ethanol concentrations the amount of ethanol consumed by mutant HA/HA male mice was significantly reduced compared with wild type (SL/SL) (F1,108 = 26, p < 0.001, main effect of genotype; F5,108 = 5.3, p < 0.001; no genotype × concentration interaction was found) (Fig. 6a). Mutant male mice also demonstrated significantly reduced preference for ethanol (F1,108 = 40, p < 0.001, main effect of genotype; F5,108 = 6.6, p < 0.001; no genotype × concentration interaction was found) (Fig. 6b) and increased total fluid intake (F1,126 = 23, p < 0.001, main effect of genotype) (Fig. 6c). No main effect of concentration and genotype × concentration interaction was found. In contrast, ethanol intake in female mice depended only on concentration of ethanol (F1,102 = 18, p < 0.001) (Fig. 6d). No differences between mutant and wild-type female mice in preference for ethanol or in the total amount of fluid consumed were found (Fig. 6, e and f).
Fig. 6.
Ethanol intake in a two-bottle choice test with 24-h continuous access to ethanol. a–c, male mice. a, amount of ethanol consumed given as g/kg/24 h. b, preference for ethanol as a percentage of fluid intake. c, total fluid intake given as g/kg/24 h. Mutant male mice consumed smaller amounts of ethanol (p < 0.001; two-way ANOVA) with reduced preference for ethanol (p < 0.001; two-way ANOVA) than their wild-type littermates. Total fluid intake was elevated in mutant male mice (p < 0.001; two-way ANOVA) (n = 10 per genotype). d–f, female mice. d, amount of ethanol consumed given as g/kg/24 h. e, preference for ethanol as a percentage of fluid intake. f, total fluid intake given as g/kg/24 h. No differences between mutant and wild-type female mice in ethanol intake, preference for ethanol, or total amount of fluid consumed were found (two-way ANOVA) (n = 9–10 per genotype). Values represent mean ± S.E.M.
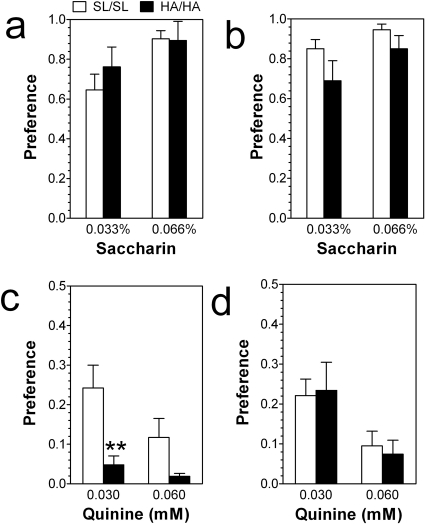
Given that ethanol intake in the continuous two-bottle choice paradigm depends strongly on taste (Blednov et al., 2008), the preferences for nonalcohol tastants such as saccharine and quinine were measured. No differences in preference for saccharin between mutant mice and wild-type mice of both sexes were found (Fig. 7, a and b). In male mice preference for saccharin depended on concentration of tastant (F1,36 = 5.6, p < 0.05, main effect of concentration). However, only mutant male mice demonstrated stronger avoidance for the bitter quinine solution (F1,36 = 14, p < 0.001, main effect of genotype) (Fig. 7c). In female mice the quinine intake depended only on concentration of tastant (F1,34 = 9.2, p < 0.01, main effect of concentration) (Fig. 7d).
Fig. 7.
Saccharin and quinine intake in a two-bottle choice test with 24-h continuous access to tastants. a and c, male mice (n = 10 per genotype). a, preference for saccharin. c, preference for quinine. b and d, female mice (n = 10 per genotype). b, preference for saccharin. d, preference for quinine. No differences in preference for saccharin between mutant mice and wild-type mice of both sexes were found (two-way ANOVA). Only mutant male mice demonstrated stronger avoidance for the bitter quinine solution (p < 0.001, main effect of genotype; two-way ANOVA). **, p < 0.01, significant differences relative to wild-type mice for the same dose of quinine (Bonferroni post hoc test). Values represent mean ± S.E.M.
Elevated Plus Maze.
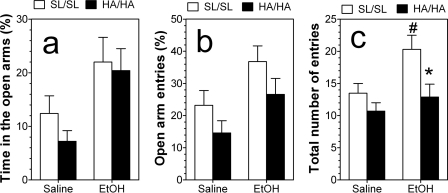
Locomotor activity was assessed by the total number of entries, whereas anxiety was measured by percentage of time spent in open arm entries and percentage of open arm entries after injection of saline or ethanol. Because no gender-dependent differences were found, the data obtained from male and female mice were combined for the final analysis. Treatment affected only the percentage of time spent in open arms (F1,37 = 10, p < 0.01) (Fig. 8a). Percentage of open arm entries demonstrated slight dependence on genotype (F1,37 = 4, p < 0.05) and treatment (F1,37 = 8, p < 0.01) (Fig. 8b). The total number of entries also depended on genotype (F1,37 = 8, p < 0.01) and treatment (F1,37 = 7, p < 0.05) (Fig. 8c). Post hoc analysis showed that ethanol significantly increased the activity in wild-type mice (p < 0.05) but not knockin mice, and elevation of activity after ethanol injection was significantly higher in wild-type mice compared with mutant mice (p < 0.05).
Fig. 8.
Evaluation of anxiety and activity using the elevated plus maze. a, percentage of total time spent in open arms. There was a dependence only on treatment (p < 0.01; two-way ANOVA). b, percentage of open arm entries. There was a dependence on genotype (p < 0.05; two-way ANOVA) and treatment (p < 0.01; two-way ANOVA). c, total arm entries. There was a dependence on genotype (p < 0.01; two-way ANOVA) and treatment (p < 0.05; two-way ANOVA) (n = 9–11 per genotype). *, p < 0.05, significant differences relative to wild-type mice for the same concentration of ethanol (two-way ANOVA Fischer's post hoc test). #, p < 0.05, significant differences between ethanol-injected and control groups of wild-type mice (two-way ANOVA Fischer's post hoc test). Values represent mean ± S.E.M.
Motor Activity (Open Field).
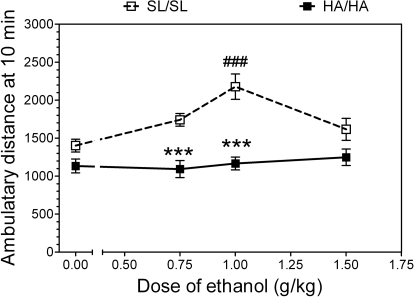
Because no gender-dependent differences were found, data from male and female mice were combined for the final analysis. Analysis of variance (two-way ANOVA) showed that the effect of ethanol on motor activity in the open field depended on genotype (F1,118 = 51, p < 0.001) and dose of ethanol (F3,118 = 4.3, p < 0.01) and showed significant genotype × dose interaction (F3,118 = 4.3, p < 0.01) (Fig. 9). Post hoc analysis showed that at 0.75 and 1.0 g/kg doses of ethanol, motor activity was higher in wild-type (SL/SL) mice compared with mutant (HA/HA) mice. Additional within-groups analyses of variance (one-way ANOVA) showed a strong effect of ethanol in wild-type mice (F3,60 = 7, p < 0.001) and no effect of ethanol in knockin mice (F3,58 = 0.4, p > 0.05). At a dose of 1.0 g/kg, ethanol significantly increased the motor activity in wild-type mice (p < 0.001, Fischer's post hoc test).
Fig. 9.
α2 Knockin mice are less sensitive to ethanol-induced motor stimulation in the open field. There was a dependence on genotype (p < 0.001; two-way ANOVA) and dose of ethanol (p < 0.01; two-way ANOVA). Within-groups analyses of variance showed strong effect of ethanol in wild-type mice (p < 0.001; one-way ANOVA) and no effect of ethanol in knockin mice. ###, P < 0.001, significant difference from saline control for the same genotype (one-way ANOVA, Fischer's post hoc test). ***, P < 0.001, significant difference from the same dose of ethanol between two different genotypes (two-way ANOVA, Fischer's post hoc test). Each point represents an independent group of animals (n = 15–16 per each group of each genotype).
Sedative/Hypnotic and Motor Ataxic Effects of Ethanol.
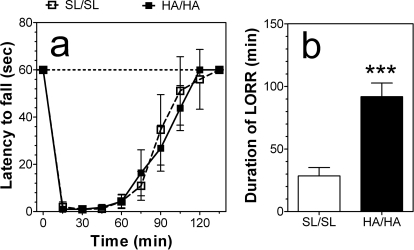
Because no gender-dependent differences were found, data from male and female mice were combined for the final analysis. Acute administration of ethanol (2 g/kg) produced motor ataxia as measured by the rotarod test in wild-type and mutant mice (Fig. 10a). There were no differences between wild-type and mutant mice in recovery from this motor incoordination (F1,180 = 0.4, p > 0.05, dependence on genotype; F9,180 = 297, p < 0.001, dependence on time; F9,180 = 1.9, p > 0.05, genotype × time interaction).
Fig. 10.
Depressant effects of ethanol in α2 knockin mice. a, time on the rotarod in seconds before and after motor incoordination induced by ethanol (2 g/kg) (n = 6 per genotype). No differences between wild-type and mutant mice in recovery from ethanol-induced motor incoordination were found (two-way ANOVA). b, duration of LORR in minutes after injection of ethanol (3.25 g/kg) (n = 6 per genotype). ***, P < 0.05, significant difference between genotypes (Student's t test). Values represent mean ± S.E.M.
In animals from the N4 generation of backcrossing, ethanol produced a significantly longer duration of LORR in mutant mice than in wild-type mice (p < 0.001, Student's t test) (Fig. 10b).
Ethanol Metabolism.
There were no differences in metabolism of ethanol (after 3.8 g/kg dose) between wild-type and knockin mice (data not shown). The slopes of the regression lines were −0.47 ± 0.02 and −0.52 ± 0.02 for wild-type mice (n = 4) and knockout mice (n = 4), respectively.
Discussion
Engineering a mutant α2 subunit with normal sensitivity to GABA (Werner et al., 2010) but complete resistance to modulation by ethanol allows us to ask which, if any, behavioral effects of ethanol might be caused by the direct action of ethanol on GABAA-R-containing α2 subunits. Any behavior resulting from ethanol action on such receptors should be reduced or eliminated in the knockin mice. There are two ethanol-induced behaviors that meet this criterion as summarized in Table 1: conditioned taste aversion and stimulation of motor activity. These mutations also tended to increase ethanol consumption, and this may be related to decreased aversive (CTA) properties of the drug in the mutant mice consistent with the relationship between CTA and alcohol consumption shown in many other studies (Green and Grahame, 2008). It is noteworthy that these effects on consumption depend on the specific test used as well as the sex of the mice, and this complexity has been noted in other studies of alcohol consumption by mutant mice (Blednov and Harris, 2008). The male α2 knockin mice also showed increased avoidance of a bitter tastant (quinine), and this may also influence alcohol consumption in this sex. In particular, the two-bottle choice test provides increasing concentrations of ethanol, whereas the other tests used a fixed (15%) concentration of ethanol. Bitter taste may play a different role in these two types of tests because males decreased their consumption in the two-bottle choice test, but males and females increased consumption in the one-bottle and two-bottle DID tests. These findings raise the question of what regulates, or limits, alcohol consumption in each of these tests. Our studies of mutant mice with taste deficiencies suggest that sweet taste is very important for alcohol consumption in the two-bottle choice test (Blednov et al., 2008) but not as important for limited-access drinking (unpublished data). The DID models provide a model where voluntary consumption produces appreciable levels of blood alcohol and, in view of the linkage between α2 and human alcoholism, it is intriguing that mutation of α2 increased consumption in these tests. Apart from ethanol drinking behavior, it is somewhat surprising that the knockin mutations enhanced one behavioral action of ethanol, duration of LORR. This effect was robust and evident on two different genetic backgrounds. This contrasts with the enhanced duration of the LORR in response to isoflurane that was observed in these mice only on the N2 background (Werner et al., 2010). The mechanism for this paradoxical increase in ethanol sensitivity is unknown at present. It is possible that because the α2 mutation ablated the locomotor stimulatory action of ethanol it changed the balance between inhibitory and stimulatory effects and enhanced the depressant actions thus exacerbating LORR. It is also interesting that these same mutations in the α1 subunit of the GABAA-R also paradoxically increased sensitivity to ethanol, albeit on a different behavioral response, the anxiolytic effect (Werner et al., 2006).
TABLE 1.
Summary of the behavioral effects of ethanol in HA/HA knockin mice
| Test | Behavior | Males | Females |
|---|---|---|---|
| 2-BC (ethanol) | EtOH (g/kg/24 h) | ↓ | = |
| Preference | ↓ | = | |
| Fluid intake (g/kg/24 h) | ↑ | = | |
| 2-BC (saccharin) | Preference | = | = |
| 2-BC (quinine) | Preference | ↓ | = |
| 1B-DID (short) | EtOH (g/kg/2 h) | = | ↑ |
| 1B-DID (long) | EtOH (g/kg/2 h) | ↑ | ↑ |
| 2B-DID | EtOH (g/kg/3 h) | ↑ | ↑ |
| Preference | ↑ | = | |
| Fluid intake (g/kg/3 h) | = | ↑ | |
| 2-BCI | EtOH (g/kg/24 h) | = | ↑ |
| Preference | ↑ | ↑ | |
| Fluid intake (g/kg/24 h) | = | ↑ | |
| CTA | Taste aversion | ↓ | ↓ |
| LORR | Duration (min) | ↑ | ↑ |
| EPM | Anxiety | = | = |
| Activity | ↓ | ↓ | |
| OF | Motor stimulation | ↓ | ↓ |
| Rotarod | Motor incoordination | = | = |
2-BC, two-bottle choice with 24-h access; 2-BCI, two-bottle choice with intermittent 24-h access; 1B-DID, limited access with one bottle; 2B-DID, limited access with two bottles; EPM, elevated plus maze; OF, open field. ↓, reduction of behavior in mutant mice; ↑, increase of behavior in mutant mice; =, no differences.
Also surprising is the lack of importance of α2 for the anxiolytic actions of ethanol found in the present work and in an earlier study of α2 null mutant mice (Boehm et al., 2004). The anxiolytic actions of benzodiazepines seem to be solely caused by actions on GABAA-R-containing α2 subunits (Löw et al., 2000), and one might expect that the mutants would display reduced anxiolytic effects of ethanol. However, the data from α2 mutant mice indicate clear differences in the anxiolytic actions of ethanol and benzodiazepines.
As noted earlier, our the interest in the GABAA-R α2 subunit was stimulated by the many human genetic studies showing linkage of polymorphisms near this gene with alcoholism (Edenberg et al., 2004; Enoch et al., 2008; Soyka et al., 2008). In a human behavioral study, Haughey et al. (2008) showed that two GABAA-R α2 single-nucleotide polymorphisms were associated with sensitivity to the acute effects of alcohol. Specifically, several measures of subjective responses to alcohol, including the hedonic value, were linked with Gabra2 polymorphisms. Based on a haplotypic association of alcohol dependence with Gabra2, Pierucci-Lagha et al. (2005) also provided evidence that the risk of alcoholism associated with Gabra2 alleles may be related to differences in the subjective response to alcohol. It is difficult to directly link these human responses to alcohol with mouse behavior, but it should be noted that the most dramatic effects of mutation were in development of CTA, a test that probably reflects aversive properties of ethanol (Green and Grahame, 2008). In addition, we found a marked reduction of CTA in mice with global deletion of the GABAA-R α2 subunit (Y. A. Blednov, unpublished data).
The α2 subunit coassembles with β2 or β3 and γ2 to form functional GABAA-R. However, these receptors, at least when tested in vitro in recombinant systems, require high concentrations (50–100 mM) of ethanol for enhancement of channel function. It should be noted that these concentrations are not so far removed from those encountered in vivo. Most of our behavioral tests used intraperitoneal doses of 2.5 to 3.5 g/kg, which will result in peak brain ethanol concentrations of approximately 50 to 100 mM (Deitrich and Harris, 1996). Thus, it might be expected that they could be important only for the behavioral effects produced by large doses of ethanol, such as loss of righting reflex or motor incoordination. However, the two behaviors that are among the most sensitive to ethanol, stimulation of motor activity and CTA, were remarkably sensitive to the mutation, whereas the behaviors requiring higher doses of ethanol were not reduced in the knockin mice. The results clearly indicate that direct action of ethanol on GABAA-Rs with α2 subunits is important for several low-dose behaviors, although the basis of this unexpected sensitivity is not apparent. A caveat of any study of mutant mice is that the mutation may produce changes in other neuronal functions, and this has been found with null mutant mice lacking GABAA-R subunits (Ponomarev et al., 2006). Although we expect such changes to be less pronounced in knockin mice than in null mutants, Borghese et al. (2006) found changes in the protein levels of several GABAA-R subunits in the cortex of wild-type and knockin mice with a mutation in the α1 subunit. We have examined global gene expression in brain of α2 knockin mice and found very few changes in contrast to α1 knockin or knockout mice (Harris et al., 2010), suggesting that this knockin mutation may be relatively “silent.”
In summary, we have demonstrated that mutation of two amino acids in the α2 subunit prevents ethanol modulation of GABAA-R in vitro. Moreover, knockin mice containing these mutant receptors are resistant to ethanol-induced conditioned place aversion and motor stimulation. Thus, α2-containing GABAA-Rs may play a role in several behaviors, including ethanol intake, that are relevant for human alcoholism and may explain the association of polymorphisms in Gabra2 with alcoholism.
Acknowledgments
We thank Carolyn Ferguson, Virginia Bleck, and Danielle Walker for excellent technical assistance.
This study was supported by the National Institutes of Health National Institute on Alcohol Abuse and Alcoholism [Grants AA13520, AA06399, AA10422] and the National Institutes of Health National Institute of General Medical Sciences [Grant GM47818].
Article, publication date, and citation information can be found at http://jpet.aspetjournals.org.
doi:10.1124/jpet.110.171645.
- GABAA-R
- GABA type A receptor
- LORR
- loss of righting reflex
- CTA
- conditioned taste aversion
- ANOVA
- analysis of variance
- DID
- drinking in the dark.
Authorship Contributions
Participated in research design: Blednov, Harrison, Homanics, and Harris.
Conducted experiments: Blednov, Borghese, McCracken, Benavidez, Geil, Osterndorff-Kahanek, Iyer, Werner, and Swihart.
Performed data analysis: Blednov, Borghese, McCracken, Iyer, Werner, Homanics, and Harris.
Wrote or contributed to the writing of the manuscript: Blednov, Borghese, Werner, Harrison, Homanics, and Harris.
Other: Blednov, Homanics, and Harris acquired funding for the research.
References
- Blednov YA, Harris RA. (2008) Metabotropic glutamate receptor 5 (mGluR5) regulation of ethanol sedation, dependence and consumption: relationship to acamprosate actions. Int J Neuropsychopharmacol 11:775–793 [DOI] [PMC free article] [PubMed] [Google Scholar]
- Blednov YA, Walker D, Alva H, Creech K, Findlay G, Harris RA. (2003) GABAA receptor α1 and β2 subunit null mutant mice: behavioral responses to ethanol. J Pharmacol Exp Ther 305:854–863 [DOI] [PubMed] [Google Scholar]
- Blednov YA, Walker D, Martinez M, Levine M, Damak S, Margolskee RF. (2008) Perception of sweet taste is important for voluntary alcohol consumption in mice. Genes Brain Behav 7:1–13 [DOI] [PMC free article] [PubMed] [Google Scholar]
- Boehm SL, 2nd, Ponomarev I, Jennings AW, Whiting PJ, Rosahl TW, Garrett EM, Blednov YA, Harris RA. (2004) γ-Aminobutyric acid A receptor subunit mutant mice: new perspectives on alcohol actions. Biochem Pharmacol 68:1581–1602 [DOI] [PubMed] [Google Scholar]
- Borghese CM, Werner DF, Topf N, Baron NV, Henderson LA, Boehm SL, 2nd, Blednov YA, Saad A, Dai S, Pearce RA, et al. (2006) An isoflurane- and alcohol-insensitive mutant GABA(A) receptor α(1) subunit with near-normal apparent affinity for GABA: characterization in heterologous systems and production of knockin mice. J Pharmacol Exp Ther 319:208–218 [DOI] [PubMed] [Google Scholar]
- Chandra D, Werner DF, Liang J, Suryanarayanan A, Harrison NL, Spigelman I, Olsen RW, Homanics GE. (2008) Normal acute behavioral responses to moderate/high dose ethanol in GABAA receptor α4 subunit knockout mice. Alcohol Clin Exp Res 32:10–18 [DOI] [PMC free article] [PubMed] [Google Scholar]
- Crabbe JC, Phillips TJ, Harris RA, Arends MA, Koob GF. (2006) Alcohol-related genes: contributions from studies with genetically engineered mice. Addict Biol 11:195–269 [DOI] [PubMed] [Google Scholar]
- Deitrich RA, Harris RA. (1996) How much alcohol should I use in my experiments? Alcohol Clin Exp Res 20:1–2 [DOI] [PubMed] [Google Scholar]
- Dixon CI, Morris HV, Breen G, Desrivieres S, Jugurnauth S, Steiner RC, Vallada H, Guindalini C, Laranjeira R, Messas G, et al. (2010) Cocaine effects on mouse incentive-learning and human addiction are linked to α2 subunit-containing GABAA receptors. Proc Natl Acad Sci USA 107:2289–2294 [DOI] [PMC free article] [PubMed] [Google Scholar]
- Ebert B, Thompson SA, Saounatsou K, McKernan R, Krogsgaard-Larsen P, Wafford KA. (1997) Differences in agonist/antagonist binding affinity and receptor transduction using recombinant human γ-aminobutyric acid type A receptors. Mol Pharmacol 52:1150–1156 [PubMed] [Google Scholar]
- Edenberg HJ, Dick DM, Xuei X, Tian H, Almasy L, Bauer LO, Crowe RR, Goate A, Hesselbrock V, Jones K, et al. (2004) Variations in GABRA2, encoding the α2 subunit of the GABA(A) receptor, are associated with alcohol dependence and with brain oscillations. Am J Hum Genet 74:705–714 [DOI] [PMC free article] [PubMed] [Google Scholar]
- Enoch MA. (2008) The role of GABA(A) receptors in the development of alcoholism. Pharmacol Biochem Behav 90:95–104 [DOI] [PMC free article] [PubMed] [Google Scholar]
- Farrant M, Nusser Z. (2005) Variations on an inhibitory theme: phasic and tonic activation of GABA(A) receptors. Nat Rev Neurosci 6:215–229 [DOI] [PubMed] [Google Scholar]
- Green AS, Grahame NJ. (2008) Ethanol drinking in rodents: is free-choice drinking related to the reinforcing effects of ethanol? Alcohol 42:1–11 [DOI] [PMC free article] [PubMed] [Google Scholar]
- Harris RA, Osterndorff-Kahanek E, Pnomarev I, Homanics GE, Blednov YA. (2010) Transcriptomic and behavioral studies of GABAA receptor of α1 and α2 subunit knock-in mice. Neurosci Lett, in press [DOI] [PMC free article] [PubMed] [Google Scholar]
- Harris RA, Trudell JR, Mihic SJ. (2008) Ethanol's molecular targets. Sci Signal 1:re7. [DOI] [PMC free article] [PubMed] [Google Scholar]
- Haughey HM, Ray LA, Finan P, Villanueva R, Niculescu M, Hutchison KE. (2008) Human γ-aminobutyric acid A receptor α2 gene moderates the acute effects of alcohol and brain mRNA expression. Genes Brain Behav 7:447–454 [DOI] [PubMed] [Google Scholar]
- Hurley JH, Ballard CJ, Edenberg HJ. (2009) Altering the relative abundance of GABA A receptor subunits changes GABA- and ethanol-responses in Xenopus oocytes. Alcohol Clin Exp Res 33:1089–1096 [DOI] [PMC free article] [PubMed] [Google Scholar]
- Lobo IA, Harris RA. (2008) GABA(A) receptors and alcohol. Pharmacol Biochem Behav 90:90–94 [DOI] [PMC free article] [PubMed] [Google Scholar]
- Löw K, Crestani F, Keist R, Benke D, Brünig I, Benson JA, Fritschy JM, Rülicke T, Bluethmann H, Möhler H, et al. (2000) Molecular and neuronal substrate for selective attenuation of anxiety. Science 290:131–134 [DOI] [PubMed] [Google Scholar]
- Lundquist F. (1959) The determination of ethyl alcohol in blood and tissue. Methods Biochem Anal 7:217–251 [Google Scholar]
- McKernan RM, Whiting PJ. (1996) Which GABAA-receptor subtypes really occur in the brain? Trends Neurosci 19:139–143 [DOI] [PubMed] [Google Scholar]
- McKernan RM, Rosahl TW, Reynolds DS, Sur C, Wafford KA, Atack JR, Farrar S, Myers J, Cook G, Ferris P, et al. (2000) Sedative but not anxiolytic properties of benzodiazepines are mediated by the GABA(A) receptor α1 subtype. Nat Neurosci 3:587–592 [DOI] [PubMed] [Google Scholar]
- Metten P, Phillips TJ, Crabbe JC, Tarantino LM, McClearn GE, Plomin R, Erwin VG, Belknap JK. (1998) High genetic susceptibility to ethanol withdrawal predicts low ethanol consumption. Mamm Genome 9:983–990 [DOI] [PubMed] [Google Scholar]
- Pierucci-Lagha A, Covault J, Feinn R, Nellissery M, Hernandez-Avila C, Oncken C, Morrow AL, Kranzler HR. (2005) GABRA2 alleles moderate the subjective effects of alcohol, which are attenuated by finasteride. Neuropsychopharmacology 30:1193–1203 [DOI] [PubMed] [Google Scholar]
- Pinel JP, Huang E. (1976) Effects of periodic withdrawal on ethanol and saccharin selection in rats. Physiol Behav 16:693–698 [DOI] [PubMed] [Google Scholar]
- Pirker S, Schwarzer C, Wieselthaler A, Sieghart W, Sperk G. (2000) GABA(A) receptors: immunocytochemical distribution of 13 subunits in the adult rat brain. Neuroscience 101:815–850 [DOI] [PubMed] [Google Scholar]
- Ponomarev I, Maiya R, Harnett MT, Schafer GL, Ryabinin AE, Blednov YA, Morikawa H, Boehm SL, 2nd, Homanics GE, Berman AE, et al. (2006) Transcriptional signatures of cellular plasticity in mice lacking the α1 subunit of GABAA receptors. J Neurosci 26:5673–5683 [DOI] [PMC free article] [PubMed] [Google Scholar]
- Rhodes JS, Best K, Belknap JK, Finn DA, Crabbe JC. (2005) Evaluation of a simple model of ethanol drinking to intoxication in C57BL/6J mice. Physiol Behav 84:53–63 [DOI] [PubMed] [Google Scholar]
- Rudolph U, Möhler H. (2004) Analysis of GABAA receptor function and dissection of the pharmacology of benzodiazepines and general anesthetics through mouse genetics. Annu Rev Pharmacol Toxicol 44:475–498 [DOI] [PubMed] [Google Scholar]
- Rudolph U, Crestani F, Benke D, Brünig I, Benson JA, Fritschy JM, Martin JR, Bluethmann H, Möhler H. (1999) Benzodiazepine actions mediated by specific γ-aminobutyric acid A receptor subtypes. Nature 401:796–800 [DOI] [PubMed] [Google Scholar]
- Simms JA, Steensland P, Medina B, Abernathy KE, Chandler LJ, Wise R, Bartlett SE. (2008) Intermittent access to 20% ethanol induces high ethanol consumption in Long-Evans and Wistar rats. Alcohol Clin Exp Res 32:1816–1823 [DOI] [PMC free article] [PubMed] [Google Scholar]
- Soyka M, Preuss UW, Hesselbrock V, Zill P, Koller G, Bondy B. (2008) GABA-A2 receptor subunit gene (GABRA2) polymorphisms and risk for alcohol dependence. J Psychiatr Res 42:184–191 [DOI] [PubMed] [Google Scholar]
- Wallner M, Hanchar HJ, Olsen RW. (2006) Low dose acute alcohol effects on GABA A receptor subtypes. Pharmacol Ther 112:513–528 [DOI] [PMC free article] [PubMed] [Google Scholar]
- Wayner MJ, Greenberg I. (1972) Effects of hypothalamic stimulation, acclimation and periodic withdrawal on ethanol consumption. Physiol Behav 9:737–740 [DOI] [PubMed] [Google Scholar]
- Werner DF, Blednov YA, Ariwodola OJ, Silberman Y, Logan E, Berry RB, Borghese CM, Matthews DB, Weiner JL, Harrison NL, et al. (2006) Knockin mice with ethanol-insensitive α1-containing γ-aminobutyric acid type A receptors display selective alterations in behavioral responses to ethanol. J Pharmacol Exp Ther 319:219–227 [DOI] [PubMed] [Google Scholar]
- Werner DF, Swihart A, Rau V, Jia F, Borghese CM, McCracken ML, Iyer S, Fanselow MS, Sonner JM, Eger EI, II, et al. (2010) Inhaled anesthetic responses of recombinant receptors and knockin mice harboring α2 GABAA receptor subunits that are resistant to isoflurane. J Pharmacol Exp Ther 336:134–144 [DOI] [PMC free article] [PubMed] [Google Scholar]
- Wise RA. (1973) Voluntary ethanol intake in rats following exposure to ethanol on various schedules. Psychopharmacologia 29:203–210 [DOI] [PubMed] [Google Scholar]


