

Abstract
Objective
To identify differentially expressed genes in peripheral blood cells (PBC) of patients with ankylosing spondylitis (AS) relative to healthy controls and controls with systemic inflammation.
Methods
We investigated PBC samples of 16 patients with AS and 14 matched controls, in addition to systemic lupus erythematosus (SLE) and systemic sclerosis (SSc) samples utilizing Illumina Human Ref-8 BeadChips. Candidate genes were confirmed using quantitative PCR. Subsequently, these genes were also validated in a separate sample of 27 patients with AS [before and after antitumor necrosis factor (anti-TNF) treatment] and 27 matched controls.
Results
We identified 83 differentially expressed transcripts between AS patients and controls. This gene list was filtered through the lists of differentially expressed transcripts in SLE and SSc, which resulted in identification of 52 uniquely dysregulated transcripts in AS. Many of the differentially expressed genes belonged to Toll-like receptor (TLR) and related pathways. TLR4 and TLR5 were the only dysregulated TLR subtypes among AS patients. We confirmed the overexpression of TLR4 and TLR5 in AS patients in comparison to controls (p = 0.012 and p = 0.006, respectively) and SLE (p = 0.002, p = 0.008) using quantitative PCR in the same sample. Similarly, TLR4 (p = 0.007) and TLR5 (p = 0.012) were significantly upregulated among the AS patients before anti-TNF treatment in the confirmatory sample. TLR4 (p = 0.002) and TLR5 (p = 0.025) decreased significantly after anti-TNF treatment.
Conclusion
PBC gene expression profiling in AS shows an upregulation of TLR4 and TLR5. This supports the importance of TLR subtypes in the pathogenesis of AS that are responsible for the immune response to Gram-negative bacteria.
Keywords: ANKYLOSING SPONDYLITIS, TOLL-LIKE RECEPTORS, IMMUNE SYSTEM, AUTOIMMUNITY, BACTERIA, GENE EXPRESSION PROFILING
Ankylosing spondylitis (AS) is a chronic inflammatory arthritis with a predilection for the spine and sacroiliac joints that can lead to new bone formation and ultimately ankylosis. AS is the prototype of spondyloarthropathies (SpA), a related family of disorders with common clinical features and with a strong association with HLA-B27. However, HLA-B27 accounts only for ~45% of the genetic risk in AS. Genome-wide association studies have identified several other non-HLA susceptibility genes such as IL23R and ERAP1 in AS1,2. Other diseases belonging to the spectrum of SpA are reactive arthritis, psoriatic arthritis, and arthritis in patients with inflammatory bowel disease3.
Functional studies also have been undertaken to identify candidate genes and pathways that play a role in the pathogenesis of SpA. Microarray data from synovium suggest a proinflammatory profile. Gu, et al demonstrated increased RNA expression of monocyte chemotractant protein 1 (MCP-1), interleukin 8 (IL-8), IL-1ß, endothelial-monocyte activating polypeptide II, interferon-γ, tumor necrosis factor-α (TNF-α), and BiP in SpA synovial fluid mononuclear cells4. Rihl, et al found elevated levels of IL-7 transcript and protein in sacroiliac joint cells5. On the other hand, transcriptional profiling of isolated peripheral blood mononuclear cells (PBMC) by several groups showed that transcripts involved in the inflammatory response are differentially expressed in SpA patients, but reports on the nature of these changes seem to vary. The earliest PBMC study indicated increased expression of proinflammatory proteins such as CXCR4/SDF-16. However, recent reports suggest decreased immune responsiveness of the PBMC. Smith, et al found a “reverse interferon (IFN) signature” characterized by decreased expression of IFN-γ and IFN-γ-inducible genes in AS macrophages7, and Duan, et al found that AS PBMC display an immunosuppressive phenotype as shown by underexpression of NR4A2, TNFAIP3, and CD698.
We investigated the whole-blood gene transcript profile of AS patients in comparison to controls in order to elucidate the gene expression patterns involved in this disease. Unlike previous investigators, we employed a commercially available method to stabilize RNA in the blood immediately upon phlebotomy to minimize artifacts that occur with handling and purification of living PBMC9. We compared their transcript profiles to healthy controls; we also compared transcript profiles to those of patients with systemic sclerosis (SSc) and systemic lupus erythematosus (SLE) in order to identify transcripts that were specific to AS and were not related only to the presence of systemic inflammation. We identified 51 genes that were differentially expressed only in AS patients. Many of the differentially expressed genes belonged to Toll-like receptor (TLR) and related pathways. We observed an overexpression of TLR4 and TLR5 that was confirmed by quantitative polymerase chain reaction (PCR) in 2 different cohorts of AS patients. We further demonstrated that TLR4 and TLR5 transcripts in whole blood decreased significantly after TNF-α inhibitor (anti-TNF) therapy. Our findings provide support for the importance of a pathogen-associated molecular pattern in the pathogenesis of AS.
MATERIALS AND METHODS
The patients with AS were recruited from the Prospective Study of Outcomes in Ankylosing Spondylitis (PSOAS) study. The PSOAS is a longitudinal study of AS patients from 3 sites in the USA: the University of Texas Health Science Center at Houston, Houston, Texas (UTHSC-H); Cedars-Sinai Medical Center, Los Angeles, California; and the National institutes of Health, Bethesda, Maryland. All AS patients met the modified New York criteria for the definitive diagnosis of AS10. From patients enrolled in PSOAS, we investigated 2 separate groups of patients with AS. In the initial group, no patient was receiving anti-TNF or other immunosuppressive agents. All AS patients in the initial sample set were recruited from the UTHSC-H site. In the second confirmatory cohort, 2 samples were investigated from each patient: the first before initiation of an anti-TNF treatment; the second was obtained after the patient was treated with an anti-TNF agent for ≥ 6 months. AS patients in the confirmatory cohort were recruited from all 3 participating sites. All AS patients enrolled in the discovery group had active disease, defined as Bath AS Disease Activity Index (BASDAI) score ≥ 3.5. Similarly, all AS patients in the confirmatory cohort had a BASDAI ≥ 3.5 before the initiation of anti-TNF therapy. In addition to demographic information and BASDAI, we measured C-reactive protein (CRP) at the time of blood draw in AS patients.
The healthy controls had no history of autoimmune diseases or spondyloarthritis-related manifestations and were matched for sex, age, and ethnicity to AS patients. Patients with SLE and SSc were also investigated as disease controls in order to identify gene expression patterns that are specific to AS and are not related only to presence of systemic inflammation. Patients with SSc or SLE were recruited from the continuing longitudinal studies or clinical practice of the investigators at UTHSC-H. All SSc patients met the 1980 American College of Rheumatology (ACR) preliminary criteria for the classification of SSc11. Similarly, all SLE patients fulfilled the ACR classification criteria for SLE12 and had signs of active disease in at least 2 categories of the Systemic Lupus Activity Measure-Revised13. Patients with SSc or SLE receiving immunosuppressive agents other than low-dose steroids (prednisone ≤ 5 mg) and hydroxychloroquine were excluded from the study. The comparison group for the patients with SSc or SLE were healthy controls matched for sex, age, and ethnicity to patients with SSc.
All study subjects provided written informed consent and the study was approved by the institutional review boards of all participating centers.
Sample processing and microarray experiments
Whole-blood samples for gene expression studies were drawn directly into PAXgene™ tubes (PreAnalytix, Hombrechtikon, Switzerland). All blood samples were processed in the laboratories of the Division of Rheumatology and Clinical Immunogenetics, UTHCS-H. Total RNA was isolated and purified according to the manufacturer’s protocol using PAXgene RNA Kit. The RNA quality and yield was assessed by NanoDrop ND-10000 Spectrophotometer (NanoDrop Technologies, Wilmington, DE, USA) and Agilent 2100 Bioanalyzer (Agilent Technologies, Palo Alto, CA, USA). A globin reduction was not done because this procedure did not increase percentage of present calls in a preliminary experiment with 9 healthy control samples. This finding might be explained by the longer transcript probes printed on the Illumina arrays (50 mer probes) in comparison to Affymetrix arrays.
Two hundred nanograms of total RNA were amplified and purified utilizing Illumina TotalPrep RNA Amplification Kit (Applied Biosystems/Ambion, Austin, TX, USA) according to the manufacturer’s instructions. We hybridized the amplified cRNA on Illumina Human Ref-8v2 arrays and extracted the data utilizing the Illumina Beadstudio software (Illumina, San Diego, CA, USA).
Microarray data analysis
The raw data were exported into BRB-ArrayTools v. 3.7 (R. Simon and A. Pen Lam, National Cancer Institute, Bethesda, MD, USA).
Probes whose signal detection p values indicated no significant difference from those of the negative controls (p < 0.01) were removed from the analysis. In addition, we excluded genes whose expression values were missing or were filtered out in more than 50% of experiments. Expression data were normalized using the median over the entire array. We used less stringent criteria for detection of differentially expressed genes in order to increase detection of any transcripts with altered gene expression. A gene was defined as differentially expressed for all comparisons when the significance level for comparison was p < 0.01, utilizing a random variance t test14. The set of differentially expressed genes was modeled in Ingenuity Pathway Analysis (Ingenuity Systems, Redwood City, CA, USA) to detect pathways or biological processes involving these genes.
Real-time quantitative PCR
Quatitative PCR (qPCR) assays for TLR4 and TLR5 were designed to confirm the microarray results. The assay details including the primer sequence, lowest limit of detection, and PCR efficiency are shown in Table 1. Each sample was assayed in triplicate plus a control without reverse transcriptase to access DNA contamination. Samples were reverse transcribed into cDNA using superscript II reverse transcriptase (Invitrogen, Carlsbad, CA, USA) for 30 min at 50°C in 384-well plates. PCR master mix containing JumpStart Taq Polymerase (Sigma, St. Louis, MO, USA) was added to the samples. Each assembled plate was run in a 7900 real-time instrument using the following PCR conditions: 95°C for 1 min, followed by 40 cycles of 95°C for 12 s and 60°C for 30 s. Results were analyzed utilizing SDS 2.3 (7900) software (Applied Biosystems, Foster City, CA, USA) with FAM reporter and ROX as the reference dye. The final data were normalized to 18s rRNA levels. The final data were presented as the molecules of the transcript divided by the molecules of 18sRNA transcript × 100.
Table 1.
Details of quantitative PCR
| Gene | Accession No. | Primer and Probe | Amplicon Length |
PCR Efficiency |
Lower Limit of Detection (molecules) |
|---|---|---|---|---|---|
| Toll-like receptor 4 | NM_138554 | 500 (+) GAG CCT TTT CTG GAC TAT CAA G* | 81 bases | 95% | 180 |
| 582 (−) TCC AAT GGG GAA GTT CTC TAG* | |||||
| 554 (−) FAM-AGA TTT GTC TCC ACA GCC ACC AGC-BHQ1† | |||||
| Toll-like receptor 5 | NM_003268 | 2209 (+) GCC ATC TGA CTG CAT TAA GG* | 84 bases | 95% | 170 |
| 2284 (−) GCA GGT AAA TCA TTG TGA GAA AG* | |||||
| 2237 (+) FAM-CCT CAA CTC CAA CAG GCT GAC AGT-BHQ1† |
Primer sequence.
Probe sequence.
Statistical analysis
Continuous variables were analyzed by t test if the dependent variable had a normal distribution. The Mann-Whitney nonparametric test was used if the outcome variable did not have a normal distribution. We compared the gene expression values, CRP, and BASDAI scores between pre- and post-anti-TNF treatment samples utilizing a paired T test if model assumptions were met, otherwise Wilcoxon signed-rank test was applied. Linear regression was used to investigate the relationship among 2 continuous variables. Two-sided p values < 0.05 were considered significant. Analyses were performed utilizing the NCSS 2007 statistical program (NCSS, Kaysville, UT, USA).
RESULTS
Characteristics of study groups
A total of 16 patients with AS and 14 healthy controls were examined in the first group. There were no significant differences in age, sex, and ethnicity between patients and controls. Table 2 shows the demographic characteristics, presence of spondyloarthritis (SpA) related manifestations, and other clinical features in participants. No control subjects had a SpA-related manifestation. The majority of AS patients (75%) were male. Among AS patients, the mean BASDAI score was 5.31 (± 2.01 SD) and the median CRP was 0.59 mg/dl. All AS patients in this group were HLA-B27-positive. We also investigated the gene expression profile of 74 patients with SSc (female 79.7%, mean age 49.16 yrs), 21 matched controls (female 80.95%, mean age 53.53 yrs), and 17 patients with SLE (female 94.12%, mean age 38.5 yrs).
Table 2.
Demographic features of patients with AS and their matched controls in both samples
| Feature | Discovery Group | Confirmation Group | ||
|---|---|---|---|---|
| AS, n = 16 |
Control, n = 14 |
AS, n = 27 |
Control, n = 27 |
|
| Age, mean (SD) yrs | 36.01 (11.94) | 32.11 (7.34) | 36.08 (11.4) | 37.21 (10.68) |
| No. male (%) | 12 (75) | 10 (71.43) | 14 (51.85) | 14 (51.85) |
| No. Caucasian (%) | 13 (81.25) | 11 (78.57) | 17 (62.96) | 17 (62.96) |
| Disease duration | 16.09 (12.87) | NA | 11.55 (5.86) | NA |
| BASDAI* | 5.31 (2.01) | NA | 5.93 (1.35) | NA |
| C-reactive protein | 1.4 (2.23) | NA | 1.56 (2.17) | NA |
| Uveitis | 3 (18.75) | 0 | 14 (51.85) | 0 |
| Psoriasis | 1 (6.25) | 0 | 3 (11.11) | 0 |
| Peripheral inflammatory arthritis | 10 (62.5) | 0 | 7 (25.93) | 0 |
| Crohn’s disease | 0 | 0 | 3 (11.11) | 0 |
BASDAI: Bath Ankylosing Spondylitis Disease Activity Index; NA: not applicable.
Gene expression microarrays show upregulation of nuclear factor-κB and TLR pathways in AS
A total of 8230 transcripts passed our filtering criteria across all the peripheral blood samples. Clustering analyses according to date of hybridization or chip number indicated no technical artifact.
A comparison of 16 AS patients with their matched controls revealed 83 differentially expressed transcripts. An unsupervised hierarchical clustering of these genes in AS patients and their controls is shown in Figure 1. A list of these genes is provided in Appendix 1. In a similar analysis, comparison of SLE and SSc samples to their matched controls resulted in 936 and 530 differentially expressed transcripts, respectively. The most prominent gene expression pattern among SLE and SSc patients consisted of upregulation of genes belonging IFN-related pathways15, whereas we did not observe an overrepresentation of up- or down-regulated genes belonging to IFN pathways in comparisons of AS patients to controls in the Ingenuity Pathway Analysis.
Figure 1.
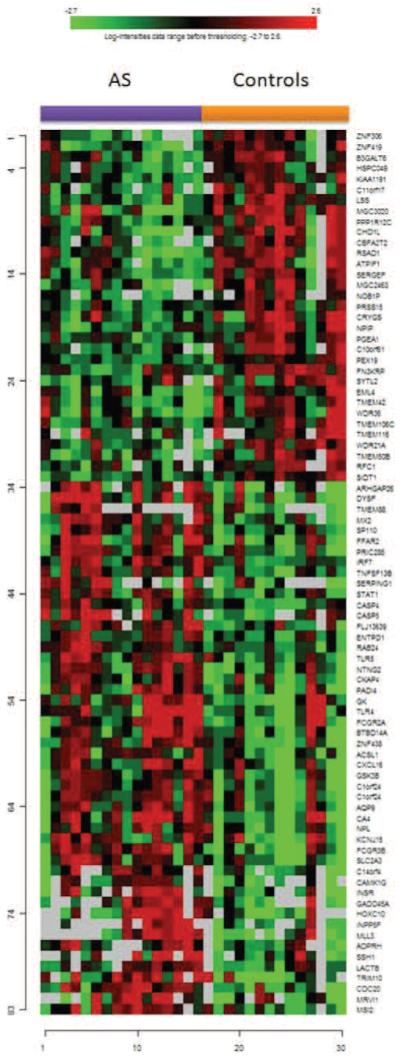
Unsupervised hierarchical clustering of 83 genes identified as differentially expressed between patients with AS and controls.
Then we filtered the differentially expressed genes in AS through the lists of differentially expressed transcripts in SLE and SSc, which resulted in 52 transcripts corresponding to 51 genes that were uniquely differentially expressed among AS patients (Appendix 2). Ingenuity Pathway Analysis of these 52 transcripts demonstrated overrepresentation of transcripts belonging to pathways involved in TLR signaling. TLR4 (p = 0.008) and TLR5 (p = 0.006) were overexpressed in AS patients but not in patients with SLE or SSc. No other subtype of TLR was differentially expressed in AS patients.
The significantly dysregulated pathways were nuclear factor-κB signaling, dendritic cell maturation, TLR, TREM1 signaling, and BRCA1 in DNA damage (Table 3). It is notable that TLR play a major role in the activation of the first 4 pathways. Specifically, TLR4 and TLR5 were the only dysregulated genes that were present in all these 4 pathways.
Table 3.
Dysregulated pathways in comparison of patients with AS and unaffected controls according to Ingenuity Pathway Analysis
| Canonical Pathways | p |
|---|---|
| Nuclear factor-κB signaling | 0.0006 |
| Dendritic cell maturation | 0.008 |
| Toll-like receptor signaling | 0.008 |
| TREM1 signaling | 0.01 |
| BRCA1 in DNA damage response | 0.009 |
We next assessed TLR4 and TLR5 levels in patients with AS, their matched controls, and patients with SLE using qPCR. In agreement with the microarray results, AS patients had higher TLR4 (p = 0.012) and TLR5 (p = 0.006) levels than controls. Similarly, in comparison to SLE, AS patients showed overexpression of TLR4 (p = 0.002) and TLR5 (p = 0.008), whereas TLR4 (p = 0.203) and TLR5 (p = 0.383) levels did not differ significantly between SLE patients and controls. Figure 2 shows the TLR4 and TLR5 levels among these 3 study groups. Further, TLR4 and TLR5 levels correlated highly with each other (p < 0.001, r2 = 0.62).
Figure 2.
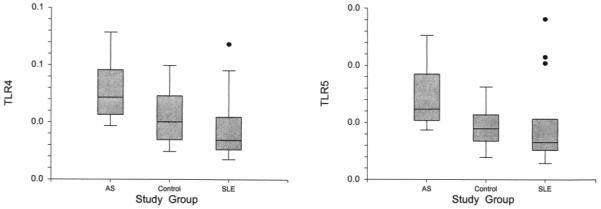
Gene expression levels of TLR4 and TLR5 in AS, SLE, and controls by qPCR in the first study sample. Expression of both genes is higher in AS patients in comparison to controls and SLE patients, while there was no significant difference between SLE patients and controls.
Overexpression of TLR4 and TLR5 was confirmed in a separate group of AS patients
We next examined the TLR4 and TLR5 levels in a second larger sample of 27 patients with AS and 27 matched healthy controls. A total of 22 patients with AS (81.5%) were HLA-B27-positive; characteristics of patients and controls in the confirmation group are shown in Table 2. One sample before and another one after anti-TNF treatment were investigated on each AS patient. The CRP and BASDAI score of AS patients before anti-TNF treatment were 0.791 mg/dl (median) and 5.93 ± 1.35 (mean ± SD), respectively. As expected, both CRP (p = 0.005) and BASDAI score (p < 0.001) decreased significantly upon anti-TNF treatment to 0.095 mg/dl (median) and 3.49 ± 2.33 (mean ± SD), respectively.
Compared to their matched controls, we again observed higher TLR4 (p = 0.007) and TLR5 (p = 0.012) levels in AS patients before initiation of the anti-TNF treatment. However, TLR4 and TLR5 levels in AS samples after anti-TNF treatment did not differ significantly from controls (p = 0.126, p = 0.173, respectively). Figure 3 shows TLR4 and TLR5 levels in the AS samples before and after initiation of anti-TNF treatment and in controls. Similarly to the initial sample, TLR4 and TLR5 levels also correlated significantly with each other (p < 0.001, r2 = 0.44).
Figure 3.
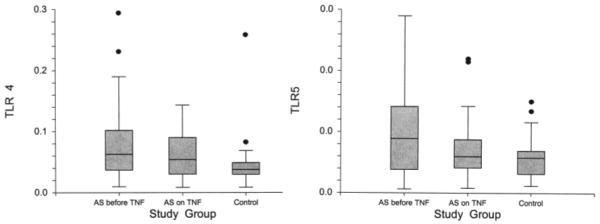
Gene expression levels of TLR4 and TLR5 in patients with AS before and during anti-TNF treatment, as well as controls, in the second study sample. Gene expression levels of both genes decreased significantly after anti-TNF treatment among AS patients. Again, before anti-TNF treatment, samples showed higher TLR4 and TLR5 levels than controls. After anti-TNF treatment, there was no significant difference between AS patients and controls.
TLR4 and TLR5 levels decreased significantly after TNF blockade
TLR4 levels decreased significantly after initiation of anti-TNF treatment from 0.072 to 0.046 (p = 0.002) in patients with AS. Similarly, the TLR5 levels also declined significantly on treatment with anti-TNF from 0.005 to 0.0038 (p = 0.025; Figure 3). Further, the percentage changes in TLR4 and TLR5 after TNF blockade correlated highly with each other (p < 0.001, r2 = 0.75).
TLR4 and TLR5 levels in relationship with clinical features
BASDAI scores did not correlate with TLR4 and TLR5 levels in either study cohort (data not shown). Although CRP levels correlated with TLR4 and TLR5 levels in the initial sample (p = 0.015, r2 = 0.4 and p = 0.001, r2 = 0.6, respectively), we could not confirm this finding among pre-TNF samples in the second study group (p = 0.833 for TLR4, p = 0.753 for TLR5). Among the patients with AS, history of uveitis, psoriasis, peripheral inflammatory arthritis, or Crohn’s disease did not correlate with TLR4 and TLR5 levels in the 2 study cohorts (data not shown). Further, there was no significant difference in TLR4 and TLR5 levels between the HLA-B27-positive and HLA-B27-negative AS patients (p = 0.454, p = 0.319, respectively).
DISCUSSION
We observed that PBC global gene expression profiling of patients with AS showed a dysregulation of TLR-related pathways. We specifically identified an overexpression of TLR4 and TLR5, which also was confirmed by qPCR in the initial and a separate confirmatory sample. Differential regulation of these genes appeared to be unique to AS and was not observed in SLE or SSc. Our study is the first report of increased expression of TLR5 in AS.
An abnormal host response against pathogens has been implicated in the pathogenesis of AS and other SpA subtypes. Further, 60% of patients with SpA without evidence of clinical Crohn’s disease have endoscopic or histological signs of gut inflammation16. Moreover, studies with B27-transgenic rats provide support for the role of commensal gut flora in the pathogensis of HLA-B27-associated gut and joint manifestations. The B27-transgenic rats do not develop inflammatory intestinal or peripheral joint disease in a germ-free environment17.
TLR are primarily involved in innate immune responses to microbial pathogens by recognition of conserved pathogen-associated molecular patterns18,19. More than 10 TLR subtypes have been identified. In our study, TLR4 and TLR5 were the only TLR subtypes that were overexpressed among patients with AS. Lipopolysaccharide (LPS) in the outer membrane of Gram-negative bacteria is the main ligand of TLR419. In animal models, TLR4 plays a critical role in the early cytokine response of phagocytes upon infection with reactive arthritis-associated Gram-negative bacteria such as Yersinia, Salmonella, and Chlamydia20,21,22. An upregulation of TLR4 among patients with AS has been previously reported. De Rycke, et al reported increased expression of TLR4 but not TLR2 on PBMC of patients with SpA in comparison to controls23. Yang, et al showed that the expression of TLR4 on lymphocytes, monocytes, and neutrophils was all significantly increased among patients with AS24.
The main ligand for TLR5 is flagellin, a primary component of bacterial flagella that extend from the outer membrane of Gram-negative bacteria. Flagella are known to be major antigens of Gram-negative bacteria like Salmonella, Escherichia coli, and Yersinia, where its antigenicity serves as the basis for H serotyping25,26,27. There are no published reports on the role of TLR5 in AS or other SpA subtypes. However, both TLR5 and flagellin have been implicated in the pathogenesis of Crohn’s disease (reviewed by Gewirtz28). A study investigating the proteins of commensal microflora that were reactive with antisera from a colitic mouse model identified flagellins as the dominant antigen. Further, serum IgG to these flagellins was elevated in patients with Crohn’s disease but not in patients with ulcerative colitis or controls29. In another study, flagellin exposure to injured mouse colon in vivo, but not intact colon, significantly worsened colonic inflammation, whereas TLR2-specific agonists did not have a similar effect30. A TLR5 stop-polymorphism was negatively associated with Crohn’s disease in Ashkenazi Jewish patients, raising the possibility that a downregulation in TLR5 provides protection against development of Crohn’s disease31.
AS and Crohn’s disease share common clinical features and genetic background. Up to one-third of patients with Crohn’s disease have sacroiliac joint involvement similar to AS on computer tomography32, whereas roughly 60% of patients with SpA have subclinical colitis by biopsy16. These similarities, along with our data, suggest that the role of TLR5 in the pathogenesis of AS should be further explored in mechanistic studies. We did not observe any significant difference in TLR5 levels between the AS patients with and those without Crohn’s disease in our study (p = 0.769). This finding suggests that the overexpression of TLR5 in AS is independent of the presence of clinically apparent Crohn’s disease. However, our study might have been underpowered to detect a relationship between TLR5 expression and presence of Crohn’s disease in patients with AS.
Activation of the innate immune system such as polymorphonuclear cells and macrophages plays an important role in AS-related inflammation. Patients with SpA have significantly higher neutrophil counts and lower lymphoid aggregates than patients with rheumatoid arthritis (RA) on synovial histology33. Further, macrophages expressing the hemoglobin scavenger receptor CD163 are increased in the synovial lining of patients with SpA compared to RA patients. CD163+ macrophages also are increased in the colonic lamina proporia in SpA patients compared to controls, supporting the hypothesis of a recirculation of similar clones in the intestinal mucosa and synovium34. Of interest, both TLR4 and TLR5 can induce an acute shedding of CD163 from human monocytes. As well, these 2 TLR subtypes have a synergistic effect on upregulation of CD163, whereas exogenous recombinant IFN-γ leads to downregulation of CD16335. Global gene expression studies of macrophages derived from AS patients reveal a “reverse” IFN signature, with IFN-γ upregulated genes being down-regulated7. The observed upregulation of TLR4 and TLR5 in our study, along with the reported “reverse” IFN-γ in AS, are both potential mechanisms that could lead to overexpression CD163+ macrophages in this disease. However, this hypothesis needs to be verified by further mechanistic studies. We did not observe a “reverse” IFN signature in whole-blood samples as described by Smith, et al in macrophages of patients with AS7.
We observed downregulation of TLR4 and TLR5 after initiation of anti-TNF treatment in patients with AS. Both TLR4 and TLR5 can induce secretion of TNF-α and other proinflammatory cytokines30,36. The expression of TLR4 on PBMC decreases gradually after treatment of SpA patients with anti-TNF agents in vivo. These PBMC have a functional impairment in their capacity to produce TNF-α after stimulation with LPS in vitro23. Further, TLR4 mRNA correlated closely with serum TNF-α levels among patients with AS24. These findings suggest that TNF blockade attenuates a self-perpetuating activation of the innate immune system via the TLR pathway.
The TLR4 and TLR5 levels and their percentage changes after TNF blockade correlated closely with each other, which raises the possibility that they are both triggered by the same mechanism, whereas we did not observe such a strong correlation of these 2 transcripts with general markers of inflammation such as CRP.
The data on correlation of TLR4 and TLR5 levels with CRP in our study were not consistent. While we observed a significant correlation in the first sample, we could not confirm this finding in the second cohort. These results did not change even after we excluded the HLA-B27-negative patients from the analysis (data not shown). Similarly, De Rycke, et al23 did not observe a correlation of TLR4 expression with CRP in SpA, whereas Yang, et al24 reported correlation of TLR4 mRNA levels with CRP in HLA-B27-positive patients with AS. Studies with larger sample sizes are needed to resolve this issue.
Potential limitations of our study are that we used less stringent criteria for identification of differentially expressed genes in microarray data analysis in order to increase our ability to detect dysregulated genes and pathways. However, we verified the overexpression of TLR4 and TLR5 with qPCR in the same sample in addition to a separate confirmatory cohort. We compared the global gene expression of AS patients to transcriptosomes of patients with SLE and SSc. These comparative studies should be extended to patients with other rheumatological diseases such as RA in future investigations. Further, the observed fold-changes in TLR4 and TLR5 between AS patients and controls were relatively small (< 2-fold). However, whole-blood samples consist of heterogenous populations of white blood cell subtypes. It is possible the observed differential expression levels in whole blood are secondary to much higher-fold changes in a particular subset of white blood cells. We focused on dysregulation of TLR transcripts. However, the other observed differentially expressed transcripts and pathways in this study also could play an important role in the pathogenesis of AS. For example, the observed dysregulations in the dendritic cell maturation pathway may provide further support for the importance of defective functional capacity of dendritic cells in SpA37.
In summary, our global gene expression analysis revealed the TLR-related pathways as the most prominently dysregulated biological process in AS. We identified TLR4 and TLR5 as the only dysregulated subtypes of TLR in AS. We confirmed the overexpression of these 2 genes among patients with AS in the same sample and in a confirmatory cohort. We showed that the expression of both receptors decreased after initiation of anti-TNF treatment. Our findings provide further support for the importance of TLR subtypes responsive to Gram-negative bacteria in the pathogenesis of AS. Mechanistic studies are needed to elucidate the role of these TLR subtypes in the development of AS.
ACKNOWLEDGMENT
The authors thank Laura Diekman, Stephanie Brown, Lori Guthrie, and Vera Wirawan for help with data collection and management. We are also grateful to Dr. David Loose, Dr. Gregory Shipley, Nancy Shipley, and Jun Ying for assistance in design and performance of the laboratory studies.
Supported by American College of Rheumatology Clinical Investigator Fellowship Award and NIH-KL2RR024149-04 (Dr. Assassi); NIH/NIAMS P01-AR-052915-01 (Dr. Reveille, Dr. Weisman); NIH/CORT P50AR054144 (Dr. Arnett, Dr. Mayes); the Intramural Research Program, NIAMS/NIH (Dr. Ward); and NIH/NCRR Clinical and Translational Sciences Award (CTSA), UL1-RR024148
Appendix 1
Differentially expressed genes in AS compared to controls
| Parametric p value |
Geom mean
of intensities in class 1 (AS) |
Geom mean
of intensities in class 2 (control) |
Fold-change | GB acc | Gene symbol | Defined Gene list |
|---|---|---|---|---|---|---|
| 0.000478 | 137.0849484 | 191.4323799 | 0.7161012 | NM 002340 | LSS | Biosynthesis of steroids |
| 0.0006957 | 9364.319315 | 4899.472307 | 1.9112914 | NM 000570 | FCGR3B | Natural killer cell mediated cytotoxicity, immunology |
| 0.0009312 | 70.135071 | 39.2769027 | 1.7856569 | NM 198330 | INPP5F | |
| 0.0010988 | 71.4184127 | 45,7446495 | 1.5612408 | NM 001255 | CDC20 | Cell cycle, Ubiquitin mediated proteolysis |
| 0.0011141 | 52.8656567 | 70.9770793 | 0.7448272 | NM 001013840 | C10orf61 | |
| 0.0011586 | 392.3825626 | 275.9854116 | 1.4217511 | NM 182755 | ZNF438 | |
| 0.0017355 | 61.4036443 | 44.5498863 | 1.378312 | NM 001125 | ADPRH | |
| 0.0018922 | 87.5243114 | 47.5085126 | 1.8422869 | NM 170606 | MLL3 | Lysine degradation |
| 0.002143 | 53.3984454 | 71.3663158 | 0.7482304 | NM 014062 | NOB1P | |
| 0.0021903 | 233.0709896 | 183.0490111 | 1.273271 | NM 001031677 | RAB24 | |
| 0.002331 | 78.1171224 | 97.3888835 | 0.8021154 | NM 017699 | SIDT1 | |
| 0.002457 | 55.4244192 | 75.0410081 | 0.7385884 | NM 020642 | C11orf17 | |
| 0.0025345 | 956.4176519 | 673.3678999 | 1.4203493 | NM 033405 | PRIC285 | |
| 0.002748 | 111.8853999 | 65.758725 | 1.7014533 | NM 015071 | ARHGAP26 | |
| 0.002797 | 77.7048739 | 43.8710092 | 1.7712124 | NM 018984 | SSH1 | Regulation of actin cytoskeleton |
| 0.0031593 | 96.3060504 | 70.9280275 | 1.3577996 | NM 001031719 | FU13639 | |
| 0.0032597 | 74.3860187 | 107.9506798 | 0.6890741 | NM 006134 | TMEM50B | |
| 0.0034606 | 144.2016183 | 198.6110208 | 0.7260504 | NM 144638 | TMEM42 | Role of Ran in mitotic spindle regulation |
| 0.0035429 | 121.5756396 | 65.759618 | 1.8487887 | NM 052828 | TRIM10 | |
| 0.0035783 | 76.7861621 | 100.233922 | 0.7660696 | NM 181340 | WDR21A | |
| 0.0037429 | 1428.384827 | 1074.9697 | 1.3287675 | NM 006573 | TNFSF13B | TACI and BCMA stimulation of B
cell immune responses., Cytokine-cytokine receptor interaction |
| 0.0038303 | 2308.950828 | 1401.307414 | 1.6477118 | NM 003494 | DYSF | |
| 0.003983 | 287.009692 | 225.0477753 | 1.2753278 | NM 001776 | ENTPD1 | |
| 0.004009 | 136.1716197 | 185.1636214 | 0.7354124 | NM 006985 | NPIP | |
| 0.0040379 | 89.442346 | 60.228624 | 1.4850471 | NM 002463 | MX2 | cell_signaling |
| 0.0041087 | 636.3160782 | 820.7957534 | 0.7752429 | NM 024619 | FN3KRP | |
| 0.0041129 | 54.5849904 | 70.7770909 | 0.771224 | NM 024493 | ZNF306 | |
| 0.0042 | 129.564397 | 206.5903427 | 0.6271561 | NM 024048 | MGC3020 | |
| 0.0043066 | 77.2854192 | 113.9056458 | 0.6785039 | NM 004284 | CHD1L | |
| 0.0044582 | 313.8851602 | 213.5519415 | 1.4698305 | NM 000167 | GK | Glycerolipid metabolism, PPAR signaling pathway |
| 0.004488 | 106.5122966 | 151.1224528 | 0.7048079 | NM 018346 | RSAD1 | |
| 0.0045615 | 64.1665543 | 96.0495151 | 0.668057 | NM 138341 | TMEM116 | |
| 0.0051912 | 433.4919731 | 308.0187609 | 1.4073557 | NM 002093 | GSK3B | |
| 0.0053976 | 83.1198159 | 48.5045894 | 1,7136485 | NM 203411 | TMEM88 | |
| 0.0054644 | 249.0470921 | 304.1155458 | 0.8189226 | NM 020444 | KIAA1191 | |
| 0.0057117 | 1224.60185 | 822.4718523 | 1.4889286 | NM 022059 | CXCL16 | |
| 0.0057841 | 110.4525818 | 142.0882007 | 0.7773522 | NM 080605 | B3GALT6 | Chondroitin sulfate
biosynthesis, Glycan structures - biosynthesis 1 |
| 0.0059993 | 6755.193466 | 4676.588102 | 1.4444705 | NM 006931 | SLC2A3 | Vitamin C in the Brain, cell_signaling, misc, pharmacology |
| 0.0060617 | 57.8154193 | 37.7067951 | 1.5332891 | NM 020439 | CAMK1G | |
| 0.0062033 | 107.4822883 | 141.3133872 | 0.7605952 | NM 024691 | ZNF419 | |
| 0.0062233 | 393.164908 | 285.6590853 | 1.3763431 | NM 003268 | TLR5 | Toll-like receptor signaling pathway, immunology |
| 0.006241 | 706.5141744 | 366.4292943 | 1.9281051 | NM 000717 | CA4 | Nitrogen metabolism |
| 0.0062475 | 4308.608064 | 2917.50243 | 1.4768139 | NM 021642 | FCGR2A | immunology |
| 0.0063598 | 1500.259142 | 1159.001672 | 1.2944409 | NM 004031 | IRF7 | gene_regulation, transcription |
| 0.0064295 | 4468.985126 | 3070.56217 | 1.455429 | NM 012387 | PADI4 | |
| 0.0065349 | 162.9657928 | 206.0056073 | 0.7910745 | NM 012139 | SERGEF | |
| 0.0065475 | 3763.198465 | 2463.563116 | 1.5275429 | NM 022083 | C1orf24 | |
| 0.0065818 | 169.8341703 | 202.8024016 | 0.8374367 | NM 002857 | PEX19 | |
| 0.0068421 | 121.5985049 | 67.4619564 | 1.8024752 | NM 130385 | MRVI1 | |
| 0.0069067 | 4094.439362 | 3127.288913 | 1.3092616 | NM 139266 | STAT1 | Apoptotic Signaling in Response
to DNA Damage, EGF Signaling Pathway, IFN alpha signaling pathway, IFN gamma signaling pathway, IL22 Soluble Receptor Signaling Pathway , Inhibition of Cellular Proliferation by Gleevec, MAPKinase Signaling Pathway, p38 MAPK Signaling Pathway, PDGF Signaling Pathway, TPO Signaling Pathway, Jak-STAT signaling pathway, Toll-like receptor signaling pathway, angiogenesis, immunology, signal_transduction |
| 0.0069214 | 79.185264 | 50.4842138 | 1.5685153 | NM 004347 | CASP5 | MAPK signaling pathway, apoptosis, immunology |
| 0.0069767 | 2792.841513 | 2234.522646 | 1.2498605 | NM 033306 | CASP4 | Caspase Cascade in Apoptosis,
MAPK signaling pathway, apoptosis, immunology |
| 0.0069791 | 57.8324274 | 41.4198501 | 1.3962491 | NM 024496 | C14orf4 | |
| 0.0070871 | 458.6254977 | 334.7400414 | 1.3700945 | NM 032536 | NTNG2 | |
| 0.0072365 | 309.1783279 | 239.2651331 | 1.2921997 | NM 080424 | SP110 | |
| 0.0075236 | 2360.736625 | 1641.346746 | 1.4382924 | NM 001995 | ACSL1 | Perou’s- Intrinsic-
Breast-Cancer-Genes, Adipocytokine signaling pathway, Fatty acid metabolism, PPAR signaling pathway |
| 0.0075429 | 101.3066589 | 143.8378404 | 0.7043116 | NM 016311 | ATPIF1 | |
| 0.0075842 | 55.9221565 | 71.0356931 | 0.7872402 | NM 002913 | RFC1 | |
| 0 007629 | 284.5814239 | 197.0116273 | 1.4444905 | NM 138557 | TLR4 | immunology |
| 0.0078644 | 8192.608896 | 5797.077578 | 1.4132309 | NM 020980 | AQP9 | |
| 0.0079295 | 352.6683885 | 228.2252792 | 1.5452644 | NM 002243 | KCNJ15 | |
| 0.0079915 | 69.4960341 | 55.0535557 | 1.2623351 | NM 171846 | LACTB | |
| 0.0080308 | 4230.418121 | 2883.942998 | 1.4668869 | NM 022083 | C1orf24 | |
| 0.0080335 | 61.6309441 | 80.2352561 | 0,768128 | NM 001032999 | CBFA2T2 | cell_cycle, immunology |
| 0.0080701 | 78.1569398 | 53.726485 | 1.454719 | NM 001924 | GADD45A | ATM Signaling Pathway, Cell
Cycle: G2/M Checkpoint, Hypoxia and p53 in the Cardiovascular system, p53 Signaling Pathway, Cell cycle, MAPK signaling pathway |
| 0.0083262 | 1358.69924 | 985.1936551 | 1.379119 | NM 030769 | NPL | |
| 0.0084262 | 961.6377224 | 682.6056177 | 1.408775 | NM 006825 | CKAP4 | |
| 0.0084503 | 87.9484113 | 65.2853476 | 1.3471386 | NM 138962 | MSI2 | |
| 0.0085554 | 597.6472872 | 398.0354876 | 1.5014925 | NM 005306 | FFAR2 | |
| 0.0087672 | 95.5304166 | 51.085383 | 1.8700147 | NM 000062 | SERPING1 | Intrinsic Prothrombin
Activation Pathway, Complement and coagulation cascades |
| 0.0090354 | 158.4264733 | 192.559439 | 0.8230003 | NM 004793 | PRSS15 | |
| 0.0091097 | 198.4911419 | 136.4177609 | 1.4550242 | NM 144653 | BTBD14A | |
| 0.009238 | 83.129073 | 110.3058286 | 0.7536236 | NM 017607 | PPP1R12C | |
| 0.0092556 | 126.8566834 | 181.5263622 | 0.6988334 | NM 139281 | WDR36 | |
| 0.0092918 | 70.2149582 | 85.965983 | 0.8167761 | NM 014149 | HSPC049 | |
| 0.0093926 | 117.3907998 | 154.3682162 | 0.7604597 | NM 017541 | CRYGS | |
| 0.0095282 | 154.6194436 | 194.177994 | 0.7962769 | NM 024056 | TMEM106C | |
| 0.0095422 | 122.7966001 | 150.2197121 | 0.8174466 | NM 001002880 | PGEA1 | |
| 0.0095887 | 892.9376363 | 1196.945428 | 0.7460137 | NM 019063 | EML4 | |
| 0.0096633 | 89.6226922 | 56.5656362 | 1.5844017 | NM 017409 | HOXC10 | development |
| 0.0096843 | 85.2460615 | 116.6847675 | 0.7305672 | NM 024070 | MGC2463 | |
| 0.0097158 | 114.2832903 | 153.2233268 | 0.7458609 | NM 206930 | SYTL2 | |
| 0.0097279 | 59.7622428 | 38.6757469 | 1.5452124 | NM 000208 | INSR | Control of skeletal myogenesis
by HDAC & calcium/calmodulin-dependent kinase (CaMK), Growth Hormone Signaling Pathway, Insulin Signaling Pathway, Adherens junction, Dentatorubropallidoluysian atrophy (DRPLA), Insulin signaling pathway. Type II diabetes mellitus, immunology |
Appendix 2
Genes that were only differentially expressed in AS
| Parametric p value |
Geom
mean of intensities in class 1 (AS) |
Geom
mean of intensities in class 2 (AS) |
Fold-change | GB acc | Gene symbol | Defined Gene list | Gene involved in the
dysregulated pathyways in Table 3 |
|---|---|---|---|---|---|---|---|
| 0.0006957 | 9364.31931 | 4899.47231 | 1.9112914 | NM 000570 | FCGR3B | Natural killer cell
mediated cytotoxicity, immunology |
Dendritic Cell Maturation |
| 0.0009312 | 70.135071 | 39.2769027 | 1.7856569 | NM 198330 | INPP5F | ||
| 0.0011141 | 52.8656567 | 70.9770793 | 0.7448272 | NM 001013840 | C10orf61 | ||
| 0.0017355 | 61.4036443 | 44.5498863 | 1.378312 | MM 001125 | ADPRH | ||
| 0.0018922 | 87.5243114 | 47.5085126 | 1.8422869 | NM 170606 | MLL3 | Lysine degradation | |
| 0.002143 | 53.3984454 | 71.3663158 | 0.7482304 | NM 014062 | NOB1P | ||
| 0.0021903 | 233.07099 | 183.049011 | 1.273271 | NM 001031677 | RAB24 | ||
| 0.002331 | 78.1171224 | 97.3888835 | 0.8021154 | NM 017699 | SIDT1 | ||
| 0.002457 | 55.4244192 | 75.0410081 | 0.7385884 | NM 020642 | C11orf17 | ||
| 0.002748 | 111.8854 | 65.758725 | 1.7014533 | NM 015071 | ARHGAP26 | ||
| 0.002797 | 77.7048739 | 43.8710092 | 1.7712124 | NM 018984 | SSH1 | Regulation of actin cytoskeleton | |
| 0.0031593 | 96.3060504 | 70.9280275 | 1.3577996 | NM 001031719 | FLJ13639 | ||
| 0.0035429 | 121.57564 | 65.759618 | 1.8487887 | NM 052828 | TRIM10 | ||
| 0.0035783 | 76.7861621 | 100.233922 | 0.7660696 | NM 181340 | WDR21A | ||
| 0.0038303 | 2308.95083 | 1401.30741 | 1.6477118 | NM 003494 | DYSF | ||
| 0.0041087 | 636.316078 | 820.795753 | 0.7752429 | NM 024619 | FN3KRP | ||
| 0.0041129 | 54.5849904 | 70.7770909 | 0.771224 | NM 024493 | ZNF306 | ||
| 0.0043066 | 77.2854192 | 113.905646 | 0.6785039 | NM 004284 | CHD1L | ||
| 0.0044582 | 313.88516 | 213.551942 | 1.4698305 | NM 000167 | GK | Glycerolipid metabolism,
PPAR signaling pathway |
|
| 0.004488 | 106.512297 | 151.122453 | 0.7048079 | NM 018346 | RSAD1 | ||
| 0.0045615 | 64.1665543 | 96.0495151 | 0.668057 | NM 138341 | TMEM116 | ||
| 0.0051912 | 433.491973 | 308.018761 | 1.4073557 | NM 002093 | GSK3B | NF-κB Signaling | |
| 0.0053976 | 83.1198159 | 48.5045894 | 1.7136485 | NM 203411 | TMEM88 | ||
| 0.0057841 | 110.452582 | 142.088201 | 0.7773522 | NM 080605 | B3GALT6 | Chondroitin sulfate
biosynthesis, Glycan structures - biosynthesis 1 |
|
| 0.0059993 | 6755.19347 | 4676.5881 | 1.4444705 | NM 006931 | SLC2A3 | vitamin C in the
Brain, cell_signaling, misc, pharmacology |
|
| 0.0062233 | 393.164908 | 285.659085 | 1.3763431 | NM 003268 | TLR5 | Toll-like receptor
signaling pathway, immunology |
NF-κB Signaling,
Toll-like Receptor Signaling, TREM1 Signaling |
| 0.006241 | 706.514174 | 366.429294 | 1.9281051 | NM 000717 | CA4 | Nitrogen metabolism | |
| 0.0062475 | 4308.60806 | 2917.50243 | 1.4768139 | NM 021642 | FCGR2A | immunology | Dendritic Cell Maturation |
| 0.0064295 | 4468.98513 | 3070.56217 | 1.455429 | NM 012387 | PADI4 | ||
| 0.0065349 | 162.965793 | 206.005607 | 0.7910745 | NM 012139 | SERGEF | ||
| 0.0065349 | 162.965793 | 206.005607 | 0.7910745 | NM 012139 | SERGEF | ||
| 0.0065475 | 3763.19846 | 2463.56312 | 1.5275429 | NM 022083 | C1orf24 | ||
| 0.0065818 | 169.83417 | 202.802402 | 0.8374367 | NM 002857 | PEX19 | ||
| 0.0068421 | 121.598505 | 67.4619564 | 1.8024752 | NM 130385 | MRVI1 | ||
| 0.0069791 | 57.8324274 | 41.4198501 | 1.3962491 | NM 024496 | C14orf4 | ||
| 0.0075236 | 2360.73663 | 1641.34675 | 1.4382924 | NM 001995 | ACSL1 | Perou’s- Intrinsic-
Breast-Cancer- Genes, Adipocytokine signaling pathway, Fatty acid metabolism, PPAR signaling pathway |
|
| 0.0075429 | 101.306659 | 143.83784 | 0.7043116 | NM 016311 | ATPIF1 | ||
| 0.0075842 | 55.9221565 | 71.0356931 | 0.7872402 | NM 002913 | RFC1 | BRCA1 in DNA
Damage Response |
|
| 0.007629 | 284.581424 | 197.011627 | 1.4444905 | NM 138557 | TLR4 | immunology | NF-κB Signaling,
Dendritic Cell Maturation, Toll-like Receptor Signaling, TREM1 Signaling |
| 0.0078644 | 8192.6089 | 5797.07758 | 1.4132309 | NM 020980 | AQP9 | ||
| 0.0079295 | 352.668389 | 228.225279 | 1.5452644 | NM 002243 | KCNJ15 | ||
| 0.0079915 | 69.4960341 | 55.0535557 | 1.2623351 | NM 171846 | LACTB | ||
| 0.0080308 | 4230.41812 | 2883.943 | 1.4668869 | NM 022083 | C1orf24 | ||
| 0.0080701 | 78.1569398 | 53.726485 | 1.454719 | NM 001924 | GADD45A | ATM Signaling Pathway, Cell
Cycle: G2/M Checkpoint, Hypoxia and p53 in the Cardiovascular system, p53 Signaling Pathway, Cell cycle, MAPK signaling pathway |
BRCA1 in DNA
Damage Response |
| 0.0083262 | 1358.69924 | 985.193655 | 1.379119 | NM 030769 | NPL | ||
| 0.0090354 | 158.476473 | 192.559439 | 0.8230003 | NM 004793 | PRSS15 | ||
| 0.0091097 | 198.491142 | 136.417761 | 1.4550242 | NM 144653 | BTBD14A | ||
| 0.009238 | 83.129073 | 110.305829 | 0.7536236 | NM 017607 | PPP1R12C | ||
| 0.0092556 | 126.856683 | 181.526362 | 0.6988334 | NM 139281 | WDR36 | ||
| 0.0095282 | 154.619444 | 194.177994 | 0.7962769 | NM 024056 | TMEM106C | ||
| 0.0095887 | 892.937636 | 1196.94543 | 0.7460137 | NM 019063 | EML4 | ||
| 0.0096633 | 89.6226922 | 56.5656362 | 1.5844017 | NM 017409 | HOXC10 | development | |
| 0.0097279 | 59.7622428 | 38.6757469 | 1.5452124 | NM 000208 | INSR | Control of skeletal myogenesis
by HDAC & calcium/calmodulin- dependent kinase (CaMK), Growth Hormone Signaling Pathway, Insulin Signaling Pathway, Adherens junction, Dentatorubropallidoluysian atrophy (DRPLA), Insulin signaling pathway, Type II diabetes mellitus, immunology |
NF-κB Signaling |
REFERENCES
- 1.Burton PR, Clayton DG, Cardon LR, Craddock N, Deloukas P, Duncanson A, et al. Association scan of 14,500 nonsynonymous SNPs in four diseases identifies autoimmunity variants. Nat Genet. 2007;39:1329–37. doi: 10.1038/ng.2007.17. [DOI] [PMC free article] [PubMed] [Google Scholar]
- 2.Brown MA. Genetics and the pathogenesis of ankylosing spondylitis. Curr Opin Rheumatol. 2009;21:318–23. doi: 10.1097/bor.0b013e32832b3795. [DOI] [PubMed] [Google Scholar]
- 3.Braun J, Sieper J. Ankylosing spondylitis. Lancet. 2007;369:1379–90. doi: 10.1016/S0140-6736(07)60635-7. [DOI] [PubMed] [Google Scholar]
- 4.Gu J, Rihl M, Marker-Hermann E, Baeten D, Kuipers JG, Song YW, et al. Clues to pathogenesis of spondyloarthropathy derived from synovial fluid mononuclear cell gene expression profiles. J Rheumatol. 2002;29:2159–64. [PubMed] [Google Scholar]
- 5.Rihl M, Kellner H, Kellner W, Barthel C, Yu DT, Tak PP, et al. Identification of interleukin-7 as a candidate disease mediator in spondylarthritis. Arthritis Rheum. 2008;58:3430–5. doi: 10.1002/art.23998. [DOI] [PubMed] [Google Scholar]
- 6.Gu J, Marker-Hermann E, Baeten D, Tsai WC, Gladman D, Xiong M, et al. A 588-gene microarray analysis of the peripheral blood mononuclear cells of spondyloarthropathy patients. Rheumatology. 2002;41:759–66. doi: 10.1093/rheumatology/41.7.759. [DOI] [PubMed] [Google Scholar]
- 7.Smith JA, Barnes MD, Hong D, DeLay ML, Inman RD, Colbert RA. Gene expression analysis of macrophages derived from ankylosing spondylitis patients reveals interferon-gamma dysregulation. Arthritis Rheum. 2008;58:1640–9. doi: 10.1002/art.23512. [DOI] [PMC free article] [PubMed] [Google Scholar]
- 8.Duan R, Leo P, Bradbury L, Brown MA, Thomas GP. Gene expression profiling reveals a downregulation in immune-associated genes in patients with AS. Ann Rheum Dis. 2010;69:1724–9. doi: 10.1136/ard.2009.111690. [DOI] [PubMed] [Google Scholar]
- 9.Baechler EC, Batliwalla FM, Karypis G, Gaffney PM, Moser K, Ortmann WA, et al. Expression levels for many genes in human peripheral blood cells are highly sensitive to ex vivo incubation. Genes Immun. 2004;5:347–53. doi: 10.1038/sj.gene.6364098. [DOI] [PubMed] [Google Scholar]
- 10.Goie The HS. Steven MM, van der Linden SM, Cats A. Evaluation of diagnostic criteria for ankylosing spondylitis: a comparison of the Rome, New York and modified New York criteria in patients with a positive clinical history screening test for ankylosing spondylitis. Br J Rheumatol. 1985;24:242–9. doi: 10.1093/rheumatology/24.3.242. [DOI] [PubMed] [Google Scholar]
- 11.Subcommittee for Scleroderma Criteria of the American Rheumatism Association Diagnostic and Therapeutic Criteria Committee Preliminary criteria for the classification of systemic sclerosis (scleroderma) Arthritis Rheum. 1980;23:581–90. doi: 10.1002/art.1780230510. [DOI] [PubMed] [Google Scholar]
- 12.Tan EM, Cohen AS, Fries JF, Masi AT, McShane DJ, Rothfield NF, et al. The 1982 revised criteria for the classification of systemic lupus erythematosus. Arthritis Rheum. 1982;25:1271–7. doi: 10.1002/art.1780251101. [DOI] [PubMed] [Google Scholar]
- 13.Uribe AG, Vila LM, McGwin G, Jr, Sanchez ML, Reveille JD, Alarcon GS. The Systemic Lupus Activity Measure-revised, the Mexican Systemic Lupus Erythematosus Disease Activity Index (SLEDAI), and a modified SLEDAI-2K are adequate instruments to measure disease activity in systemic lupus erythematosus. J Rheumatol. 2004;31:1934–40. [PubMed] [Google Scholar]
- 14.Wright GW, Simon RM. A random variance model for detection of differential gene expression in small microarray experiments. Bioinformatics. 2003;19:2448–55. doi: 10.1093/bioinformatics/btg345. [DOI] [PubMed] [Google Scholar]
- 15.Assassi S, Mayes MD, Arnett FC, Gourh P, Agarwal SK, McNearney TA, et al. Systemic sclerosis and lupus: points in an interferon-mediated continuum. Arthritis Rheum. 2010;62:589–98. doi: 10.1002/art.27224. [DOI] [PMC free article] [PubMed] [Google Scholar]
- 16.Mielants H, Veys EM, Cuvelier C, De Vos M, Goemaere S, De Clercq L, et al. The evolution of spondyloarthropathies in relation to gut histology. II. Histological aspects. J Rheumatol. 1995;22:2273–8. [PubMed] [Google Scholar]
- 17.Taurog JD, Richardson JA, Croft JT, Simmons WA, Zhou M, Fernandez-Sueiro JL, et al. The germfree state prevents development of gut and joint inflammatory disease in HLA-B27 transgenic rats. J Exp Med. 1994;180:2359–64. doi: 10.1084/jem.180.6.2359. [DOI] [PMC free article] [PubMed] [Google Scholar]
- 18.Miyake K. Innate immune sensing of pathogens and danger signals by cell surface Toll-like receptors. Semin Immunol. 2007;19:3–10. doi: 10.1016/j.smim.2006.12.002. [DOI] [PubMed] [Google Scholar]
- 19.Takeda K, Kaisho T, Akira S. Toll-like receptors. Annu Rev Immunol. 2003;21:335–76. doi: 10.1146/annurev.immunol.21.120601.141126. [DOI] [PubMed] [Google Scholar]
- 20.Bulut Y, Faure E, Thomas L, Karahashi H, Michelsen KS, Equils O, et al. Chlamydial heat shock protein 60 activates macrophages and endothelial cells through Toll-like receptor 4 and MD2 in a MyD88-dependent pathway. J Immunol. 2002;168:1435–40. doi: 10.4049/jimmunol.168.3.1435. [DOI] [PubMed] [Google Scholar]
- 21.Sing A, Tvardovskaia N, Rost D, Kirschning CJ, Wagner H, Heesemann J. Contribution of toll-like receptors 2 and 4 in an oral Yersinia enterocolitica mouse infection model. Int J Med Microbiol. 2003;293:341–8. doi: 10.1078/1438-4221-00277. [DOI] [PubMed] [Google Scholar]
- 22.Li Q, Cherayil BJ. Role of Toll-like receptor 4 in macrophage activation and tolerance during Salmonella enterica serovar Typhimurium infection. Infect Immun. 2003;71:4873–82. doi: 10.1128/IAI.71.9.4873-4882.2003. [DOI] [PMC free article] [PubMed] [Google Scholar]
- 23.De Rycke L, Vandooren B, Kruithof E, De Keyser F, Veys EM, Baeten D. Tumor necrosis factor alpha blockade treatment down-modulates the increased systemic and local expression of Toll-like receptor 2 and Toll-like receptor 4 in spondylarthropathy. Arthritis Rheum. 2005;52:2146–58. doi: 10.1002/art.21155. [DOI] [PubMed] [Google Scholar]
- 24.Yang ZX, Liang Y, Zhu Y, Li C, Zhang LZ, Zeng XM, et al. Increased expression of Toll-like receptor 4 in peripheral blood leucocytes and serum levels of some cytokines in patients with ankylosing spondylitis. Clin Exp Immunol. 2007;149:48–55. doi: 10.1111/j.1365-2249.2007.03396.x. [DOI] [PMC free article] [PubMed] [Google Scholar]
- 25.Johnson JR, Orskov I, Orskov F, Goullet P, Picard B, Moseley SL, et al. O, K, and H antigens predict virulence factors, carboxylesterase B pattern, antimicrobial resistance, and host compromise among Escherichia coli strains causing urosepsis. J Infect Dis. 1994;169:119–26. doi: 10.1093/infdis/169.1.119. [DOI] [PubMed] [Google Scholar]
- 26.Aleksic S, Bockemuhl J, Lange F. Studies on the serology of flagellar antigens of Yersinia enterocolitica and related Yersinia species. Zentralbl Bakteriol Mikrobiol Hyg A. 1986;261:299–310. doi: 10.1016/s0176-6724(86)80047-5. [DOI] [PubMed] [Google Scholar]
- 27.Ibrahim GF, Fleet GH, Lyons MJ, Walker RA. Production of potent Salmonella H antisera by immunization with polymeric flagellins. J Clin Microbiol. 1985;22:347–51. doi: 10.1128/jcm.22.3.347-351.1985. [DOI] [PMC free article] [PubMed] [Google Scholar]
- 28.Gewirtz AT. TLRs in the gut. III. Immune responses to flagellin in Crohn’s’s disease: good, bad, or irrelevant? Am J Physiol Gastrointest Liver Physiol. 2007;292:G706–G710. doi: 10.1152/ajpgi.00347.2006. [DOI] [PubMed] [Google Scholar]
- 29.Lodes MJ, Cong Y, Elson CO, Mohamath R, Landers CJ, Targan SR, et al. Bacterial flagellin is a dominant antigen in Crohn disease. J Clin Invest. 2004;113:1296–306. doi: 10.1172/JCI20295. [DOI] [PMC free article] [PubMed] [Google Scholar]
- 30.Rhee SH, Im E, Riegler M, Kokkotou E, O’Brien M, Pothoulakis C. Pathophysiological role of Toll-like receptor 5 engagement by bacterial flagellin in colonic inflammation. Proc Natl Acad Sci USA. 2005;102:13610–5. doi: 10.1073/pnas.0502174102. [DOI] [PMC free article] [PubMed] [Google Scholar]
- 31.Gewirtz AT, Vijay-Kumar M, Brant SR, Duerr RH, Nicolae DL, Cho JH. Dominant-negative TLR5 polymorphism reduces adaptive immune response to flagellin and negatively associates with Crohn’s disease. Am J Physiol Gastrointest Liver Physiol. 2006;290:G1157–G1163. doi: 10.1152/ajpgi.00544.2005. [DOI] [PubMed] [Google Scholar]
- 32.Scott WW, Jr, Fishman EK, Kuhlman JE, Caskey CI, O’Brien JJ, Walia GS, et al. Computed tomography evaluation of the sacroiliac joints in Crohn disease. Radiologic/clinical correlation. Skeletal Radiol. 1990;19:207–10. doi: 10.1007/BF00204098. [DOI] [PubMed] [Google Scholar]
- 33.Kruithof E, Baeten D, De Rycke L, Vandooren B, Foell D, Roth J, et al. Synovial histopathology of psoriatic arthritis, both oligo- and polyarticular, resembles spondyloarthropathy more than it does rheumatoid arthritis. Arthritis Res Ther. 2005;7:R569–80. doi: 10.1186/ar1698. [DOI] [PMC free article] [PubMed] [Google Scholar]
- 34.Baeten D, Demetter P, Cuvelier CA, Kruithof E, Van Damme N, De Vos M, et al. Macrophages expressing the scavenger receptor CD163: a link between immune alterations of the gut and synovial inflammation in spondyloarthropathy. J Pathol. 2002;196:343–50. doi: 10.1002/path.1044. [DOI] [PubMed] [Google Scholar]
- 35.Weaver LK, Pioli PA, Wardwell K, Vogel SN, Guyre PM. Up-regulation of human monocyte CD163 upon activation of cell-surface Toll-like receptors. J Leukoc Biol. 2007;81:663–71. doi: 10.1189/jlb.0706428. [DOI] [PubMed] [Google Scholar]
- 36.Jiang W, Sun R, Wei H, Tian Z. Toll-like receptor 3 ligand attenuates LPS-induced liver injury by down-regulation of toll-like receptor 4 expression on macrophages. Proc Natl Acad Sci USA. 2005;102:17077–82. doi: 10.1073/pnas.0504570102. [DOI] [PMC free article] [PubMed] [Google Scholar]
- 37.Fert I, Glatigny S, Poulain C, Satumtira N, Dorris ML, Taurog JD, et al. Correlation between dendritic cell functional defect and spondylarthritis phenotypes in HLA-B27/Human beta2-microglobulin-transgenic rat lines. Arthritis Rheum. 2008;58:3425–9. doi: 10.1002/art.24023. [DOI] [PubMed] [Google Scholar]