Abstract
PET has become a leading modality in molecular imaging. Demands for further improvements in spatial resolution and sensitivity remain high with growing number of applications. In this paper we present a novel PET system design that integrates a high-resolution depth-of-interaction (DOI) detector into an existing PET system to obtain higher-resolution and higher-sensitivity images in a target region around the face of the high-resolution detector. A unique feature of the proposed PET system is that the high-resolution detector can be adaptively positioned based on the detectability or quantitative accuracy of a feature of interest. This paper focuses on the signal-known-exactly, background-known-exactly (SKE-BKE) detection task. We perform theoretical analysis of lesion detectability using computer observers, and then develop methods that can efficiently calculate the optimal position of the high-resolution detector that maximizes the lesion detectability. We simulated incorporation of a high-resolution DOI detector into the microPET II scanner. Quantitative results verified that the new system has better performance than the microPET II scanner in terms of spatial resolution and lesion detectability, and that the optimal position for lesion detection can be reliably predicted by the proposed method.
Index Terms: Positron emission tomography, adaptive imaging, lesion detection, image reconstruction
I. Introduction
Positron emission tomography (PET) has been recognized as an important research and clinical molecular imaging modality. In past few decades the performance of PET systems has been improved significantly in terms of spatial resolution and sensitivity. For example, some research systems have reported a sub-millimeter spatial resolution in animal studies using arrays of small scintillator elements [1]–[3]. However, the resolution of most modern PET systems is still limited by the physical size of the scintillator elements and the intrinsic spatial resolution of the detectors [4].
One way to improve the spatial resolution is to place detectors with much smaller scintillator elements in close proximity to the object being imaged. This leads to the so-called PET-insert system, which is able to obtain higher spatial resolution and higher sensitivity around the high-resolution detector insert. Successful instances have been presented where high-resolution detectors are either inserted into an existing whole body PET scanner [5], [6] or a small-animal PET device [7]–[9] to improve the system performance in a smaller field of view (FOV). The effect of a high-resolution detector insert on the system resolution has been analyzed by Tai et al [10] in their study of the virtual-pinhole PET scanner.
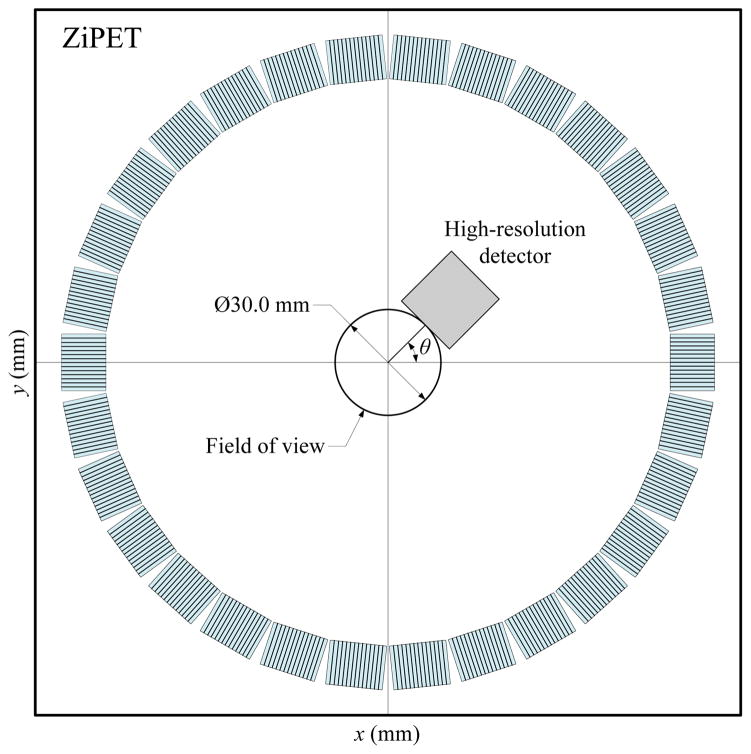
Most PET inserts use a large number of high-resolution detectors to form either a partial or full ring of a fixed radius, so it may not be possible to position animals right up against the high-resolution detectors to take full advantage of the resolution available. In [11] and [12] we studied a “zoom-in” PET (ZiPET) system that integrates a single high-resolution DOI detector into the existing PET scanner to provide higher resolution and sensitivity in a small region around the face of the high-resolution detector (see Fig. 1 for an example of the proposed ZiPET system). The proposed design offers an innovative solution to take advantage of a single available high-resolution detector and to obtain high-resolution images well before a full-ring PET system can be built. Potential applications include the study of human cancers using animal models where tumors are often grown near the skin surface and therefore allow close contact with the high resolution detector. The proposed system then provides high-resolution and high-sensitivity images that can reveal the heterogeneity inside a tumor, which permits better understanding of tumor progression and response to therapies.
Fig. 1.
A transaxial view of a typical ZiPET system. Here the high-resolution detector is added into a microPET II system which has 30 low-resolution detector blocks uniformly spread over a ring of diameter 160 mm. The diameter of field of view is suppose to be the size of 30 mm. The high-resolution detector is positioned 15 mm away from the center at an angle θ with respect to the x-axis.
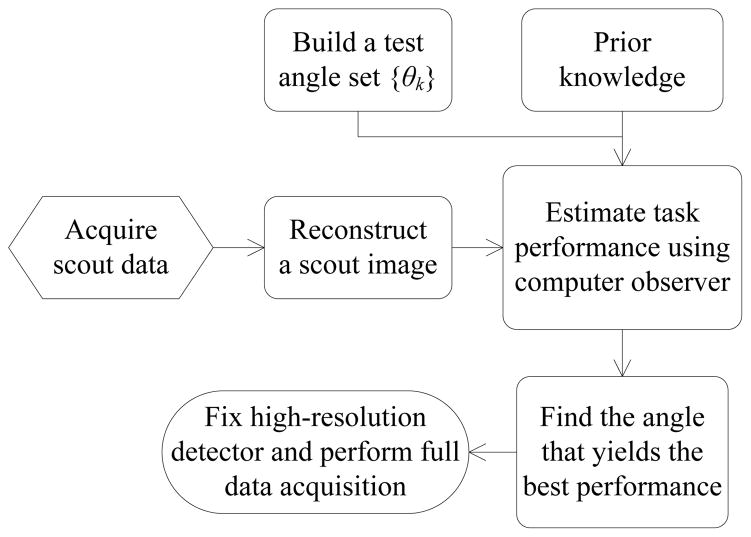
Using a single high-resolution detector also provides greater flexibility because this detector can be adaptively positioned with respect to the subject being imaged following the adaptive imaging concept proposed by Barrett et al [13] and Clarkson et al [14], which has been applied to develop adaptive SPECT systems for imaging small animals [15], [16]. Basically a short-duration scout scan will be performed first. Then a task-specific figure of merit will be evaluated based on the scout data and prior information to find the optimal position of the high-resolution detector that maximizes the task performance. Finally the high-resolution detector will be placed at the optimal position to acquire a complete set of data for image reconstruction and analysis.
Theoretical analysis and simulation studies on resolution and noise properties of the proposed ZiPET system were carried out in our previous works [11], [12]. The main purpose of this paper is to study the ability of adaptive imaging of the proposed system. We investigate the system adaptive capability for the signal-known exactly and background known exactly (SKE-BKE) detection task using computer observers. Based on the theoretical formulae derived in [17] and [18], we develop a practical strategy for adaptive positioning of the high-resolution detector.
We note that other researchers have studied similar hardware configurations, but without the adaptive imaging. One design was studied by Wu et al [19], where a high-resolution detector insert was rotated inside a microPET scanner forming coincidences with the low-resolution detectors. Huh et al [20] presented a PET imaging probe where a high-resolution detector is used in coincidence with an arc of low-resolution detectors to perform limited angle tomography of a region of interest. Compared with these prior works, our system collects not only the coincidence data between the high-resolution detector and the detectors in the microPET scanner (which we refer to as high-resolution data), but also the projection data between microPET detectors (which we refer to as low-resolution data). The combination of the high-resolution and low-resolution data provides high sensitivity and a full angular coverage of any point inside the FOV.
The paper is organized as follows: Section II describes the image reconstruction method for the ZiPET system. We use the statistically based iterative method which allows us to adapt an accurate system model and to model the statistics of measurement data. A theoretical evaluation on lesion detection is followed. In section III, we extend the theoretical analysis to adaptive imaging and present our strategy for adaptive PET imaging for lesion detection using the ZiPET system. Section IV shows computer simulation results, which demonstrate that the proposed system improves spatial resolution and lesion detectability. Conclusion and discussion are presented in section V.
II. Theory
A. System modeling and image reconstruction
The data from the ZiPET system consist of both high-resolution data from the high-resolution detector and low-resolution data from the original PET scanner. These emission data are well modeled as a collection of independent Poisson random variables with the expectation ȳ = [y1, …, yN ]′ ∈ ℝN (where N is the total number of lines of response (LOR), and ‘′’ denotes the vector or matrix transpose) related to the unknown image x ∈ [x1, …, xM ]′ (where M is the number of voxels) by an affine transform
| (1) |
where P ∈ ℝN × M is the system matrix with the (i, j)th element representing the probability of detecting an event from voxel j by detector pair i, and r = [r1, …, rN]′ ∈ ℝN is the mean contribution of background events such as randoms and scatters. The mean background r is often estimated prior to image reconstruction.
For comparison with the original scanner, we decompose the system matrix of the proposed ZiPET system as
| (2) |
where Plow concerns the LORs formed by the original PET detectors, and Phigh models the LORs between the original low-resolution detectors and the high-resolution detector. Similarly, we can also partition the data as
| (3) |
where ȳlow and ȳhigh represent the low-resolution and high-resolution data, respectively.
We use the maximum a posteriori (MAP) reconstruction which estimates the unknown image by
| (4) |
where L(y|x) is the Poisson log-likelihood function, i.e.,
| (5) |
with y = [y1, …, yN ]′ ∈ ℝN being the measured projection data. U(x) is the prior energy function with the form of
| (6) |
where  represents neighborhoods of voxel m, and ωmk is the weighting factor that is chosen to be the reciprocal of the Euclidean distance between voxels m and k. β is the hyperparameter of the prior distribution that controls the strength of the regularization. The MAP solution in (4) has no closed form and is obtained using an iterative algorithm.
B. Theoretical analysis of lesion detection
Lesion detection is a major application of PET imaging and hence is the initial focus of the adaptive ZiPET system. In this paper, we limit the study to the SKE-BKE detection task and evaluate the task performance using linear observers. We also consider that the signal is weak such that the presence of the signal does not affect noise in measurements. One observer we used is the prewhitening observer (PWO), which computes the test statistic by
| (7) |
where H0 is the null hypothesis representing lesion absent, and H1 is the alternative hypothesis representing lesion present. E {·} denotes the expectation operator, and Σ is the covariance matrix of reconstruction x̂. The detectability can be measured by the signal-to-noise-ratio (SNR) of ηPWO(x̂). In previous work [17], it has been shown that for MAP reconstruction, the PWO SNR of the ZiPET system can be approximated by
| (8) |
where f̄l is the true signal to be detected and
| (9) |
is the Fisher information matrix. Here diag {1/ȳi} is the diagonal matrix whose (i, i)th element is given by 1/ȳi. We note that the PWO SNR depends only on the system matrix and is independent of the prior function.
| (10) |
where Flow and Fhigh are essentially the Fisher information matrices of the low-resolution and high-resolution data, respectively. Substituting the above equation into (8), we obtain
| (11) |
Ignoring the attenuation of the high-resolution detector, the SNR of PWO of the original PET scanner can be approximated by
| (12) |
Because Fhigh is nonnegative definite, the above expressions indicate
| (13) |
i.e., the PWO performance of the proposed ZiPET system is always superior to that of the original PET scanner. The SNR gain is approximately equal to , which comes from the contribution of the high-resolution detector. We can show that (13) still holds when the attenuation of the high-resolution detector is considered under the following two assumptions: 1) Any photon that is attenuated by the high-resolution detector is detected by the high-resolution detector, i.e. the total number of detected events is not reduced by the insertion of the high-resolution detector; 2) An event detected by the high-resolution detector carries more information than a similar event detected by a low-resolution detector because the former has higher intrinsic resolution. The improvement in lesion detectability has been demonstrated by the simulation results in [12].
Another model observer that we studied is the channelized Hotelling observer (CHO) [21] [22], whose test statistic is calculated by
| (14) |
where C ∈ ℝℓ×M represents ℓ frequency-selective channels that mimic the human visual system, Σch ∈ ℝℓ×ℓ is the covariance matrix of channel outputs, and n is the internal channel noise with zero mean and covariance Σcn that models the uncertainty in human detection process. Assuming that the lesion is centered at the jth voxel and using the results derived in [18], we can compute the CHO SNR of the ZiPET system by
| (15) |
with
| (16) |
and w = [w1, …, wℓ]′,
| (17) |
Here C̃ ∈ ℂℓ×M contains coefficients of Fourier transform of each channel function. {λm(j) ≥ 0, m = 1, …, M} and {μm(j) ≥ 0, m = 1, …, M} are the local Fourier spectra of F and the Hessian matrix of U(x), respectively. Readers are referred to [23]–[25] for more details on the calculations of {λm(j)} and {μm(j)}. {ξm(j) ∈ ℂ, m = 1, …, M} is the Fourier transform of f̄l.
The derivation of the above theoretical expressions are based on the assumption of local shift-invariant system response, which has been shown a reasonable approximation for the ZiPET system by computer simulations [12]. Equations (8) and (15) allow fast evaluation of lesion detectability and will be used to guide the adaptive positioning of the high-resolution detector based on the specific imaging task.
III. Adaptive PET imaging for lesion detection
Using a single high-resolution detector offers the flexibility to position the high-resolution detector for a specific task. In this section, we describe how to predict the optimal position of the high-resolution detector for a given SKE-BKE detection task.
Fig. 2 summarizes our basic strategy which follows the idea proposed in [13]. First, a short scout scan will be acquired with or without the high-resolution detector. Then a scout image, denoted by x̂scout, will be reconstructed to provide useful information for the SKE-BKE based lesion detection task. There are many ways to adjust the position of high-resolution detector. Here we restrict the high-resolution detector to rotate on a circle with a fixed radius as shown in Fig. 1. We use theoretical expressions shown in the previous section to evaluate the task performance at different angles of the high-resolution detector. For clarity, let us consider CHO SNR as the measure of lesion detectability. We rewrite (15) to show explicitly that the SNR is a function of the rotational angle θ and the hyperparameter β conditioned on the scout image x̂scout and the known lesion location j, i.e.,
Fig. 2.
An illustration of the basic strategy for adaptive imaging using the proposed system.
| (18) |
where
| (19) |
and ŵ = [ŵ1, …, ŵℓ]′,
| (20) |
Here the local spectrum {λm} is now a function of θ, but the prior term {μm(j)} is independent of the detector angle θ. Then the optimal angle is found by
| (21) |
The exact solution to the above problem is hard to obtain, so for practical interests, we find the optimal angle among a set of K discrete angles {θk, k = 1, …, K}. For each fixed angle θk, SNRCHO is a one-dimensional function of the hyperparameter β whose optimal value, denoted by β̂opt, can be found by using a one-dimensional line search method.
In order to calculate SNR using (18), one has to calculate {λm(θ|j, x̂scout)} based on the corresponding Fisher information matrix. Here we rewrite the definition of the Fisher information matrix in (9) as a function of θ
| (22) |
where P(θ) is the system matrix when the high-resolution detector is positioned at angle θ, and ȳ(θ) = [ȳ1(θ), …, ȳN (θ)]′ represents the expectation of the data at this angle. Clearly, both P(θ) and ȳ(θ) are necessary for computing the Fisher information matrix. We now describe our methods to calculate them efficiently.
A. Mean estimation
In practice the mean data ȳ(θ) is usually unavailable, but one can approximate it using the scout data. We could not use the scout data based on the data plug-in techniques proposed in [26] and [24] directly, because the scout data do not contain the high-resolution projections. Instead we propose to approximate ȳ(θ) by forward projecting the scout image
| (23) |
Here αT is a positive scalar which is related to the scanning durations of the scout scan and the final scan. It should be properly chosen so that the total number of photon counts in is approximately equal to that of ȳ(θ) in the final scan. The approximation can be viewed as an asymptotically unbiased estimate of ȳ(θ) as long as the scout image x̂scout is the maximum likelihood (ML) estimate.
B. Rotational symmetry
The approximation in (23) relies on the assumption that all P(θk) matrices are precomputed in advance. This can be impractical when each system matrix P(θk) takes a large amount of storage space and many test angles are required. To solve this problem, we propose the second approximation based on the rotational symmetry. Most PET scanners have a cylindrical geometry. Our high-resolution detector is placed on a circle whose center overlaps with that of the FOV. Therefore rotating the detector is equivalently to rotating the object in the opposite direction. For PET scanners with large block detectors, the ring becomes a polygon and the rotational symmetry is only true for rotational angles equal to 2πn/nb where nb is the total number of detector blocks and n is an integer. To satisfy this condition, we use the following set of angles for the high-resolution detector:
| (24) |
where θ0 is an initial angle.
This rotational symmetry allows us to use the precomputed P(θ0) with a properly rotated scout image to estimate F(θ) at any angle θk. It is apparent that for any angle θk, the scout image needs to be rotated by . Let us denote x̂scout(Δθ) as such rotated scout image. From (23) and (22), we have
| (25) |
| (26) |
We can then compute {λm(θ0 | j(Δθ), x̂scout(Δθ))} using F(θ0 | x̂scout(Δθ)), where j(Δθ) denotes the new voxel index of the lesion center in the rotated scout image. Clearly {λm(θ0 | j(Δθ), x̂scout(Δθ))} is a rotated version of {λm(θ| j, x̂scout))}, so we need to rotate it back by −Δθ to obtain an estimate of {λm(θ| j, x̂scout))}, which can be plugged into equations (18)–(20) to compute the CHO SNR.
For PWO SNR, we do not need to calculate the local spectra, but simply rotate the signal f̄ by the same degree so that the resulting signal denoted by f̄(Δθ)) matches the rotated Fisher information matrix F(θ0|x̂scout(Δθ)). The PWO SNR is then calculated by
| (27) |
C. Summary of the procedure
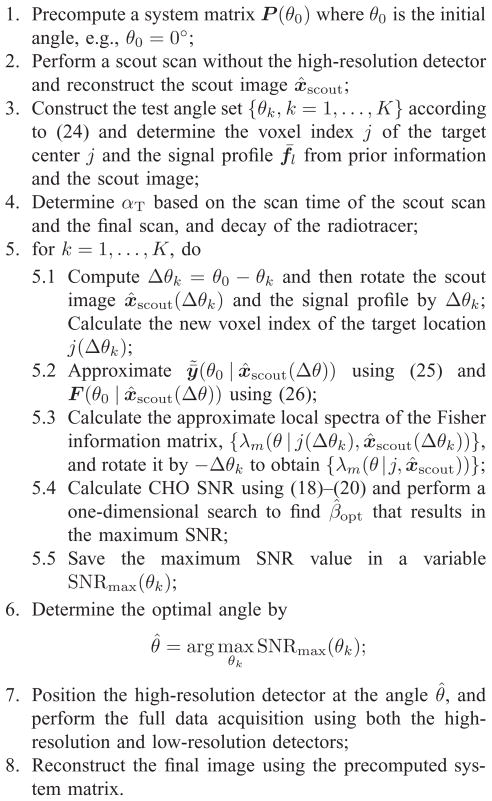
The procedure for adaptively positioning the high-resolution detector for lesion detection is summarized in Fig. 3. Our algorithm requires only one precomputed system matrix. For image rotation, there exist good methods to perform rotation accurately and efficiently (see [27] and [28] for example). Thus it will not add much computational load to the proposed algorithm. Note that for both PWO and CHO, it is not necessary to compute the full Fisher information matrix. The PWO SNR can be done efficiently in sinogram domain and thus only one forward projection is required for each high-resolution detector position. For the CHO, only one column of the Fisher information matrix needs to be computed, which takes one forward projection and one backward projection [23].
Fig. 3.
Summary of the adaptive imaging algorithm for a SKE-BKE detection task using the proposed system.
Once we find the optimal angle θ̂, the high-resolution detector will be positioned at this angle to acquire a full set of data, which will be reconstructed and analyzed for the specific task. When θ̂ ≠ θ0, we will have to compute a new system matrix P(θ0) for image reconstruction. This would be inconvenient if the computation of a system matrix takes a long time. To alleviate this problem, we can take advantage of the rotational symmetry of the low-resolution data. We will circularly shift the low-resolution data by Δθ= θ̂ − θ0 and reconstruct the resulting sinogram using the precomputed system matrix P(θ0). Note that the final reconstruction is rotated by angle Δθ, but it does not affect the detection performance.
IV. Simulation study
A. System setup
We simulated the ZiPET scanner that incorporates a high-resolution detector into the microPET II scanner. The simulated microPET II scanner operates in 2D mode and consists of 30 lutetium oxyorthosilicate (LSO) detector blocks forming a 16-cm diameter ring. Each detector block contains 14×1 individual LSO crystals of size 1.0×1.0×12.5 mm3. For the high-resolution detector, we considered an LSO array with 64×1 LSO crystals of size 0.25×1.0×20 mm3. The axial size of the high-resolution detector matches that of the low-resolution detector in this 2D simulation. Eight DOI bins were used with a DOI resolution of 2.5 mm full-width-at-half-maximum (FWHM). The FOV of the system is restricted to a circular region of diameter 30 mm, which is large enough for small animals such as mice. The high-resolution detector was placed outside this FOV, 15 mm away from the center of the scanner transaxially. The transaxial view of our proposed ZiPET system is shown in Fig. 1.
The system matrix was calculated using a numerical method proposed in [29]. It includes the photon solid angle effect and models the block structure of the PET scanner and also takes into account the photon penetration and gaps between detectors, but no inter-crystal scatters are considered. The attenuation effect of the high resolution detector on the low-resolution data is modeled in the system matrix. We did not include subject attenuation in our simulations because of the relative small FOV, where subject attenuation is negligible. In the situations where subject attenuation is significant, attenuation correction factors can be modeled by a diagonal matrix in the following calculations.
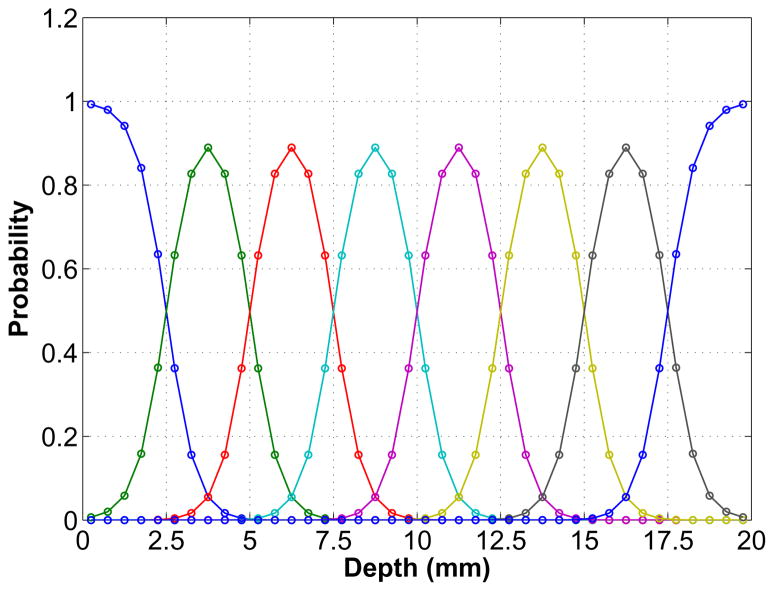
In order to compute a high-resolution system matrix with the desired DOI resolution, we modeled the blurring effect along the DOI direction using a Gaussian function with the FWHM equal to 2.5 mm (see Fig. 4). The Gaussian profiles are similar to the experimental results from the DOI detectors with dual-end readouts [30]. The DOI information is discretized into eight DOI bins. The events that fall outside the two ends of the detector after the DOI blurring are assigned to the nearest valid DOI bin so that there is no loss of event. Thus the profiles for two ends are different. The probability of detecting an event in each DOI bin is calculated by numerically integrating the Gaussian profiles through the whole detector with a sampling interval of 0.5 mm.
Fig. 4.
Simulated DOI resolution profiles for the high-resolution detector. The detector is 20 mm long and has eight DOI bins each with a Gaussian profile except two ends where truncation occurs. These profiles represent the probability of an interaction at a certain depth being credited to each of the eight DOI bins. At each interaction point, the sum of all the profiles equal to one, which means no event loss in the DOI encoding. The simulated DOI resolution is 2.5 mm FWHM.
B. Spatial resolution improvement
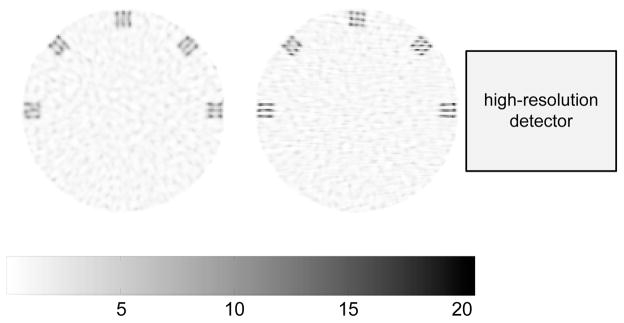
We demonstrate the spatial resolution improvement using a hot-spots phantom. This phantom consists of a warm disc background (diameter of 28.0 mm) and five sets of 3×3 tiny round spots located near the edge of the disc. The diameter of each hot spot is 0.3 mm, and the center-to-center spacing between adjacent spots is 0.8 mm. The activity ratio of the hot spots to the background is 40 : 1. A noisy sinogram with 10% background randoms and scatters was generated with the expected total number of low-resolution events equal to one million. To model the image domain partial volume effect, the sinogram was generated with 0.1×0.1 mm2 pixels, while the reconstruction was performed using 0.2×0.2 mm2 pixels. We used the second-order neighborhood system for the prior energy function. All images were reconstructed using 400 iterations of the MAP-EM algorithm [31] starting from a uniform image. The term r in equation (1) was set to the noise-free background in all reconstructions.
Fig. 5 shows MAP-reconstructed images of the phantom for the proposed system with the high-resolution detector at 0 degree and the microPET II. The hyperparameter was chosen for easy separation of adjacent hot spots. These images are quite similar to those reconstructed with a rectangular DOI profile shown in [12]. Clearly it is difficult to distinguish individual hot spots along radial directions from the microPET II image, because its radial resolution is slightly worse than the edge-to-edge spacing between the hot spots. In comparison, the hot spots are better identified by the proposed system, in particular, at 45° position. The two sets of hot spots at 0° and 180° positions are resolved sharply along the tangential direction, but not along the radial direction. The result indicates that the optimal imaging region is task dependent because the high-resolution detector offers substantial improvement in resolution along the direction parallel to the face of the high-resolution detector, but offers little improvement along the perpendicular direction. Quantitative measurements of the spatial resolution of the ZiPET system can be found in [12].
Fig. 5.
Reconstructed images of the hot-spots phantom for the microPET II (left) and the proposed system (right) with β = 1×10⁻⁴. Both images share the same color scale. The relative size and position of the high-resolution detector is also shown in the right image for reference.
C. Adaptive positioning for lesion detection
To demonstrate how to position the high-resolution detector for the lesion detection task, we simulated three scenarios (Fig. 6(a), (b) and (c)) in which the tasks were to distinguish a solid tumor (left images, H0) from a tumor with small features (right images, H1). The main difference between the first two cases is the orientation of the features. In case #1, the two hot spots are vertically aligned, while they are horizontally aligned in case #2. The third case was to distinguish a single solid tumor from a tumor with a necrotic core. The initial position of the high-resolution detector is at zero degree. The test angle set contains a total of sixteen angles uniformly spaced from 0° to 180°. We precomputed the system matrix P(θ0) with θ0 = 0°. In all cases, we simulated the noisy scout data by generating the low-resolution data with 50K expected events (also with 10% background events to model randoms and scatters) and set the expected number of events in the final scan to one million for the low-resolution data. We assumed that the background event rate does not change during the scan, and is also not affected by the position of the high-resolution detector. A total number of 200 scout datasets were produced for quantitative evaluation. Reference SNR values were computed using noise-free data. All scout images were reconstructed by running 100 ML-EM iterations.
Fig. 6.
Three SKE-BKE detection tasks. In the first two cases, the task is to discriminate a solid tumor (elliptical shape with major radius 1.0 mm, minor radius 0.6 mm, and contrast 2:1) from a tumor consisting of two hot spots (0.6 mm in diameter, 1.2 mm center-to-center spacing, and contrast 3:1). In case #3, the task is to distinguish a single sold tumor of diameter 2.0 mm (contrast 2:1) from a tumor (diameter 2.0 mm, contrast 3:1) with necrotic core (cold spot of diameter 0.6 mm).
The CHO used in this paper has three “difference of Gaussian” (DOG) channels constructed from four Gaussian functions with standard deviations 2.653, 1.592, 0.995, and 0.573, respectively [32]. We considered white channel noise with variance 1×10⁻⁴. While the selected CHO parameters are somewhat arbitrary and are unlikely to be the optimum for predicting human performance, the proposed method does not rely on a particular choice of observer and can be applied to other linear observers.
When dealing with image rotation, we used the Matlab routine imrotate with the ‘bicubic’ interpolation method. Note that the cubic interpolation may introduce negative values in rotated scout image, which are unnatural for emission tomography, so we reset all negative values to zero. When the signal was rotated, we determined its new location by calculating the geometrical centroid and then rounding it to the nearest pixel coordinates. When rotating the local spectra, we first determined its center by identifying its peak, and then checked whether the center of the rotated spectra overlaps with the desired lesion location or not. If they were not matched due to the rounding error, a phase correction would follow to match the spectra to the right lesion position. For any given angle, we use the Matlab routine fmincon to find the optimal hyperparameter β̂opt.
Fig. 7 shows the predicted PWO SNR curves as a function of the high-resolution detector angle. The solid lines represent PWO SNR values which were calculated using theoretical expressions from noiseless projection data of the desired photon count level. They serve as the reference. For each scout image, we plugged it into the proposed formulae to calculate the PWO SNR value. A total of 200 predictions were obtained for each angle and their means are shown by symbols in Fig. 7. The error bars show the standard deviations from the 200 realizations. As we can see, the PWO SNR values predicted from the scout images agree very well with the reference SNR values. These results demonstrate that the proposed method provides reasonably accurate estimates of lesion detectability.
Fig. 7.
Plots of the PWO SNR versus rotational angle for the microPET II and ZiPET. The error bar represents the standard deviation of the predicted SNR calculated from 200 noisy scout images.
In all scenarios, one can easily identify an optimal angle for the ZiPET in each case by locating the peak of the SNR curves. We see that for the first and third task, the optimal position of the high-resolution detector is at about 0°, while for the second task the optimal position is at 48°. In comparison, microPET II does not exhibit position-dependent lesion detectability because of its rotational symmetry. Typically, a well positioned high-resolution detector can yield about 25% improvement over the microPET II scanner.
Fig. 8 shows the predicted CHO SNR curves as a function of the high-resolution detector angle. Similarly, in all three scenarios the ZiPET system exhibits better detectability than the microPET II scanner. Interestingly, the optimal position of the high-resolution detector are nearly the same as those for the PWO: 0° for cases #1 and #3 and 48° for case #2. Again the microPET II scanner does not show position-dependent lesion detectability.
Fig. 8.
Plots of the CHO SNR versus rotational angle for the microPET II and ZiPET. The error bars represent the standard deviations of the predicted SNR values from 200 noisy scout images.
From these results, we see that there are two factors that affect the detectability of the ZiPET system: the distance to the high-resolution detector and the shape of lesion being detected. When an isotropic lesion is under consideration, the detectability is inversely related to the distance between the lesion and the detector. Clearly the closer the lesion is to the detector, the higher is the detectability. A good example is case #3. The shape dependence is due to the directionality of the local spectrum of the Fisher information matrix (see [12]). When the underlying signal is anisotropic, the ZiPET will choose a position where the corresponding local spectrum of the Fisher information matrix is best aligned to the shape of the signal. Comparing the plots in Fig. 7 and Fig. 8, we can see that the performance of the CHO is more affected by the directionality of the signal than that of the PWO, which indicates that the CHO is less efficient in processing certain information than others. Such inefficiency may be compensated partially or wholly by designing a proper regularization function in image reconstruction [33].
D. Effect of the noise level of scout data
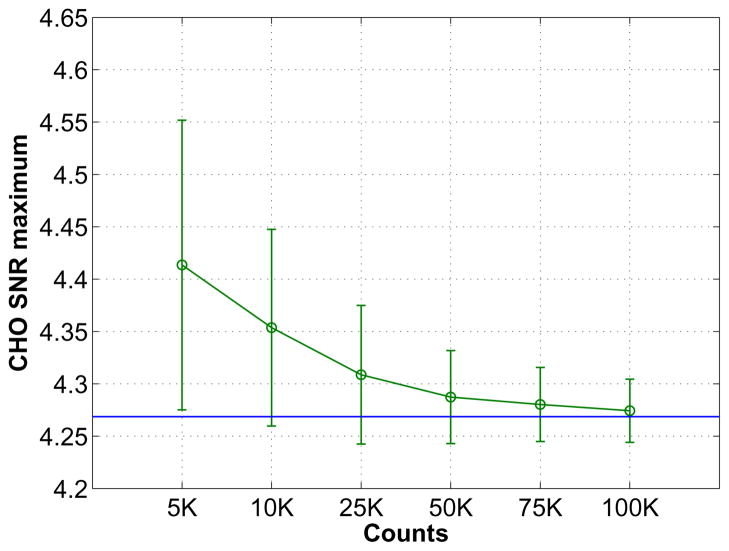
The theoretical SNR predictions can be affected by noise in the scout data. Therefore, we study the variability of the theoretically predicted SNR under various noise levels. We varied the count level of the scout data from 5K to 100K. At each noise level, we calculated the mean and standard deviation of the estimated CHO SNR maximum (over a range of the hyperparameter β values) using 200 independent realizations. Fig. 9 plots the predicted CHO SNR maximum based on noisy scout images versus count level of the scout data for case #1 when the detector is placed at zeros degree. Clearly we see an increasing positive bias as we reduce the count level of the scout data. Even at 25K count level, the bias is only about 1%, which is still acceptable for our purpose. The bias increases to about 8% when count level is reduced to 5K. This is probably due to the inherent bias in ML image reconstruction of low-count Poisson data. The use of MAP which incorporates an image smoothness constraint may be helpful to overcome this problem and will be studied in future work.
Fig. 9.
The mean and standard deviation of predicted CHO SNR maximum values from noisy scout data as a function of the count level of the scout data. The horizontal line shows the reference SNR calculated using the noiseless data.
E. Variability of the estimated β̂opt
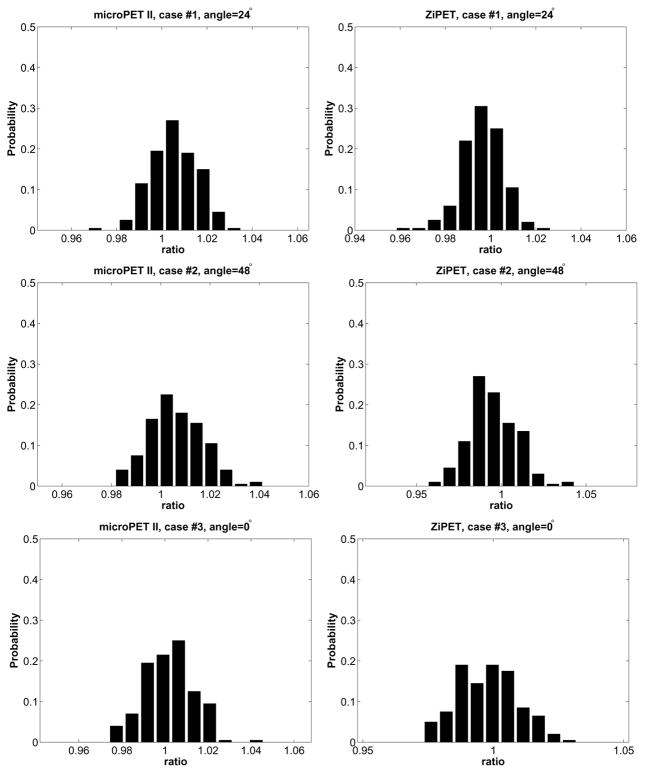
When using noisy scout images, the estimated optimum hyperparameter value β̂opt will be affected. We studied the variability of the estimated β̂opt using 200 noisy scout datasets, each having 50K expected events. Fig. 10 shows the histograms of the ratio between the optimum β̂opt estimated from the noisy scout data and that from the noise-free data under different conditions. We found that the estimated β̂opt values from the noisy scout data are all within 5% of the noise-free reference value. These results show that noise in the scout data has negligible effect on the optimum hyperparameter estimation.
Fig. 10.
Distributes of ratio between the estimate of the optimum β̂opt using noisy data sets and that using noise free data.
F. Validation using Monte Carlo reconstructions
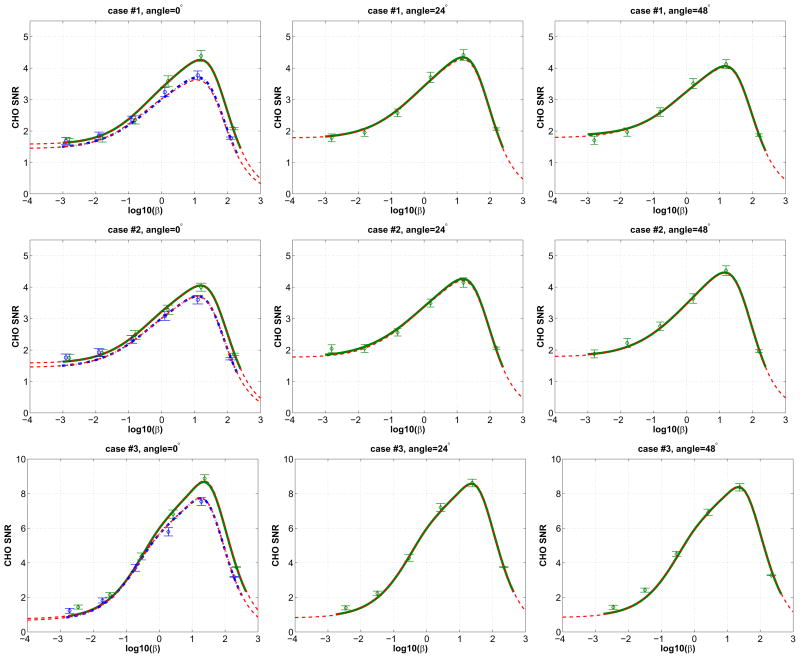
Finally we performed Monte Carlo reconstructions to validate the accuracy of the theoretical predictions of the CHO SNR. We selected three detection angles, 0°, 24° and 48°. Two additional system matrices P(24°) and P(48°) were computed. For each detection task, two hundred noisy sinograms were generated using the precomputed system matrices for both signal-absent and signal-present cases. Each sinogram has one million expected events, and was reconstructed using 400 iterations of the MAP-EM algorithm with different β values. The CHO SNR was then calculated from the Monte Carlo reconstructions. A comparison between the Monte Carlo reconstruction-based CHO SNR results and the theoretical predictions are shown in Fig. 11. The results of microPET II are not shown for 24° and 48° since they are the same as those at 0°. The error bars show the standard deviations of the Monte Carlo reconstruction-based CHO SNR values estimated using a bootstrap method. The results show that the theoretical predictions using the proposed scout data-based strategy agree very well with the Monte Carlo reconstruction-based results for all three test angles and all β values. The Monte Carlo reconstruction based results also show that angle 0° results in the greatest CHO SNR for cases #1 and #3, while angle 48° provides the greatest SNR for case #2, which further confirms the theoretical prediction.
Fig. 11.
Comparisons between the Monte Carlo reconstruction based CHO SNR results and the theoretical predictions. Green solid lines are theoretical predictions of the ZiPET CHO SNR curves from the noise-free data using P(0°) (left column), P(24°) (middle column), and P(48°) (right column), respectively. Blue dash-dotted lines in the left column are theoretical predictions of the microPET II scanner from the noise free data. Dashed lines are the predicted CHO SNR curves using noisy scout images and rotation symmetry with P(0°) for the two systems. Diamond and circle symbols denote the Monte Carlo reconstruction based results of the ZiPET and microPET II, respectively, with error bars representing the standard deviations.
V. Discussion and conclusion
We have proposed a zoom-in PET imaging system which combines one single high-resolution detector with the existing microPET II scanner. The high-resolution detector can be adaptively positioned to provide higher resolution and sensitivity in a targeted region. Computer simulation studies show improvements in spatial resolution and lesion detectability of the proposed system over the original scanner. The high-resolution zoom-in detector can work with any existing PET scanner, including both clinical and preclinical scanners. We note that it is challenging to position a high-resolution detector into an existing PET scanner that has a very small gantry, but a successful example has been shown by Wu et al [19]. In addition, newer detectors are often read out by avalanche photodiode (APD) detectors [30], which requires less space than early generation detectors that use bulky photomultiplier tubes (PMTs).
We have developed an algorithm to predict the optimal position of the high-resolution detector rapidly for the SKE-BKE detection task. The prewhitening observer and channelized Hotelling observer were used to evaluate the detection performance, but the method is applicable to other linear observers as well. The key lies in the estimation of the Fisher information matrix for different system configuration based on a scout image. Two practical strategies, the scout image-based mean data estimation and the image rotation-based Fisher information matrix estimation, have been proposed. The quantitative accuracy of these approximations has been verified in the simulation study. The results showed that the optimal position of the high-resolution detector can be reliably estimated using the proposed method.
An alternative to the rotation-based Fisher information matrix estimation is to precompute the system matrices for all possible angles and use equation (22) directly. The result may be more accurate than our proposed rotational-based method since it does not introduce any interpolation error due to the image rotation. However, if each individual system matrix requires a huge storage space and high computational cost, such brute-force method is not efficient. This can be true for fully 3D PET imaging. In the simulation study, we compared this brute-force approach to the rotational-based method (see Fig. 9). The results show that the accuracy of our rotational-based method is comparable to that of the brute-force method in adaptive lesion detection.
Our studies have shown that the higher detectability can be achieved when the lesion is close to the face of the high-resolution detector. Nevertheless, if the lesion of interest is further into the center of the FOV, our proposed system could still provide higher detectability than the original low-resolution scanner alone, but the improvement may be limited. Moreover, the proposed adaptive imaging can be extended to multiple high-resolution detector inserts, although the system integration and the detector geometry optimization become more complex. We have also restricted the high-resolution detector to rotate on a circle. More complicated detector positioning can be modeled by including detector translation. With more degrees of freedom, exhausted search is no longer feasible and some nonlinear optimization algorithm, such as the Nelder-Mead method, can be used to find the optimal configuration.
One limitation of our simulation is that we did not model scatters and the dead-time effects in the detectors. Inter-crystal scatters inside the high-resolution detector can degrade the detector intrinsic resolution and thus reduce the potential improvement. Such degradation can be either simulated using a Monte Carlo program or measured experimentally. The result can then be incorporated into the system matrix for image reconstruction and system evaluation. In addition, the presence of the high-resolution detector will also introduce scatter events to the low-resolution data and the distribution of these scatter events will be dependent on the position of the high-resolution detector. With a reconstructed scout image and known material properties of the high-resolution detector, the distribution of the scatter events can be estimated using single scatter simulation and then be incorporated in the SNR calculation and image reconstruction. Because the high-resolution detector is in close contact with the object being imaged, it will receive high flux of photons, which may cause a significant amount of dead time. This will reduce the effective efficiency of the high-resolution detector. Using a fast detector coupled with fast electronics is helpful to alleviate such problem.
We also note that SKE-BKE tasks are highly simplified scenarios as compared with real detection tasks. The success of the proposed method depends on the availability of accurate information on the target location and signal profile. Since scout data are often of high noise and cannot be used to identify the target location and signal profile accurately, the ZiPET system is more useful in the situations where the target location has been identified by other imaging modalities, e.g., charactering metabolic activity of a known lesion. If the signal profile is known from prior knowledge, one can directly apply the proposed method. Otherwise, one may still be able to obtain a reasonably good position of the high-resolution detector based on a uniform signal profile, given that the PWO showed similar performance for all three cases in Fig. 7. Our future work will include extension to detection tasks with randomness in both signal and background to relax the requirement for knowing the signal profile exactly. The adaptive imaging strategy can also be extended to quantitation tasks [34].
Acknowledgments
The authors would like to thank Michel Tohme for his help in preparing the manuscript.
This work is supported by the US Department of Energy under grant no. DE-FG02-08ER64677 and National Institutes of Health under grant nos. R01EB005322 and R01EB000194. The content is solely the responsibility of the authors and does not necessarily represent the official views of the Department of Energy and the National Institutes of Health.
This work was supported by DOE under grant no. DE-FG02-08ER64677 and NIH under grants R01EB005322 and R01EB000194.
Contributor Information
Jian Zhou, Email: jnzhou@ucdavis.edu.
Jinyi Qi, Email: qi@ucdavis.edu.
References
- 1.Tai Y, Chatziioannou A, Yang Y, Silverman R, Meadors K, Siegel S, Newport D, Stickel J, Cherry S. MicroPET II: design, development and initial performance of an improved microPET scanner for small-animal imaging. Physics in Medicine and Biology. 2003;48(11):1519–1537. doi: 10.1088/0031-9155/48/11/303. [DOI] [PubMed] [Google Scholar]
- 2.Rouze N, Schmand M, Siegel S, Hutchins G. Design of a small animal PET imaging system with 1 microliter volume resolution. IEEE Transactions on Nuclear Science. 2004 Jun;51(3):757–763. [Google Scholar]
- 3.Miyaoka R, Janes M, Lee K, Park B, Kinahan P, Lewellen T. Development of a single detector ring micro crystal element scanner: QuickPET II. Molecular Imaging. 2005;4(2):117–127. doi: 10.1162/15353500200504154. [DOI] [PubMed] [Google Scholar]
- 4.Stickel J, Cherry S. High-resolution PET detector design: modelling components of intrinsic spatial resolution. Physics in Medicine and Biology. 2005;50(2):179–195. doi: 10.1088/0031-9155/50/2/001. [DOI] [PubMed] [Google Scholar]
- 5.Janecek M, Wu H, Tai Y. A simulation study for the design of a prototype insert for whole-body PET scanners. IEEE Transactions on Nuclear Science. 2006 Jun;53(3):1143–1149. [Google Scholar]
- 6.Wu H, Song T, Pal D, Keesing D, Komarov S, O’Sullivan J, Tai Y. A high resolution PET insert system for clinical PET/CT scanners. IEEE Nuclear Science Symposium, Conference Record; Oct. 2008; pp. 5442–5444. [Google Scholar]
- 7.Clinthorne N, Sangjune P, Rogers W, Chiao P. Multiresolution image reconstruction for a high-resolution small animal PET device. IEEE Nuclear Science Symposium, Conference Record; Oct. 2003; pp. 1997–2001. [Google Scholar]
- 8.Park S, Rogers W, Clinthorne N. Design of a very high-resolution small animal PET scanner using a silicon scatter detector insert. Physics in Medicine and Biology. 2007;52(15):4653–4677. doi: 10.1088/0031-9155/52/15/019. [DOI] [PubMed] [Google Scholar]
- 9.Wu H, Pal D, Song T, O’Sullivan J, Tai Y. Micro insert: A prototype full-ring PET device for improving the image resolution of a small-animal PET scanner. Journal of Nuclear Medicine. 2008;49(10):1668–1676. doi: 10.2967/jnumed.107.050070. [DOI] [PMC free article] [PubMed] [Google Scholar]
- 10.Tai Y, Wu H, Pal D, O’Sullivan J. Virtual-pinhole PET. Journal of Nuclear Medicine. 2008;49(3):471–479. doi: 10.2967/jnumed.107.043034. [DOI] [PMC free article] [PubMed] [Google Scholar]
- 11.Zhou J, Qi J. Information Processing in Medical Imaging. Vol. 5636. Springer; Berlin/Heidelberg: 2009. High-resolution adaptive PET imaging; pp. 26–37. [DOI] [PubMed] [Google Scholar]
- 12.Zhou J, Qi J. Theoretical analysis and simulation study of a high-resolution zoom-in PET system. Physics in Medicine and Biology. 2009;54(17):5193–5208. doi: 10.1088/0031-9155/54/17/008. [DOI] [PubMed] [Google Scholar]
- 13.Barrett HH, Furenlid LR, Freed M, Hesterman JY, Kupinski MA, Clarkson E, Whitaker MK. Adaptive SPECT. IEEE Trans Med Imaging. 2008;27(6):775–88. doi: 10.1109/TMI.2007.913241. [DOI] [PMC free article] [PubMed] [Google Scholar]
- 14.Clarkson E, Kupinski MA, Barrett HH, Furenlid L. A task-based approach to adaptive and multimodality imaging: Computation techniques are proposed for figures-of-merit to establish feasibility and optimize use of multiple imaging systems for disease diagnosis and treatment-monitoring. Proc IEEE. 2008;96(3):500–511. doi: 10.1109/JPROC.2007.913553. [DOI] [PMC free article] [PubMed] [Google Scholar]
- 15.Kupinski MA, Furenlid LR, Wilson DW, Barrett HH. A prototype instrument for single pinhole small animal adaptive SPECT imaging. Med Phys. 2008 May;35:1912–1925. doi: 10.1118/1.2896072. [DOI] [PMC free article] [PubMed] [Google Scholar]
- 16.Freed M, Kupinski MA, Furenlid LR, Barrett HH. A prototype instrument for adaptive SPECT imaging. SPIE Medical Imaging. 2007;6510(1):6510–6530. doi: 10.1117/12.708818. [DOI] [PMC free article] [PubMed] [Google Scholar]
- 17.Qi J, Huesman R. Theoretical study of lesion detectability of MAP reconstruction using computer observers. IEEE Transactions on Medical Imaging. 2001 Aug;20(8):815–822. doi: 10.1109/42.938249. [DOI] [PubMed] [Google Scholar]
- 18.Qi J. Analysis of lesion detectability in Bayesian emission reconstruction with nonstationary object variability. IEEE Transactions on Medical Imaging. 2004 Mar;23(3):321–329. doi: 10.1109/TMI.2004.824239. [DOI] [PubMed] [Google Scholar]
- 19.Wu H, Pal D, O’Sullivan J, Tai Y. A feasibility study of a prototype PET insert device to convert a general-purpose animal PET scanner to higher resolution. Journal of Nuclear Medicine. 2008;49(1):79–87. doi: 10.2967/jnumed.107.044149. [DOI] [PubMed] [Google Scholar]
- 20.Huh S, Rogers W, Clinthorne N. On-line sliding-window list-mode PET image reconstruction for a surgical PET imaging probe. IEEE Nuclear Science Symposium, Conference Record; Oct. 2008; pp. 5479–5484. [Google Scholar]
- 21.Myers K, Barrett H. Addition of a channel mechanism to the ideal-observer model. Journal of the Optical Society of America A. 1987;4(12):2447–2457. doi: 10.1364/josaa.4.002447. [DOI] [PubMed] [Google Scholar]
- 22.Yao J, Barrett H. Predicting human performance by a channelized Hotelling observer model. In: Wilson D, Wilson J, editors. Mathematical Methods in Medical Imaging. Vol. 1768. SPIE; 1992. pp. 161–168. [Google Scholar]
- 23.Stayman J, Fessler J. Regularization for uniform spatial resolution properties in penalized-likelihood image reconstruction. IEEE Transactions on Medical Imaging. 2000 Jun;19(6):601–615. doi: 10.1109/42.870666. [DOI] [PubMed] [Google Scholar]
- 24.Qi J, Leahy R. Resolution and noise properties of MAP reconstruction for fully 3-D PET. IEEE Transactions on Medical Imaging. 2000 May;19(5):493–506. doi: 10.1109/42.870259. [DOI] [PubMed] [Google Scholar]
- 25.Stayman J, Fessler J. Efficient calculation of resolution and covariance for penalized-likelihood reconstruction in fully 3-D SPECT. IEEE Transactions on Medical Imaging. 2004 Dec;23(12):1543–1556. doi: 10.1109/TMI.2004.837790. [DOI] [PubMed] [Google Scholar]
- 26.Fessler J. Mean and variance of implicitly defined biased estimators (such as penalized maximum likelihood): applications to tomography. IEEE Transactions on Image Processing. 1996 Mar;5(3):493–506. doi: 10.1109/83.491322. [DOI] [PubMed] [Google Scholar]
- 27.Unser M, Thévenaz P, Yaroslavsky L. Convolution-based interpolation for fast, high-quality rotation of images. IEEE Transactions on Image Processing. 1995 Oct;4(10):1371–1381. doi: 10.1109/83.465102. [DOI] [PubMed] [Google Scholar]
- 28.Cox R, Tong R. Two- and three-dimensional image rotation using the FFT. Image Processing, IEEE Transactions on. 1999 Sep;8(9):1297–1299. doi: 10.1109/83.784442. [DOI] [PubMed] [Google Scholar]
- 29.Hu J, Qi J, Huber JS, Moses WW, Huesman RH. MAP image reconstruction for arbitrary geometry PET systems with application to a prostate-specific scanner. International Meeting on Fully Three-Dimensional Image Reconstruction in Radiology and Nuclear Medicine; Salt Lake City, UT. 2005. pp. 416–420. [Google Scholar]
- 30.Yang Y, Wu Y, Qi J, St James S, Du H, Dokhale PA, Shah KS, Farrell R, Cherry SR. A prototype PET scanner with DOI-encoding detectors. J Nucl Med. 2008;49(7):1132–40. doi: 10.2967/jnumed.107.049791. [DOI] [PMC free article] [PubMed] [Google Scholar]
- 31.De Pierro A. A modified expectation maximization algorithm for penalized likelihood estimation in emission tomography. IEEE Transations on Medical Imaging. 1995 Mar;14(1):132–137. doi: 10.1109/42.370409. [DOI] [PubMed] [Google Scholar]
- 32.Gifford HC, King MA, de Vries DJ, Soares EJ. Channelized hotelling and human observer correlation for lesion detection in hepatic spect imaging. J Nucl Med. 41(3):514–521. [PubMed] [Google Scholar]
- 33.Qi J, Huesman RH. Penalized maximum-likelihood image reconstruction for lesion detection. Physics in Medicine and Biology. 2006;51(16):4017–4029. doi: 10.1088/0031-9155/51/16/009. [DOI] [PubMed] [Google Scholar]
- 34.Qi J, Huesman RH. Theoretical study of penalized-likelihood image reconstruction for region of interest quantification. IEEE Trans Med Imaging. 2006;25(5):640–8. doi: 10.1109/TMI.2006.873223. [DOI] [PubMed] [Google Scholar]


