

Abstract
Diet-induced obesity (DIO) results in region-specific cellular leptin resistance in the arcuate nucleus (ARC) of the hypothalamus in one strain of mice and in several medial basal hypothalamic regions in another. We hypothesized that the ventral tegmental area (VTA) is also likely susceptible to diet-induced and leptin-induced leptin resistance in parallel to that in hypothalamic areas. We examined two forms of leptin resistance in F344xBN rats, that induced by 6-months of high fat (HF) feeding and that induced by 15-months of central leptin overexpression by use of recombinant adeno-associated viral (rAAV)-mediated gene delivery of rat leptin. Cellular leptin resistance was assessed by leptin-stimulated phosphorylation of signal transducers and activators of transcription 3 (STAT3) in medial basal hypothalamic areas and the VTA. The regional pattern and degree of leptin resistance with HF was distinctly different than that with leptin overexpression. Chronic HF feeding induced a cellular leptin resistance that was identified in the ARC and VTA, but absent in the lateral hypothalamus (LH), ventromedial hypothalamus (VMH), and dorsomedial hypothalamus (DMH). In contrast, chronic central leptin overexpression induced cellular leptin resistance in all areas examined. The identification of leptin resistance in the VTA, in addition to the leptin resistance in the hypothalamus, provides one potential mechanism, underlying the increased susceptibility of leptin resistant rats to HF-induced obesity.
Keywords: leptin resistance, gene therapy, high-fat feeding, voluntary wheel running
1. Introduction
The adipocyte-derived hormone, leptin, through its action in the hypothalamus and other brain sites, is a potent regulator of appetite and energy expenditure (Ahima and Flier, 2000). Therapeutic interest in this hormone has waned due to the reduced efficacy and sensitivity of leptin in humans or animals with common obesity (Proietto and Thorburn, 2003; Scarpace and Zhang, 2009). Serum leptin levels increase proportionally with adiposity, and leptin levels are high in rodent and human models of diet-induced obesity (DIO), yet, the increased leptin fails to curb the progression of obesity (Halaas et al., 1997; Widdowson et al., 1997; Levin and Dunn-Meynell, 2002). This apparent leptin ineffectiveness is identified as leptin resistance.
Although the exact mechanism underlying leptin resistance is not fully understood, leptin resistance in DIO rodents is associated with diminished leptin receptor signaling to centrally administered leptin (El-Haschimi et al., 2000), and this form of leptin resistance is often referred to as cellular leptin resistance (Morrison et al., 2005; Myers et al., 2008). One of the major leptin receptor signaling pathways involves activation of Janus kinase 2 (JAK2) and the subsequent phosphorylation of signal transducers and activators of transcription (STAT), in particular STAT3 (Ahima and Flier, 2000). Receptors occupied by leptin undergo phosphorylation by JAK2, promoting binding of STAT proteins that are then subject to tyrosine phosphorylation by JAK2. Phosphorylated STAT3 dimerizes and can serve as a transcription activator. Thus, the degree of leptin-mediated STAT3 phosphorylation serves as one marker of cellular leptin responsiveness.
Although leptin receptors within the arcuate nucleus (ARC) of the hypothalamus have received the most attention, leptin receptors have been found in other areas in the hypothalamus including the lateral hypothalamus (LH), ventromedial hypothalamus (VMH), and dorsomedial hypothalamus (DMH) (Ahima and Flier, 2000), as well in regions outside the hypothalamus, most notably the ventral tegmental area (VTA) (Hommel et al., 2006). Identification of the specific site or sites of cellular leptin resistance within the brain has been largely ignored. Munzberg et. al. first reported that leptin resistance, as identified by diminished leptin-mediated STAT3 phosphorylation, was limited to the ARC in high-fat (HF) fed mice (Munzberg et al., 2004). A subsequent study, in a different strain of HF-fed mice, found evidence for leptin resistance in several regions in the medial basal hypothalamus including the ARC, VMH, DMH, and ventral premammillary area (Metlakunta et al., 2008). The only study in rats examined pregnancy-related leptin resistance and reported impaired leptin-induced STAT3 phosphorylation in two hypothalamic regions, the ARC and VMH with no evidence of diminished signaling in DMH or LH (Ladyman and Grattan, 2004).
To date, there have been no investigations of the occurrence of leptin resistance outside the hypothalamus. One region recently identified to be important in the leptin-mediated regulation of ingestive behavior is the VTA of the midbrain reward circuitry (Fulton et al., 2000; Hommel et al., 2006). The effects of leptin on energy intake in the VTA are mediated by STAT3 phosphorylation (Morton et al., 2009), and leptin receptor knockdown in the VTA increases the preference for sucrose consumption over water (Hommel et al., 2006). We recently demonstrated that voluntary wheel running in rodents curtails high-fat (HF)-related hyperphagia and eliminates the preference for a palatable HF diet, and that this is associated with enhanced leptin-mediated STAT3 signaling specifically in the VTA (Scarpace et al., 2010). These data suggest that leptin-mediated STAT3 signaling in the VTA plays a role in HF feeding behavior, and because HF feeding leads to leptin resistance, we hypothesized that the VTA is likely susceptible to diet-induced leptin resistance in parallel to that in hypothalamic areas.
To this end, we examined leptin-mediated STAT3 phosphorylation under two conditions known to induce leptin resistance, chronic HF feeding and chronic overexpression of leptin in the brain. For diet-induced leptin resistance, we fed rats a HF diet for 6 months, and for leptin-induced leptin resistance, we overexpressed leptin in the brain for 15 months via delivery of a recombinant adeno-associated viral (rAAV) vector encoding rat leptin. Subsequently, we assessed signaling by central leptin administration and examined STAT3 phosphorylation in multiple brain regions, including the ARC, VTA, VMH, DMH, and LH.
2. Materials and methods
2.1. Experimental animals
Three-month-old male F344 x Brown Norway (F344xBN) rats were obtained from Harlan Sprague-Dawley (Indianapolis, IN). Upon arrival, rats were examined and remained in quarantine for one week. Animals were cared for in accordance with the principles of the Guide to the Care and Use of Experimental Animals and protocols were approved by the University of Florida Institutional Animal Care and Use Committee. Rats were housed individually with a 12:12 h light-dark cycle (07:00 to 19:00 hr). During the experimental period, rats were fed either a standard rodent chow (17%kcal from fat, no sucrose, 3.3kcal/g, diet 2018, Harlan Teklad; Madison, WI) or a HF diet (60% kcal from fat, 7% kcal from sucrose, 5.24 kcal/g, D12492, Research Diets, New Brunswick, NJ).
2.2. Experimental design
This study consists of two experiments. In the first experiment, rats were administered either recombinant adeno-associated virus (rAAV)-leptin or control vector by i.c.v. injection. Rats (N=16/group) were allowed free access to food and water, ad libitum, and food consumption and body weight were recorded daily to weekly for 15 months. During two 4-day periods, (starting at day 75 and day 371), rats were evaluated for extent of voluntary wheel running (WR). Prior to death, at day 452, those administered control and rAAV-leptin were further divided into two groups (N=8), and either artificial cerebral spinal fluid (ACSF) or leptin (1ug) were administered by i.c.v. injection to determine leptin signaling in various brain regions.
In the second experiment, rats (N= 12/group) were chow or HF fed for 190 days. At day 190, whole body adiposity was assessed by time domain nuclear magnetic resonance (TD-NMR) using a Minispec lean fat analyzer (Bruker Optics, Inc., The Woodlands, TX). Validation of TDNMR methodology has been provided (Tinsley et al., 2004). Prior to death, the chow and HF-fed group were further divided into two groups (N=6), and either ACSF or leptin were administered by i.c.v. injection to determine leptin signaling in various brain regions.
2.3. rAAV-vector administration
A single dose (5 ×10² viral genomes/ml) of either control vector encoding green fluorescent protein (GFP, 3 μl) or rAAV-leptin (3 μl), was delivered by i.c.v. injection into the third cerebral ventricle as previously described (Scarpace et al., 2002b). The coordinates for injection are 1.3mm anterior to Bregma, 9.4mm ventral from the skull surface, at an angle of 20 degrees anterior to posterior. Leptin transgene expression was determined by RT-PCR using sense (TGACACCAAAACCCTCATCA ) and antisence primers (TGAGCTATCTGCAGCACGTT) as described previously (Scarpace et al., 2002b).
2.4. Wheel running
Rats were housed in cages equipped with Nalgene Activity Wheels (1.081 meters circumference, Fisher Scientific, Pittsburgh, PA) that allowed free access to the wheel. Each wheel was equipped with a magnetic switch and counter. The number of revolutions were recorded daily for a four-day period. Average daily WR was calculated from the last 3 days of WR.
2.5 Dietary selection
Rats accustomed to standard chow, were provided simultaneous access to two novel diets, a 60% HF diet (Research Diets D12492, 60% kcal from fat, 6.7% kcal from sugar, 13.3% kcal from carbohydrates other than sugar, 20% kcal from protein, 5.24 kcal/g) and a 32% HF diet (Research Diets D12266B, 32% kcal from fat, 25.2% kcal from sugar, 26.2% kcal from carbohydrates other than sugar, 16.8% kcal from protein, 4.41 kcal/g). Food consumption of both diets were determined separately by weight of food consumed over a 4 day period. The position of the food trays containing the chow and HF food was alternated daily. Spillage of food was accounted for in calculating food consumption.
2.6. Leptin administration
A single dose of leptin (1 μg) was injected into the third cerebral ventricle as previously described (Scarpace et al., 2007). The coordinates for injection are 1.3mm anterior to Bregma, 9.4mm ventral from the skull surface, at an angle of 20 degrees anterior to posterior. Rats were killed one hour later.
2.7. Tissue harvesting
Rats were killed by thoracotomy under 150-mg/kg pentobarbital anesthetic. Subsequently, 40 ml of cold saline were perfused through the circulatory system. The perirenal and retroperitoneal white adipose tissues (PWAT and RTWAT, respectively) were each excised and their individual weights recorded. Additionally, 2 mm coronal sections containing the regions of the VTA and ARC were sliced using a micrometer controlled tissue slicer (Stoelting Co, Wood Dale ,Il.) and a punch of the respective regions were taken as subsequently described. Aligning a straight edge razor blade with the optic tract (−1.5 mm posterior bregma), a 2 mm caudal coronal section was cut. Thereafter, a 1 mm circumference brain punch (Stoelting, Wood Dale, IL) was used to excise regions centered around the arcuate nucleus, the ventromedial hypothalamic nucleus, the dorsomedial hypothalamic nucleus, and the lateral hypothalamic nucleus. Similarly, aligning a straight edge razor blade with the caudal end of the hypothalamus (−5 mm posterior to bregma) a coronal section was cut 2 mm posterior. Thereafter, a 1 mm brain punch was used to biopsy regions of the VTA. All punches were taken bilaterally.
2.8. Western analysis and Radioimmunoassay
Protein homogenate (20μg) was separated on a SDS-PAGE gel and electro-transferred to nitrocellulose membranes (Scarpace et al., 2001). Immunoreactivity was assessed with antibodies specific to phospho-tyrosine 705 of STAT3, and reprobed with antibodies specific to STAT3 regardless of phosphorylation state (Cell Signaling, Danvers, MA). The ratio of phosphorylate STAT3 to total STAT3 is reported. Immunoreactivity to total STAT3 was compared with that for beta-tubulin (Abcam, Cambridge, MA). Immunoreactivity to tyrosine phosphotase 1B (PTP1B, Calbiochem, San Diego, CA) was determined in the experiment examining leptin overexpression.
Radioimmunoassay was used to determine serum leptin (Millipore, Billerica, MA).
2.9. Statistical analysis
Data were analyzed by two-way ANOVA with repeated measures when appropriate. A post-hoc test (Bonferroni) was applied to determine individual differences between means. A p-value of less that 0.05 was considered significant.
3. Results
3.1. Leptin overexpression
Vectors were delivered into a region of the third ventricle that passes through the hypothalamus. Such delivery was previously demonstrated to result in gene expression in cells located along the wall of the ventricle and in the bed nucleus of the anterior commissure, ventrally in the preoptic area and in the suprachiasmatic nucleus as evidence by fluorescence of GFP. Caudally, GFP-positive cells were observed in the anterior hypothalamus, paraventricular nucleus, dorsomedial hypothalamus area, and suprachiasmatic nucleus (Dhillon et al., 2001). The gene construct for leptin includes a secretory sequence, thus this compound is secreted into the surrounding tissue and into the third ventricle, thus likely reaching target sites throughout the brain. For example, rAAV-leptin gene delivery by this method elevated leptin levels in the cerebral spinal fluid by nearly two-fold (Scarpace et al., 2002b). Leptin transgene expression was verified by RT-PCR in hypothalamic tissue surrounding the site of injection. By this method, leptin RNA was identified at day 452 in selected rAAV-leptin treated rats but not GFP injected rats (Fig. 1).
Figure 1.
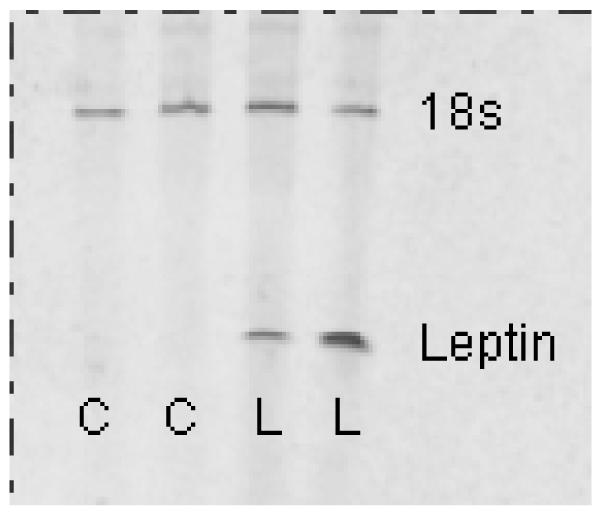
Leptin transgene expression was verified by RT-PCR in hypothalamic tissue surrounding the site of injection. Leptin RNA was identified at day 452 in selected rAAV-leptin treated rats (L), but not GFP injected rats (C). Upper band represents 18S rRNA as an internal standard.
3.2. Body weight and food consumption
In rats administered the leptin containing vector, body weight began to diverge from the rAAV-controls in the first week and were significantly different by day 11 (Fig. 2). The nadir of body weight was reached at day 30 (433 ± 11g vs. 363 ± 11g, p<0.001), after which there was slow regain of the body weight (Fig. 2).
Figure 2.

Body weight in rats following administration of control vector (open circle) or rAAV-leptin (open squares). The rAAV-leptin or control vectors were administered at day 0 in rats maintained on a chow diet. Body weight was significantly different between groups beginning at day 11 through day 280 (P<0.05 by t-test). WR was evaluated starting at day 75 and 371. Values represent the mean ± SE of 16 rats per group.
Inset: Food consumption over the first 55 days following administration of the vectors. Food intake was significantly different between groups commencing at day 4 through day 37 (P<0.05 by t-test). After this period food consumption was not difference between the two groups for the remainder of the study
There was an initial decrease in food consumption as a result of i.c.v. injection of the virus. The control rats quickly recovered from this effect and were eating normally by day 5. The leptin treated rats displayed a decrease in food intake that became significant commencing at day 4 (Fig 2, inset) and continuing to day 34 after which there was no difference in food intake to day 452. Cumulative caloric intake over the 30-day period commencing at day 4 demonstrated an averaged daily consumption that was 19% less in leptin treated compared with control rats (21.3 ± 0.5g vs 17.2 ± 0.6g, p<0.001).
3.3. Wheel running activity
The attenuation of the anorexic response to leptin along with the gradual regain in body weight is suggestive of the development of leptin resistance. We previously established that chronic leptin overexpression induces a leptin resistance as evidenced by the absence of an anorexic or weight reduction response to exogenous central administration of leptin (Scarpace et al., 2002a). This leptin-induced leptin resistance occurs in two phases, first an attenuation of the anorexic response and subsequently an extinction of the increased-energy expenditure response (Scarpace et al., 2002a). Leptin also increases wheel running (WR) activity, and we consider this assessment as another indicator of leptin responsiveness (Matheny et al., 2009). Voluntary WR activity was assessed over two four-day periods during which the animals had free access to running wheels. WR activity was first examined at day 75, at a time when the anorexic response had dissipated but when the energy expenditure response should still be intact. At this point, WR activity was nearly 40% greater in the leptin treated compared with the control rats (Fig. 3). WR activity was reassessed at day 371, and as expected there was a decrease in WR activity among the control rats, likely due to the increasing age. However, there were no differences with leptin treatment (Fig. 3), consistent with established leptin resistance in these animals with leptin overexpression.
Figure 3.

Wheel running activity at day 75 and 371 after control (open bars) or leptin (solid bars) vector delivery. Wheel running was assessed for a 4-day period and average running activity during last 3 days is represented. Values represent the mean ± SE of 15-16 rats per group. P=0.007 for difference with leptin and P=0.001 for difference with days by two-way ANOVA. *P< 0.001 for difference with leptin treatment at day 75 by Bonferroni post-hoc analysis. **P<0.03 for difference between control day 75 and control day 371 by Bonferroni post-hoc analysis.
3.4 Dietary selection
The preference between two palatable HF diets, a 60% fat/ 7% sucrose and a 32% fat/ 25% sucrose was examined at day 392 in a two-diet choice paradigm in which both HF diets were provided ad libitum for 3 days. Initially, the control vector and rAAV-leptin treated rats displayed a strong preference for the 60% fat/7% sucrose diet. However, by the third day, the preference for this diet significantly diminished in the control but not the rAAV-leptin treated group (Fig 4).
Figure 4.

Daily food consumption in grams just prior to (chow consumption, squares) and during dietary selection between 60% HF/7% sucrose (solid line) and 32% HF/25% sucrose (dashed line) in control vector (circles) and rAAV-Leptin (triangles) treated rats starting at day 392 after vector administration.
3.5. Regional leptin signaling
Leptin signaling following acute injection of 1μg of leptin into the third ventricle was examined at day 452 in the rats with leptin overexpression and corresponding controls. This dose of leptin corresponded to a supra-maximal dose of leptin based on a previously determined full dose-response curve (Scarpace et al., 2001). Total STAT3 levels were unchanged between control and rAAV-leptin treatment (Fig 5) and not different from beta-tubulin (data not shown). STAT3 phosphorylation was evaluated in five different brain regions one hour later. As expected, in control animals, an increase in phosphorylated STAT3 (P-STAT3) was observed in each of the regions with leptin administration as compared with ACSF administration (Fig 5). There was a 4-fold increase in ARC and 6-8 fold increases in the other hypothalamic regions including the LH, VMH, and DMH. Similarly, the P-STAT3 was elevated by nearly 7-fold in the VTA (Fig 5). In comparison to the magnitude of the fold increases in the control animals, in those with chronic leptin overexpression, the responses were diminished. In all areas examined, the absolute level of STAT3 phosphorylation was considerably less than the corresponding leptin stimulated level in control rats, and the fold increases over ACSF administration were on the order of only two-fold, except in the VMH which demonstrated no stimulation (Fig 5).
Figure 5.

STAT3 phosphorylation following a single icv injection of1 μg of leptin (sold bars) or ACSF (open bars) in rats administered control vector (rAAV-GFP) or rAAV-leptin 451 days earlier. STAT3 phosphorylation was assessed 1 hour later in the indicated brain regions. Immunoblots are provided below each figure. Blot 1 includes samples from control (GFP-treated) rats administered ACSF or leptin along with rAAV-leptin treated rats administered leptin. Blot 2 repeats the control rats administered ACSF and rAAV-leptin treated rats administered ACSF or leptin. Values represent the ratio of P-STAT3 to total STAT3 and are the mean ± SE of 7-8 rats per group. The level of the ACSF injected control for each individual tissue is arbitrarily set to 100 with SE adjusted proportionally with remaining groups normalized to the level in ACSF injected control. P< 00001 for difference with leptin injection (all brain regions); P<0.05 for difference with rAAV-leptin (all brain regions); P<0.0005 for interaction (all brain regions) by two-way ANOVA; Post-hoc analysis: *P <0.001 (P=0.007 for ARC) for difference between leptin and ACSF injection in the rAAV-GFP treated rats. ** P< 0.005 (LH, VMH, DMH) or P<0.05 (ARC, VTA) for difference between leptin and ACSF injection in the rAAV-Leptin treated rats. τ P<0.001 (P<0.007 for ARC) for difference between maximal leptin signaling in rAAV-Leptin and rAAV-GFP.
3.6. Adiposity and serum leptin levels
Adiposity levels were determined by the weights of two adiposity tissues, PWAT, RTWAT at death. Both measures indicated adiposity levels were not different between control rats and those with chronic leptin overexpression (Table 1). Serum leptin levels, another marker of adiposity, also indicated no difference between groups (Table 1).
Table 1.
Adiposity and serum leptin levels with chronic leptin overexpression
| rAAV-Control | rAAV-Leptin | |
|---|---|---|
| PWAT, g | 2.52 ± 0.09 | 2.75 ± 0.12 |
| RT WAT, g | 10.74 ± 0.40 | 11.56 ± 0.49 |
| Serum Leptin, ng/ml | 9.82 ± 0.63 | 8.88 ± 0.50 |
Data represent the mean ± SE of 15-16 rats per group.
Adiposity is represented by tissue weight of PWAT and RTWAT at death.
3.7. High-fat feeding
In a second experiment, rats were chow or HF fed (60% of kcal from fat) for a 190 day period. Introduction of the HF diet resulted in an initial hyperphagia followed by partial normalization to a level of caloric intake that was approximately 10% greater than that in chow fed rats (Fig 6 A). Cumulative food consumption over the entire experimental period was nearly 12% greater in the HF fed group (Fig. 6 B). Body weight in the HF-fed rats steadily diverged from the control rats with a significant difference commencing at day 32 and continuing to the end of the experiment (Fig 6 C). Adiposity levels were determined by time-domain NMR on conscious rats prior to death and weights of two adiposity tissues, PWAT, RTWAT at death. As expected, HF feeding rendered the animals obese with a nearly 50% increase in whole body adiposity (Table 2). This was accompanied by an increase in percent adiposity as well as a decrease in percent lean body mass. Tissue adiposity and serum leptin at death paralleled the increase in whole body adiposity (Table 2).
Figure 6.

A: Daily food consumption (kcal/day) over the first 80 days following introduction of the HF diet (open circles) compared with rats maintained on the chow diet (closed circles). The same pattern continued for the remainder of the experiment. Food intake was significantly different between groups commencing at day 1 through the end of the experiment (P<0.05 by t-test).
B: Cumulative food consumption (kcal) from day 11 through day 190, representing the period after the acute hyperphagic phase. *P <0.007 for difference from chow-fed by t-test.
C: Body weight in rats following introduction of the HF diet (open circles) compared with rats maintained on the chow diet (closed circles). Body weight was significantly different between groups beginning at day 32 through the end of the experiment (P<0.05 by t-test).
Values represent the mean ± SE of 12 rats per group.
Table 2.
Body weight, adiposity, lean mass and serum leptin levels with chronic HF feeding
| Chow | HF-fed | |
|---|---|---|
| Body weight, g | 411± 6 | 482 ± 14a |
| Total Adiposity, g | 107 ± 2 | 150 ± 5a |
| Adiposity, % | 26.1 ± 0.2 | 31.1 ± 0.3a |
| Lean Mass, % | 59.3 ± 0.3 | 55.9 ± 0.4a |
| PWAT, g | 1.37 ± 0.10 | 3.14 ± 0.16a |
| RT WAT, g | 4.89 ± 0.27 | 14.13 ± 0.83a |
| Serum Leptin, ng/ml | 4.71 ± 0.37 | 22.99 ± 2.12a |
Data represent the mean ± SE of 12 rats per group except for serum leptin, which represent 6 rats per group.
Total Adiposity was determined by TD-NMR prior to death.
P<0.001 for difference from chow-fed rats by t-test.
3.8. Regional leptin signaling
We and others have previously demonstrated that this degree of HF feeding results in physiological leptin resistance (Levin and Dunn-Meynell, 2002; Wilsey and Scarpace, 2004). The extent of leptin signaling in selected brain regions was examined following an acute leptin injection into the third ventricle in the chow and HF fed rats. Total STAT3 levels were unchanged with HF feeding (Fig 7) and not different from beta-tubulin (data not shown). In each region examined, leptin administration resulted in elevated phosphorylated STAT3, ranging from a 6 to 13 fold increase in chow-fed rats and from 3 to 8 fold in the HF fed rats (Fig. 7). There was significantly decreased signaling with HF feeding in only the ARC and VTA regions with unchanged signaling in LH and DMH (Fig. 7). In VMH, leptin-mediated STAT3 signaling was marginally diminished with HF feeding (P=0.051). In addition, protein levels of tyrosine phosphotase 1B (PTP1B) were assessed in with leptin overexpression, but there were no differences across groups in all brain regions examined (data not shown).
Figure 7.

STAT3 phosphorylation following a single icv injection of1 ug of leptin (sold bars) or ACSF (open bars) after 190 days of chow or HF feeding. STAT3 phosphorylation was assessed 1 hour later in the indicated brain regions. Values represent the ratio of P-STAT3 to total STAT3 and are the mean ± SE of 5-6 rats per group. Numbers below immunoblot images refer to treatment groups where 1 is the chow-fed, ACSF injected, 2 is chow-fed, leptin injected, 3 is HF-fed, ACSF injected, and 4 is HF-fed, leptin injected. The level of the ACSF injected control for each individual tissue is arbitrarily set to 100 with SE adjusted proportionally with remaining groups normalized to the level in ACSF injected control. P<0.0001 for difference with leptin injection (all brain regions); P< 0.05 for difference with HF (ARC, VTA, VMH); P<0.02 for interaction (ARC, VTA, VMH) by two-way ANOVA; Post-hoc analysis: *P <0.001 for difference between leptin and ACSF injection in the chow-fed rats. ** P< 0.001 for difference between leptin and ACSF injection in the HF-fed rats. τ P<0.02 for difference between maximal leptin signaling in chow-fed compared with HF-fed rats.
4. Discussion
Leptin resistance is the hallmark of DIO. The underlying mechanisms are not clearly delineated, and several defects likely contribute to leptin resistance (Morrison et al., 2005; Myers et al., 2008). One consequence of HF feeding is a resistance to central administration of leptin, and this cellular leptin resistance has been identified to be associated with impaired leptin signaling events within in specific subpopulations of hypothalamic neurons in mice (Munzberg et al., 2004; Metlakunta et al., 2008). One study in C57BL/6J mice indicated that in as early as 4 days of HF feeding, leptin-mediated STAT3 phosphorylation is impaired in the ARC (Munzberg et al., 2004), yet with no evidence of leptin resistance in other hypothalamic brain regions with up to 16 weeks of HF feeding. In contrast, another study in FVB/N mice reported no decline in leptin-mediated STAT3 signaling after 4 weeks of HF feeding, but leptin resistance in four hypothalamic regions after 19 weeks (Metlakunta et al., 2008). Neither study examined regions outside the hypothalamus. Recently, leptin function in energy homeostasis has been linked to regions outside the hypothalamus, in particular, the mesolimbic dopamine system in the ventral tegmental area (VTA) of the midbrain reward circuitry (Fulton et al., 2000; Hommel et al., 2006). Leptin function in this brain region is associated with sweet preference (Hommel et al., 2006) and has a potential role in the dietary preference for HF food (Scarpace et al., 2010). These observations predict that this region may be subject to dietary-induced leptin resistance. The present study revisits dietary-induced selective leptin resistance by examination of leptin-mediated STAT3 signaling both in specific hypothalamic regions as well as the VTA. Leptin signaling was assessed following a single icv injection of a pharmacological dose of leptin. Previous studies detailing the dose-response leptin-stimulation of hypothalamic STAT3 phosphorylation indicated that the Kact (concentration that results in half-maximal activation) for leptin is 41ng with a maximum stimulation achieved at 100 ng following i.c.v. injection (Scarpace et al., 2001). The present study used a dose 10 times this level thus likely achieving maximal stimulation of leptin receptor across the brain areas examined. Our findings in rats support earlier evidence in C57BL/6J mice that within the hypothalamus, HF induced-leptin resistance is limited to the ARC region of the hypothalamus. In addition, we identified dietary induced cellular leptin resistance within the VTA. The previous study in FVB/N mice found that occurrence of leptin resistance in other hypothalamic regions that was depended on the length of the HF feeding (Metlakunta et al., 2008). In our study, it is unlikely that the lack of leptin resistance in other medial basal hypothalamic regions examined was due to the length of exposure to the HF diet. These rats were HF fed for greater than 6 months, a feeding period longer than both of the previous studies in mice.
Leptin resistance is generally believed to have a causative role in obesity and is demonstrated to predispose rodents to subsequent HF-induced obesity (Scarpace and Zhang, 2009). For instance, in rats with pre-existing leptin resistance due to chronic overexpression of leptin or age-related leptin resistance, subsequent exposure to a HF diet exacerbates food consumption and weight gain compared with HF-fed leptin responsive counterparts (Scarpace et al., 2005; Judge et al., 2008). The known role of VTA leptin receptor activity in consumption of sugar (Hommel et al., 2006) and the link between HF-dietary preference and VTA leptin signaling (Scarpace et al., 2010) indicates a role for VTA leptin function in tempering the consumption of palatable foods. Disruption in leptin function in the VTA would then predict increased vulnerability to HF-induced weight gain. Consistent with this idea is the observation in the present study that the preference for a 60% HF/7% sucrose diet diminished by the third day in the control group but not in the rats with leptin-induced leptin resistance. The identification of HF-induced leptin resistance in the VTA, in addition to the leptin resistance in the hypothalamus, provides one potential mechanism, underlying the increased susceptibility of leptin resistant rats to HF-induced obesity.
Interestingly, in this study, the degree of HF feeding induced leptin resistance is rather mild. Even in the ARC and VTA, the two regions in which leptin resistance was identified, there was still considerable leptin induced phosphorylated STAT3 in both the chow and HF fed rats. The extent of obesity in rodents lacking leptin or leptin receptor function exceeds that in rats with the dietary induced leptin resistance. Indeed, this observation first led to the hypothesis that HF-induced leptin resistance may be selective, and that some signaling must remains active in DIO rodents (Munzberg et al., 2004). The present data indicates that not only is HF-induced leptin resistance selective, but in those areas effected, it is incomplete, at least with respect to leptin-mediated STAT3 signaling. These findings are consistent with discrepancy in the degree of obesity with HF feeding and genetic models of obesity.
This study also examined regional signaling with leptin resistance induced by chronic overexpression of leptin. This form of leptin resistance develops gradually over time and is characterized by an absence of anorexic and weight reducing responses to centrally administered leptin (Scarpace et al., 2002b) and diminished leptin-mediated STAT3 signaling in the hypothalamus (Scarpace et al., 2005). The onset of leptin resistance in the present study is consistent with the absence of the increased WR activity over time with leptin overexpression. Surprisingly, the regional pattern of leptin resistance was distinctly different than that with HF-induced obesity. With chronic leptin overexpression, cellular leptin resistance was observed in every brain region examined including the VTA and in one region, the VMH, no leptin mediated signaling was detected in the rat with chronic leptin overexpression. Moreover, the degree of leptin resistance was substantially greater when compared with that observed with the 6-month HF feeding period. Possibly, the length of leptin overexpression (452 days) compared with 190 days of HF feeding accounts for the differences in degree and regional leptin resistance.
Worthy of note is the apparent increase in STAT3 phosphorylation in the ACSF injected rats with rAAV-leptin treatment compared with control vector counterparts. We generally observe this increase STAT3 signaling following rAAV-leptin administration and have confirmed this represents increased leptin receptor-mediated activation. The increased STAT3 phosphorylation with rAAV-leptin is completely reversed by subsequent infusion of a leptin receptor antagonist (Scarpace et al., 2007). Thus, this increase in rAAV-leptin mediated STAT3 signaling is contributing evidence that the transgene-produced leptin is reaching the appropriate target sites in the brain. Moreover, this increased STAT3 phosphorylation with rAAV-leptin does not appear to be coupled to metabolic responses. We demonstrated that infusion of a leptin antagonist in rats with chronic leptin overexpression did not induce any increase in food consumption or body weight (Scarpace et al., 2007). The implication is that downstream elements in the leptin receptor pathway may also have an important role in the mechanisms underlying leptin resistance.
Leptin receptor activation initiates a cascade of signaling events including specific phosphorylation of several tyrosine residues on the receptor. Of these, phosphorylation of Tyr 1138 recruits and promotes STAT3 phosphorylation, and this step is generally believed to be critical for the leptin mediation of feeding and energy regulation (Villanueva and Myers, 2008). This would predict that the near complete absence of STAT3 phosphorylation in the leptin-induced leptin resistance rats would render them readily susceptible to obesity. In fact, leptin overexpression does not result in obesity as long as the rats are maintained on a chow diet, although such leptin resistant rats display exacerbated HF-induced obesity (Scarpace et al., 2005). This is in contrast to that what is observed with a generalized sub-maximal central leptin receptor blockade. In a previous study, a partial blockade of leptin receptor activity in the brain was achieved by central overexpression of a leptin mutant, that acts as a dominate negative antagonist (Zhang et al., 2007; Matheny et al., 2009). This partial central receptor blockade was sufficient to elevate obesity on a chow diet under conditions both when food consumption was augmented or unchanged (Matheny et al., 2009). This previous data suggest that unrestrained leptin receptor activity is critical for energy homeostasis, and that even a sub-maximal but global disruption of leptin receptor function is sufficient to induce obesity on a diet of standard chow. Thus, this global but partial leptin receptor disruption is more obesogenic than the multi-site and nearly complete loss of leptin-mediated STAT3 phosphorylation induced by leptin overexpression. Such data imply that additional leptin receptor containing sites are responsible for the ability of these rats to maintain normal energy homeostasis in the face of leptin overexpression and disruption of STAT3 signaling in the hypothalamus and VTA or that leptin receptor mediated signaling other than STAT3 is assuming that role in the examined rat model.
It is likely that HF- or leptin-mediated leptin resistance involves multiple defects, but none that matches the totality of leptin receptor blockade or genetic obesity such as the Ob/ob mice or obese fa/fa Zucker rats (Frederich et al., 1995; da Silva et al., 1998). In addition, the role of other leptin-stimulated pathways may not yet be fully delineated. Leptin stimulated PI3 kinase activity is diminished in the hypothalamus with chronic leptin treatment (Sahu and Metlakunta, 2005; Metlakunta et al., 2008) and HF feeding. In addition, the leptin decrease in AMP kinase activity in the hypothalamus is tempered with DIO (Martin et al., 2006). However, at the present, there is no data on the consequences of HF feeding on region-specific leptin-mediated signaling involving these pathways. In addition, it is unknown whether downstream events in the STAT3 signaling pathway are also impaired in a region-specific manner with HF feeding.
In summary, this report demonstrates that HF feeding results in a regional specific decline in leptin-mediated STAT3 phosphorylation that is limited to the ARC and VTA. Despite this HF-induced leptin resistance, there remained robust residual leptin stimulated signaling in all regions. In contrast, with chronic leptin overexpression, leptin signaling was severely impaired in all areas examined and was extinguished in the VMH. The defective signaling in the ARC and VTA likely contribute to the increased susceptibility to HF-induced obesity in the leptin-resistance state, and suggest that these brain regions are favorable targets for restoration of leptin signaling to prevent or temper DIO.
Highlights.
High fat feeding decreases leptin mediated STAT3 signaling in select brain regions.
Diminished signaling was evident in arcuate nucleus and ventral tegmental area.
Unchanged signaling in lateral, ventromedial, and dorsomedial hypothalamus.
Leptin overexpression diminished leptin signaling in all brain regions examined.
Acknowledgements
Supported by the National Institute on Aging Grant AG-26159, University of Florida Institute on Aging and the Claude D. Pepper Older Americans Independence Center NIH P30 AG028740, and the Medical Research Service of the Department of Veterans Affairs.
Footnotes
Publisher's Disclaimer: This is a PDF file of an unedited manuscript that has been accepted for publication. As a service to our customers we are providing this early version of the manuscript. The manuscript will undergo copyediting, typesetting, and review of the resulting proof before it is published in its final citable form. Please note that during the production process errors may be discovered which could affect the content, and all legal disclaimers that apply to the journal pertain.
References
- Ahima RS, Flier JS. Leptin. Annu Rev Physiol. 2000;62:413–437. doi: 10.1146/annurev.physiol.62.1.413. [DOI] [PubMed] [Google Scholar]
- da Silva BA, Bjorbaek C, Uotani S, Flier JS. Functional properties of leptin receptor isoforms containing the gln-- >pro extracellular domain mutation of the fatty rat. Endocrinology. 1998;139:3681–3690. doi: 10.1210/endo.139.9.6168. [DOI] [PubMed] [Google Scholar]
- Dhillon H, Kalra SP, Prima V, Zolotukhin S, Scarpace PJ, Moldawer LL, Muzyczka N, Kalra PS. Central leptin gene therapy suppresses body weight gain, adiposity and serum insulin without affecting food consumption in normal rats: a long-term study. Regul Pept. 2001;99:69–77. doi: 10.1016/s0167-0115(01)00237-3. [DOI] [PubMed] [Google Scholar]
- El-Haschimi K, Pierroz DD, Hileman SM, Bjorbaek C, Flier JS. Two defects contribute to hypothalamic leptin resistance in mice with diet-induced obesity. J Clin Invest. 2000;105:1827–1832. doi: 10.1172/JCI9842. [DOI] [PMC free article] [PubMed] [Google Scholar]
- Frederich RC, Lollmann B, Hamann A, Napolitano-Rosen A, Kahn BB, Lowell BB, Flier JS. Expression of ob mRNA and its encoded protein in rodents. Impact of nutrition and obesity. J Clin Invest. 1995;96:1658–1663. doi: 10.1172/JCI118206. [DOI] [PMC free article] [PubMed] [Google Scholar]
- Fulton S, Woodside B, Shizgal P. Modulation of brain reward circuitry by leptin. Science. 2000;287:125–128. doi: 10.1126/science.287.5450.125. [DOI] [PubMed] [Google Scholar]
- Halaas JL, Boozer C, Blair-West J, Fidahusein N, Denton DA, Friedman JM. Physiological response to long-term peripheral and central leptin infusion in lean and obese mice. Proc Natl Acad Sci U S A. 1997;94:8878–8883. doi: 10.1073/pnas.94.16.8878. [DOI] [PMC free article] [PubMed] [Google Scholar]
- Hommel JD, Trinko R, Sears RM, Georgescu D, Liu ZW, Gao XB, Thurmon JJ, Marinelli M, DiLeone RJ. Leptin receptor signaling in midbrain dopamine neurons regulates feeding. Neuron. 2006;51:801–810. doi: 10.1016/j.neuron.2006.08.023. [DOI] [PubMed] [Google Scholar]
- Judge MK, Zhang J, Tumer N, Carter C, Daniels MJ, Scarpace PJ. Prolonged hyperphagia with high-fat feeding contributes to exacerbated weight gain in rats with adult-onset obesity. Am J Physiol Regul Integr Comp Physiol. 2008;295:R773–780. doi: 10.1152/ajpregu.00727.2007. [DOI] [PMC free article] [PubMed] [Google Scholar]
- Ladyman SR, Grattan DR. Region-specific reduction in leptin-induced phosphorylation of signal transducer and activator of transcription-3 (STAT3) in the rat hypothalamus is associated with leptin resistance during pregnancy. Endocrinology. 2004;145:3704–3711. doi: 10.1210/en.2004-0338. [DOI] [PubMed] [Google Scholar]
- Levin BE, Dunn-Meynell AA. Reduced central leptin sensitivity in rats with diet-induced obesity. Am J Physiol Regul Integr Comp Physiol. 2002;283:R941–948. doi: 10.1152/ajpregu.00245.2002. [DOI] [PubMed] [Google Scholar]
- Martin TL, Alquier T, Asakura K, Furukawa N, Preitner F, Kahn BB. Diet-induced obesity alters AMP kinase activity in hypothalamus and skeletal muscle. J Biol Chem. 2006;281:18933–18941. doi: 10.1074/jbc.M512831200. [DOI] [PubMed] [Google Scholar]
- Matheny M, Zhang Y, Shapiro A, Tumer N, Scarpace PJ. Central overexpression of leptin antagonist reduces wheel running and underscores importance of endogenous leptin receptor activity in energy homeostasis. Am J Physiol Regul Integr Comp Physiol. 2009;297:R1254–1261. doi: 10.1152/ajpregu.90449.2008. [DOI] [PMC free article] [PubMed] [Google Scholar]
- Metlakunta AS, Sahu M, Sahu A. Hypothalamic phosphatidylinositol 3-kinase pathway of leptin signaling is impaired during the development of diet-induced obesity in FVB/N mice. Endocrinology. 2008;149:1121–1128. doi: 10.1210/en.2007-1307. [DOI] [PMC free article] [PubMed] [Google Scholar]
- Morrison CD, Morton GJ, Niswender KD, Gelling RW, Schwartz MW. Leptin inhibits hypothalamic Npy and Agrp gene expression via a mechanism that requires phosphatidylinositol 3-OH-kinase signaling. Am J Physiol Endocrinol Metab. 2005;289:E1051–1057. doi: 10.1152/ajpendo.00094.2005. [DOI] [PubMed] [Google Scholar]
- Morton GJ, Blevins JE, Kim F, Matsen M, Figlewicz DP. The action of leptin in the ventral tegmental area to decrease food intake is dependent on Jak-2 signaling. Am J Physiol Endocrinol Metab. 2009;297:E202–210. doi: 10.1152/ajpendo.90865.2008. [DOI] [PMC free article] [PubMed] [Google Scholar]
- Munzberg H, Flier JS, Bjorbaek C. Region-specific leptin resistance within the hypothalamus of diet-induced obese mice. Endocrinology. 2004;145:4880–4889. doi: 10.1210/en.2004-0726. [DOI] [PubMed] [Google Scholar]
- Myers MG, Cowley MA, Munzberg H. Mechanisms of leptin action and leptin resistance. Annu Rev Physiol. 2008;70:537–556. doi: 10.1146/annurev.physiol.70.113006.100707. [DOI] [PubMed] [Google Scholar]
- Proietto J, Thorburn AW. The therapeutic potential of leptin. Expert Opin Investig Drugs. 2003;12:373–378. doi: 10.1517/13543784.12.3.373. [DOI] [PubMed] [Google Scholar]
- Sahu A, Metlakunta AS. Hypothalamic phosphatidylinositol 3-kinase-phosphodiesterase 3B-cyclic AMP pathway of leptin signalling is impaired following chronic central leptin infusion. J Neuroendocrinol. 2005;17:720–726. doi: 10.1111/j.1365-2826.2005.01362.x. [DOI] [PubMed] [Google Scholar]
- Scarpace PJ, Matheny M, Tumer N. Hypothalamic leptin resistance is associated with impaired leptin signal transduction in aged obese rats. Neuroscience. 2001;104:1111–1117. doi: 10.1016/s0306-4522(01)00142-7. [DOI] [PubMed] [Google Scholar]
- Scarpace PJ, Matheny M, Tumer N, Cheng KY, Zhang Y. Leptin resistance exacerbates diet-induced obesity and is associated with diminished maximal leptin signalling capacity in rats. Diabetologia. 2005;48:1075–1083. doi: 10.1007/s00125-005-1763-x. [DOI] [PubMed] [Google Scholar]
- Scarpace PJ, Matheny M, Zhang Y. Wheel running eliminates high-fat preference and enhances leptin signaling in the ventral tegmental area. Physiol Behav. 2010;100:173–179. doi: 10.1016/j.physbeh.2010.02.017. [DOI] [PMC free article] [PubMed] [Google Scholar]
- Scarpace PJ, Matheny M, Zhang Y, Cheng KY, Tumer N. Leptin antagonist reveals an uncoupling between leptin receptor signal transducer and activator of transcription 3 signaling and metabolic responses with central leptin resistance. J Pharmacol Exp Ther. 2007;320:706–712. doi: 10.1124/jpet.106.112813. [DOI] [PubMed] [Google Scholar]
- Scarpace PJ, Matheny M, Zhang Y, Shek EW, Prima V, Zolotukhin S, Tumer N. Leptin-induced leptin resistance reveals separate roles for the anorexic and thermogenic responses in weight maintenance. Endocrinology. 2002a;143:3026–3035. doi: 10.1210/endo.143.8.8966. [DOI] [PubMed] [Google Scholar]
- Scarpace PJ, Matheny M, Zhang Y, Tumer N, Frase CD, Shek EW, Hong B, Prima V, Zolotukhin S. Central leptin gene delivery evokes persistent leptin signal transduction in young and aged-obese rats but physiological responses become attenuated over time in aged-obese rats. Neuropharmacology. 2002b;42:548–561. doi: 10.1016/s0028-3908(02)00003-5. [DOI] [PubMed] [Google Scholar]
- Scarpace PJ, Zhang Y. Leptin resistance: a prediposing factor for diet-induced obesity. Am J Physiol Regul Integr Comp Physiol. 2009;296:R493–500. doi: 10.1152/ajpregu.90669.2008. [DOI] [PMC free article] [PubMed] [Google Scholar]
- Tinsley FC, Taicher GZ, Heiman ML. Evaluation of a quantitative magnetic resonance method for mouse whole body composition analysis. Obes Res. 2004;12:150–160. doi: 10.1038/oby.2004.20. [DOI] [PubMed] [Google Scholar]
- Villanueva EC, Myers MG., Jr. Leptin receptor signaling and the regulation of mammalian physiology. Int J Obes (Lond) 2008;32(Suppl 7):S8–12. doi: 10.1038/ijo.2008.232. [DOI] [PMC free article] [PubMed] [Google Scholar]
- Widdowson PS, Upton R, Buckingham R, Arch J, Williams G. Inhibition of food response to intracerebroventricular injection of leptin is attenuated in rats with diet-induced obesity. Diabetes. 1997;46:1782–1785. doi: 10.2337/diab.46.11.1782. [DOI] [PubMed] [Google Scholar]
- Wilsey J, Scarpace PJ. Caloric restriction reverses the deficits in leptin receptor protein and leptin signaling capacity associated with diet-induced obesity: role of leptin in the regulation of hypothalamic long-form leptin receptor expression. J Endocrinol. 2004;181:297–306. doi: 10.1677/joe.0.1810297. [DOI] [PubMed] [Google Scholar]
- Zhang J, Matheny MK, Tumer N, Mitchell MK, Scarpace PJ. Leptin antagonist reveals that the normalization of caloric intake and the thermic effect of food after high-fat feeding are leptin dependent. Am J Physiol Regul Integr Comp Physiol. 2007;292:R868–874. doi: 10.1152/ajpregu.00213.2006. [DOI] [PubMed] [Google Scholar]