Abstract
Despite the recent advances in computational modeling, experimental simulation of the circulation with congenital heart defect using mock flow circuits remains an important tool for device testing, and for detailing the probable flow consequences resulting from surgical and interventional corrections. Validated mock circuits can be applied to qualify the results from novel computational models. New mathematical tools, coupled with advanced clinical imaging methods, allow for improved assessment of experimental circuit performance relative to human function, as well as the potential for patient-specific adaptation. In this review, we address the development of three in vitro mock circuits specific for studies of congenital heart defects. Performance of an in vitro right heart circulation circuit through a series of verification and validation exercises is described, including correlations with animal studies, and quantifying the effects of circuit inertiance on test results. We present our experience in the design of mock circuits suitable for investigations of the characteristics of the Fontan circulation. We use one such mock circuit to evaluate the accuracy of Doppler predictions in the presence of aortic coarctation.
Keywords: congenital heart defects, Fontan operation, pulmonary insufficiency, mock circulation
1. Introduction
Many important surgical and interventional innovations in the management of congenital heart diseases owe their beginning to experimental mock circuits. For example, the present day modification of the Fontan operation for single ventricle hearts, the so-called total cavopulmonary connection (TCPC), was introduced by Marc de Leval in a series of experiments built with tubing and hand pumps (1). In these simple but elegant studies, the idea that the right atrium is able to provide systolic augmentation of the venous return and pulmonary blood flow in the atriopulmonary connection Fontan was disproven, and the modern concept of flow streamlining and energy optimization by minimizing turbulence was popularized. Similarly, rigorous and repetitive prosthetic valve testing in experimental left heart mock circuits is prerequisite prior to animal and human implantation. Much of the detailed dynamics of available prosthetic valves came from mock circuits using thermal and optical velocimetry techniques. The recent introduction of the transcatheter implantation of a stented bovine valve to treat chronic pulmonary regurgitation initially underwent extensive in vitro examinations (2).
While mock circuits simulating the left heart, or systemic, circulation have been developed and refined over the last forty years (e.g., 3–8), studies using verified circuits simulating pulmonary or surgically altered circulations in congenital heart defects have been limited (e.g., 9, 10). Possible reasons for this are the early lack of understanding of the role of the right ventricle and the pulmonary circulation and the much lower incidence in comparison to adult acquired heart diseases. Given the wide variety of defects, the complexity of surgically reconstructed cardiovascular anatomy, and altered cardiopulmonary physiology in hearts with shunts or absent connections/chambers/valves with a wide range of physiological parameters, experimental modeling of congenital heart diseases poses specific challenges that require engineering concepts and innovations previously not needed when designing test circuits for valve or vascular prosthesis in structurally normal hearts. Advances in engineering methods are aiding the design of mock circuits specific for congenital heart defects. For example, rapid prototype technology now allows fast and accurate anatomical reproductions of altered flow passages based on clinical imaging data and measurement advances provide the physiological parameters needed for customized, patient-specific studies. Nonetheless, the fundamental requirement that an experimental model be validated remains: the mock circuit has to behave similarly with the biological system it is simulating.
Concomitant with the progress in experimental mock circuit design, computational modeling has transformed the role of engineering in congenital heart diseases. The first application of computational modeling in congenital heart defects was introduced by Marc de Leval in 1996 to examine the influence of flow competition and energy dissipation in TCPC (11). Once developed, a numerical model can provide detailed flow information over a range of conditions with outstanding visualization. Continued advances are moving us towards more realistic simulations with the potential for patient-specific solutions. However, validation remains a key to successful translation of computational simulation results to effective clinical decision support.
Verification and validation are often used to refer to methods that quantify the quality of numerical models, but the terms are equally applicable to experimental models. All models are developed around a physical process, such as a Fontan circulation. Assumptions are applied in an effort to simplify the abnormal physiology in a manner that is consistent both with the question being addressed and with the capabilities of the modeling techniques used. With each simplification, the model is reduced from the original process. The role of verification is to test the correct execution of a model. This is done through a series of tests aimed directly at studying control, influence and effect. The role of validation is to test the outcomes from a model to ensure that its predictions are correct relative to the original physiology. Both methods need to be part of the experimental model qualification. A validated and accepted physical model, such as a mock circuit, can serve as a source of validation data for computational models.
In this paper, we discuss several mock circulation circuits developed to focus on flow studies of the circulation with congenital defects. The circuits are based on lumped parameter network models with adjustable parameters (so-called zero- dimensional or 0D models) having interchangeable three- dimensional (3D) test sections whose geometry can be based on a patient-specific anatomy. This multi-scale approach allows for customizing the circuit to match a particular patient while allowing for highly detailed measurements within realistic test sections using accurate time-dependent boundary conditions. We present several verification tests to support using the circuits as research tools for validating numerical models and we provide an animal validation study of an in vitro right heart circulation simulator.
2. Methods
The mock circuits described are based on practical realization of lumped parameter network models. In developing each model, the physiologically distinct segments within the circulation are assigned values for the ideal elements of resistance, compliance, and inertance. By incorporating a realistic test section, we achieve a multi-scale modeling approach: one that couples a lumped parameter time-responsive network (0D) with an anatomically correct test section (3D) model within which high resolution measurements are possible.
Resistance is defined as the viscous pressure drop Δp per flow rate Q through the blood vessels,
| (1) |
where n is 1 for laminar flows and n approaches ½ for flows through valves and stenoses. Flow resistance is realized physically by inserting capillary tubing or honeycomb matrix into the flow line. Or, one can use partially opened ball valves. We have developed interchangeable pre-calibrated honeycomb matrix modules, each consisting of a bundle of small 2mm diameter tubes that fill the inner space of a larger tube. Resistance is adjustable by blocking a variable number of tubes; physically squeezing on the flow line provides fine adjustment.
Compliance is the incremental change in blood volume Δ∀per change in transmural pressure Δp' by elastic stretching of the tissue,
| (2) |
Compliance is realized physically with an elastic element whose volume changes with pressure. We use either variable air volume chambers, referred to as Windkessel air chambers, or flexible elastic tubes housed within a pressurized enclosure. In either case, compliance is adjustable by changing enclosure air volume.
Inertance is the dynamic resistance of the blood to acceleration due to a pulsatile change of pressure, which is related to the vessel length ℓ, area A and fluid density ρ as
| (3) |
Inertance is realized physically by a length of flow tubing and is the force equivalent of mass inertia. The effects of inertance are particularly important in those blood vessels where flow is either pulsatile or phasic because the flow must accelerate, decelerate, and/or change directions.
2.1 In vitro Model of the Right Circulation
The pulmonary circulation can be modeled as a series of compliant compartments (e.g., 12), each compartment representing the pulmonary arteries, arterioles, capillaries, and pulmonary veins. For studies related to flow within the pulmonary artery, fewer compliance elements are needed to attain adequate fidelity with respect to pulmonary valve performance. In a mock circuit, using more compartments creates its own problems as hoses, fittings, and resistance elements contribute to increasing system inertance, which can become unnaturally high. As a practical matter it is necessary to simplify the in vitro right heart model.
The mock circuit is based on the reduced lumped parameter network model shown in Fig. 1. The model shown is divided into three compartments: right ventricle, pulmonary artery test section, and downstream vascular circulation with impedance. The right ventricle model reflects an earlier in vitro realization used to study pulmonary valve flows and is discussed below (10). The right atrium is represented as a constant pressure source. The tricuspid valve is represented by an ideal diode, to block reverse flow, with a resistance and inertance in series. The pulmonary artery test section can contain a pulmonary valve, no valve, or a flow control device (13). The test section is modeled as a variable resistance and impedance, the appropriate values being different in systole versus diastole. Each pulmonary branch contains a single compliance element. In this reduced form the compliance, inertance, and resistance elements no longer represent specific anatomical parts. Instead, the values are tuned to match the overall behavior of the pulmonary circulation.
Figure 1.
Lumped parameter network model used for the the right heart circulation circuit.
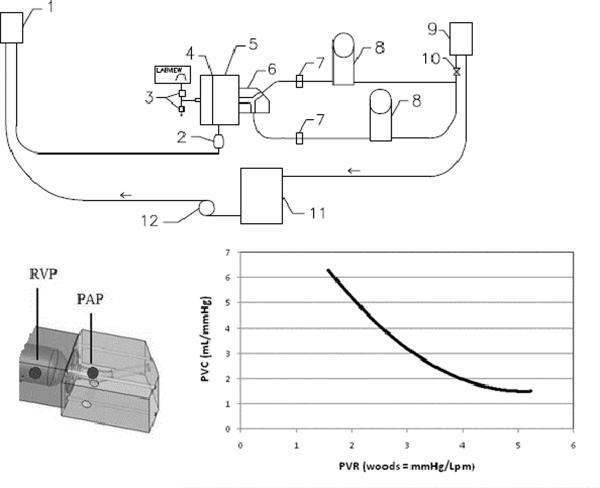
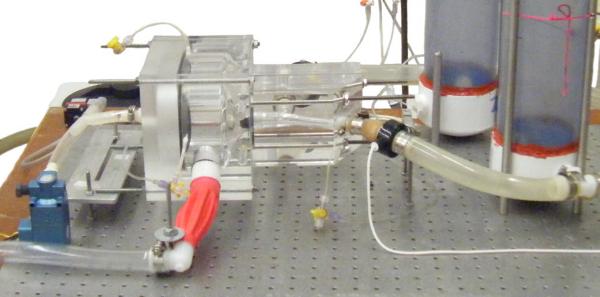
The physical mock circuit schematic is drawn in Fig. 2 with a close-up photograph in Fig. 3. The circuit flow is driven between right and left atrial pressures with time-dependent work added by the ventricle. The system uses a blood analog liquid made from saline and glycerin to simulate the viscosity and density of blood. For optical flow measurements, sodium iodide is added to match the index of refraction between the blood analog and vessel walls.
Figure 2.
Schematic of right heart circulation circuit with close-up of test section with pressure locations and a typical PVR-PVC curve of the system. (1) right atrial head tank, (2) atrium compliance sac, (3) computer-controlled air valves and vent, (4) diaphragm, (5) ventricle chamber, (6) interchangeable test section, (7) flow probes, (8) windkessel compliance chambers, (9) left atrial head tank, (10) resistance elements, (11) reservoir, (12) pump. PAP = pulmonary artery pressure; RVP = right ventricular pressure.
Figure 3.
Close-up view: ventricle and test section with right side compliance chambers.
The right ventricle is an acrylic chamber with its pulsatile flow action pneumatically driven by a circular diaphragm made from isobutylene isoprene. The ventricle is filled from a compliant right atrium, which is maintained at constant pressure by a head tank through a 27 mm tricuspid St Jude Medical bileaflet valve. The diaphragm separates the liquid side from the pressurized air side. Diaphragm motion is controlled using a 3-way programmable proportional pneumatic flow valve (Hoerbinger, GmbH; TecnoBasic, 0–1 bar), which provides a defined time-dependent air pressure to the diaphragm to facilitate systole and opening to atmosphere to facilitate diastole. A second pneumatic flow control valve (MAC; Model B225) aids venting during diastole. The ventricular function controls heart rate, pressure, and stroke volume to meet a range of physiological values.
The ventricle discharges directly into a transparent test section, which houses the test valve and branches into the right and left branch pulmonary arteries. The current acrylic test section is an accurate three-dimensional (3D) geometry derived by imaging a normal adult (Fig. 2 and 3) scaled to a 25 mm tissue annulus. Its transparent design permits detailed optical velocity measurements for validation-quality data.
Each pulmonary artery branch contains a parallel pressurized air (Windkessel) chamber, used to adjust the pulmonary vascular compliance. The chambers are made from 100 mm diameter plastic, and each is 750 mm in height. Air is trapped in the chamber using a simple plumber test plug, which seals the chamber to an adjustable and appropriate chamber air volume. Each branch uses a resistance element, an adjustable valve, and a head tank downstream to the compliance element in order to adjust the vascular resistance.
Instantaneous flow rates are measured using electromagnetic flow probes in each pulmonary branch (Carolina Medical Systems; P680 probe and Model FM501; 0–30 lpm, 0.1% full scale). Right ventricular pressure (RVP) and main pulmonary artery pressure (PAP) are measured from taps using fluid-filled transducers (BD Medical DTXplus; −30 to 300 mmHg, 0.5% full scale error). Time-based flow and pressure measurements are recorded on a computer, which is also programmed to control the ventricular action, using a data acquisition interface (National Instruments; Model 6052E, 16 bit; Labview 8.0).
The system has been used to study heart valves (10) and the potential of a motionless, flow resistance device known as a fluid diode to regulate pulmonary insufficiency (13). In those studies, regurgitant fraction (RF) is extracted from the instantaneous flow rate (Q) signals as
| (4) |
The instantaneous peak-peak transvalvular pressure gradient (PPG) is determined as
| (5) |
Reported average values are based on a statistically stationary ensemble of 75 contiguous cycles to achieve uncertainty to within 1.2% (p< 0.025).
Pulmonary vascular impedance (PVZ) is used to characterize the right ventricular afterload; it is a function of vascular resistance and compliance. Fourier analysis is used to transform the PAP and flow rate (Q) into spectral moduli (14) as
| (6) |
The impedance at the zero harmonic (Z0) is used as the pulmonary vascular resistance (PVR) (15). The characteristic impedance (Zc) is calculated as the average impedance modulus over the second through tenth harmonics (16). The impedance at the first harmonic behaves as the pulmonary vascular compliance (PVC). The values of PVR and PVC are adjustable but they are coupled, so the circuit tuning presents a family of possible combinations; Fig. 2 shows one impedance curve for this system. The uncertainties in the reported values for PVR and PVC are 5% and 3% (p < 0.025), respectively.
2.2 In vitro Mock Circuit of Aortic Coarctation
Aortic coarctation is one of the most common complications observed after Norwood stage I palliation for hypoplastic left heart syndrome. Characterization of the degree of stenosis in this setting has proven to be challenging. It is common observation (28) that there can be a large discrepancy between the invasive pressure gradients and those derived by echocardiography on the basis of the simplified Bernoulli equation (SBE)
| (7) |
The typical flow conditions with mild degrees of coarctation and the presence of variable degrees of hypoplasia of the descending thoracic aorta could represent the basis for presence of a pressure recovery phenomenon.
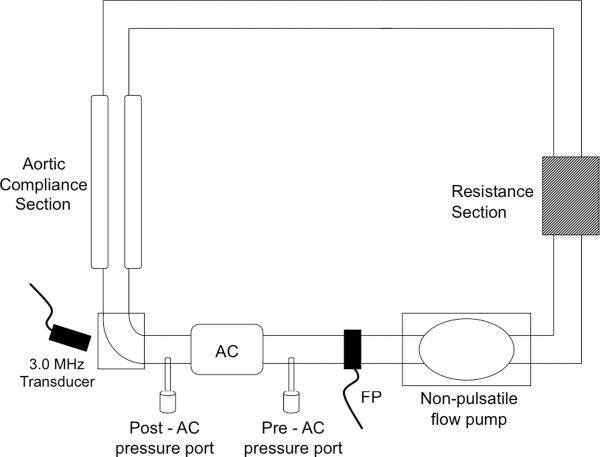
We designed an in vitro mock circuit to test the accuracy of Doppler predictions by varying aortic coarctation orifice size and varying size of the aorta distal to the stenosis. The circuit (Fig. 4) consists of a non-pulsatile flow centrifugal pump, an aortic flow chamber proximal to the stenosis where total aortic flow is measured by an external-clamp Doppler flow meter (Transonic Systems Inc., NY, USA; Model T110) and a stenotic section representing the aortic coarctation as positioned distal to the aortic flow chamber section, consisting of tubing of different sizes and lengths. Pressure ports are positioned just proximally and distally (1.5 cm) to the aortic coarctation section to allow measurement of pressure difference across the stenosis. A resistance section of 20 Woods, consisting of capillary tubing in parallel, simulates systemic arterial after-load. An aortic compliance section (air chamber) is interposed between the aortic coarctation and the resistance section.
Figure 4.
Mock flow loop circuit to test accuracy of Doppler predictions.
Aortic coarctation diameter (4, 6, 8, 10, and 13 mm of inner diameter) and the diameter of the descending aorta distal to the stenosis (15 and 25 mm of inner diameter) can be varied during the same flow and fluid viscosity conditions and instantaneous pressure gradient and the echocardiographic Doppler-derived gradient are measured.
To assess whether consideration of flow velocity proximal to the aortic coarctation leads to a better agreement between actual and Doppler-derived pressure gradients, the estimated pressure drop using the extended Bernoulli equation is calculated using
| (8) |
where V2 indicates the velocity of the jet within the vena contracta, and V1 indicates blood flow velocity just before the stenosis measured by pulsed wave Doppler. The effect of a pressure recovery phenomenon is studied as (26)
| (9) |
where Ax is the area of the vena contracta, and AA is the area of the aorta distal to the coarctation.
The percent error in Doppler prediction of the actual pressure gradient is calculated and represents the outcome variable.
2.3 In vitro Model of the Stage 3 Fontan Circulation
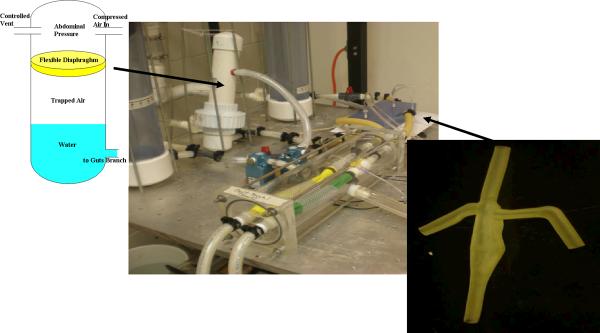
A multi-scale Fontan mock circulatory system is designed to reproduce the cardinal flows and pressures in the great veins with attention to the hepatic vein, also permitting differential response to flow regulation strategies. The system models five branches of circulation (upper body, splanchnic/hepatic, and lower body compartments, and the two pulmonary branches) with thoracic and abdominal respiration pressure interaction and incorporates flexibility in modeling the system impedances. The system is designed to allow for tuning to patient-specific parameters using an anatomically correct total-cavo-pulmonary connection (TCPC) for detailed flow measurements.
The natural venous flows are isolated from the pulsatile action of the heart, so in the mock system the heart pulsation is not modeled; the source of the systemic circulation is simplified to the constant mean aortic pressure; and the outlet of the pulmonary circulation is simplified to the constant mean atrial pressure. Respiration-driven variations of flow are caused by the action of the thoracic cavity pressure acting upon the compliance of the lungs and of the TCPC itself. Respiratory abdominal cavity pressure also acts upon the compliance of the liver and inferior vena cava (IVC), affecting flow in the hepatic vein.
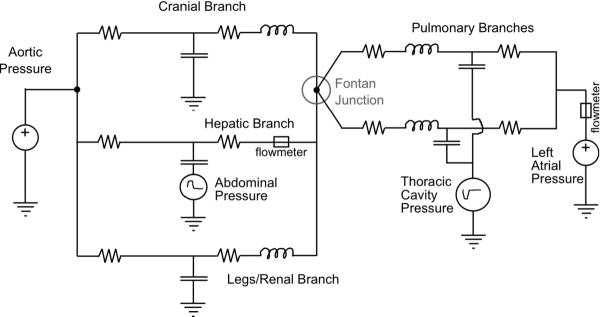
The mock circuit is modeled by the lumped parameter model of Fig. 5, in which the resistances and compliance of each branch were tuned to match the impedance of that region of the whole body model. Shown in Fig. 6, the pressure source and sink are realized by constant head tanks. All resistances are set by using regional reductions in tube diameter and adjustable valves. The upper (head) and lower body compliances are set using air (Windkessel) chambers, each made of 100 mm diameter, 750 mm long plastic cylindrical containers and sealed at the top with a moveable plumber test plug. In each pulmonary branch the compliance is modeled using an elastic membrane composed of a thin-walled silicone tube supported by a mesh adjusted to match the correct compliance and surrounded by a time-varying vacuum space to create the respiratory variation of thoracic cavity pressure. Thoracic cavity respiration is simulated using a computer controlled proportional pressure three-way control valve (SMC, Inc.; Model 1091) connected to a well regulated low vacuum source. Likewise the splanchnic compliance is modeled using an elastic diaphragm within an air chamber (Fig. 6); the abdominal respiration pressure is applied to the splanchnic compliance chamber using a three-way pressure control valve (MAC, Inc; Model B225) connected to a low pressure source.
Figure 5.
Lumped parameter network model of Stage 3 Fontan circulation incorporating respiration effects.
Figure 6.
In vitro circuit for Stage 3 Fontan Circulation. Close-ups: (r) silicone patient-specific TCPC model; (l) splanchic/hepatic compliance with imposed abdominal respiration
Patient-specific anatomy details are gained by clinical imaging. The tomographic model is reconstructed from CT images. A 3D geometric virtual-space model is built from MR image data volumes by identifying the centerline path along the pulmonary artery from which perpendicular 2-D segmentations of the vessel lumen are created and then merged creating a solid model of the vessel. Two TCPC test sections have been created by rapid manufacture technology for mock circuit verification and so as to gain experience with differing materials. Variations of this manufacturing technique have been reported previously (17, 18). The specific test model is based on images taken from an adolescent (13 yrs old) patient; however, other physiological data specific to this particular patient are not releasable, so tests were done using generic human data.
One test section is printed by stereolithography using a transparent polycarbonate-like resin (Accura 60) to allow flow visualization and detailed velocity measurements. A second test section (Fig. 6) is printed by the multi-jet process with a 16 micron build layer using semi-transparent rubber (Tango-Plus 27 Shore A) to approximate the compliance of the natural TCPC during respiration. Compliance is adjusted during design by varying the local vessel wall thickness. This elastic test section was placed in a chamber and subjected to the same thoracic cavity vacuum as the pulmonary compliances, to produce respiratory-driven flows. The material has very good elongation properties but low tear strength; still, it handles the low amplitude cycling well.
In the hepatic vein, flow rate is measured by an in-line electromagnetic flow probe (Carolina Medical Electronics; P640 probe, FM501; 0–30 lpm, 0.1% full scale error). Overall steady system flow rate is measured with a turbine flow meter (Omega Engineering; Model FTB2001; 0.5 to 40 Lpm, 1% error). Pressures are measured within the superior and sub-inferior vena cava, each pulmonary artery branch, and within the respiration chambers (BD Medical DTXplus; −30 to 300 mmHg, 0.5% error). All transducer signals are operated and recorded using a computer-based data acquisition system and custom software (National Instruments; USB-6216, 16-bit, Labview 8).
3. Results
3.1 Right Heart Circulation Mock Circuit
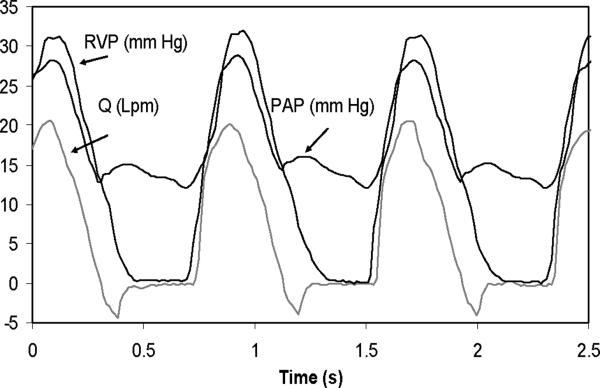
As a verification test for circuit function, the right heart circulation mock system was fitted with a 25 mm St Jude Medical bileaflet valve as the pulmonary valve and operated at 5 L/minute (Lpm) at 75 beats/minute (bpm) at 45% systolic ratio. A typical pressure-flow rate curve at PVR = 3.6 Woods is shown in Fig. 7. The signals are well behaved with right ventricular pressure (RVP) rapidly increasing with contraction and flow rate (Q) increasing as well. There is a well defined pressure gradient with the pulmonary artery pressure (PAP) at peak systole, a dicrotic notch observed at valve closure, and a well defined diastolic gradient measured during diastole. The flow rate shows closure leakage at diastole relaxing to near zero regurgitant flow. Baseline mean regurgitant fraction is 4.1 ± 1.2% (p < 0.025). These pressure-flow rate curves are as expected and offer verification that the circuit is functioning correctly (10, 19).
Figure 7.
Pressure and flow signals obtained with a 25 mm St Jude Medical bileaflet valve in right heart circulation circuit.
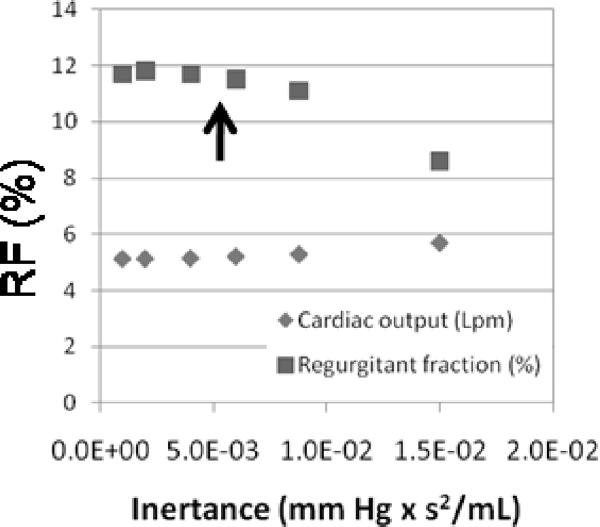
In a pulsatile flow, the system inertance has a significant effect on diastolic function. As a verification test, the tubing length between the test section and the compliance sections on the mock right heart circuit were systematically reduced from a generous initial value while maintaining flow rate. For this test, a fluid diode, a motionless, preferred direction and resistance device was used in place of a pulmonary valve (13, 20). Instantaneous pressure and flow rate were measured and regurgitant fraction through the diode determined as shown in Fig. 8. Longer lengths were found to decrease measured regurgitation, while shorter lengths showed regurgitation moving towards a limit of asymptotic convergence. By keeping the inertance within the limit of convergence using shorter tubing lengths, the systematic (offset) uncertainty in regurgitant fraction due to inertance was reduced to less than 0.5% (p < 0.025). This verification test reveals the insidious influence of inertance on diastolic function within mock circulation systems.
Figure 8.
Effect of inertance on the measured value of regurgitant fraction within the right heart circulation circuit. The system is operated within the asymptotic limit of low inertance (region left of the arrow) shown. PVR = 3 Woods; PVC = 3.2 mL/mm Hg.
Validation of the mock circuit measured pressure and flow rate function was offered through comparison with an acute animal model. The model used 75 kg farm swine undergoing fluid diode implantation by median sternotomy and cardiopulmonary bypass. General anesthesia was induced and the heart exposed. The aorta and right atrium were cannulated and cardiopulmonary-bypass (CPB) initiated. The main pulmonary artery (MPA) was exposed and incised and the pulmonary valve leaflets excised. The diode was secured within the MPA by circumferential ligature. The MPA was then sewn closed. The animal was weaned from CPB and sacrificed by euthanasia following a 4 hour test period post-CPB.
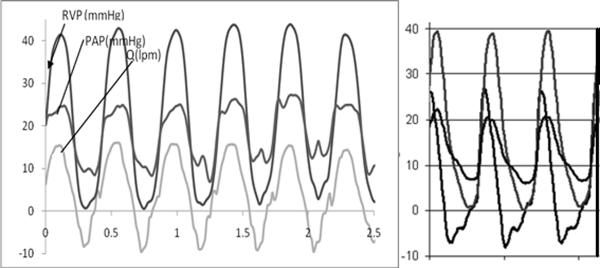
Pressure catheters were inserted into the right ventricle, the proximal right pulmonary artery (RPA), and the aorta. A flow probe (Carolina Medical Electronics) was placed around the MPA just distal to the diode. Measured physiological traces are given in Fig. 9, which compares the measured RVP, PAP, and flow Q during the animal model test with corresponding curves obtained in the mock right circulation circuit operating under similar conditions. The in vivo traces show a systolic gradient of 16 mm Hg with a diastolic gradient supporting flow regulation. Regurgitation is present at 18%. These compare with values of 17 mm Hg and 17% measured experimentally. The in vivo acquired pressure and flow traces compare very favorably with the in vitro data in both trend and magnitudes. The systolic flow rate is a bit more abrupt in the mock circuit. Otherwise, the model provides strong validation of the ability of the in vitro circuit to model the pressure and flow in the pulmonary artery. This finding lends support for other validation-level measurements within the mock circuit.
Figure 9.
Comparisons of pressure and flow measurements made in vivo (left; swine model) and in vitro (right) under similar conditions using an 18 mm open cusp fluid diode as a pulmonary flow regulating device (13).
3.2 In vitro Mock Circuit of Aortic Coarctation
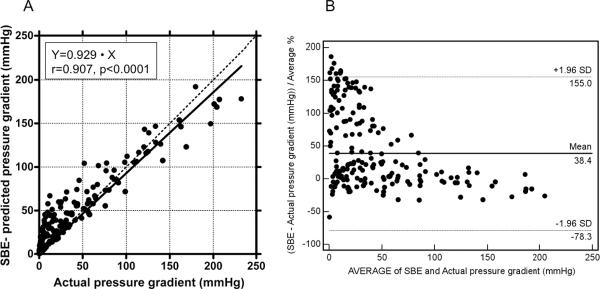
Actual pressure gradients measured across the aortic coarctation ranged from 0.14 to 232 mm Hg for different flow conditions. Pressure drops predicted by the SBE ranged from 0.26 to 192 mmHg. As expected, there was a significant correlation between actual and SBE-predicted pressure gradients (r=0.907, p<0.0001; Fig. 10A). The Bland-Altman plot confirmed the overall good agreement between actual and SBE-predicted gradients, with prevalent overestimation of actual pressure gradient by the SBE in conditions with low actual pressure gradients (Fig. 10B).
Figure 10.
Correlation between Doppler-derived (using the simplified Bernoulli equation) and actual pressure gradient for all study conditions (A). Bland-Altman plot for Doppler-derived and actual pressure gradient for all study conditions (B).
Overall, we observed a progressive overestimation of pressure gradient by SBE when aortic coarctation diameter was increased from 4 to 13 mm (p<0.0003) or when the diameter of the distal aorta was reduced from 25 to 15 mm (p<0.0001).
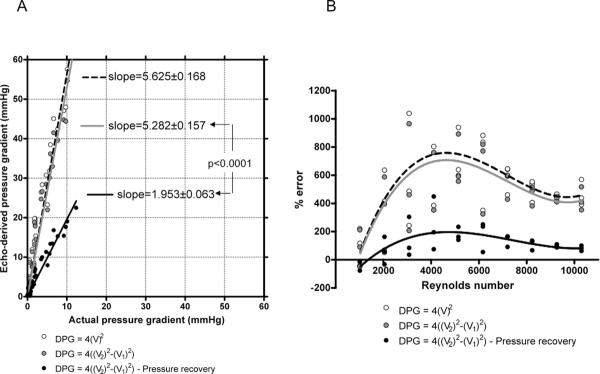
To identify a potential key factor responsible for the important overestimation, the Doppler-predicted pressure drop was calculated using each of eq. 7 – 9. We observed that the extended Bernoulli equation was not able to correct the discrepancy between actual and echo-derived pressure gradients. A significant reduction in this discrepancy was observed after consideration of pressure recovery effects (p<0.001; Fig. 11). Transforming the data into the Reynolds number (based on tube diameter) domain collapsed the data into a “sigmoid” pattern, with lowest discrepancies observed using eq. 9. But even using the extended Bernoulli equation with pressure recovery a discrepancy still occurred in most cases with overestimation being predominant for Reynolds numbers between 2000 and 8000. Overestimation decreased progressively for Reynolds numbers >8000. The mean Reynolds number for this study condition was 5667±3010.
Figure 11.
Graphic display of the linear regression between actual pressure gradient and Doppler-derived pressure gradients in the AC model with inner diameter = 13 mm (A). Panel B shows the relationship between Reynolds number and Doppler/actual percent error using different forms of Bernoulli equation.
3.2 In vitro Stage 3 Mock Fontan Circuit
The system was scaled to the parameters (Table 1) of a small child (body area = 0.75 m2) (21). The upper and lower head tank pressures are adjusted to 44.6 mm Hg and 6.4 mm Hg, respectively, to achieve a total system cardiac flow rate of 1.8 Lpm. Thoracic cavity respiration pressure was varied between 0 to −4 mm Hg and the abdominal respiration pressure between 0 and 2 mm Hg, each at 20 breaths/minute.
Table 1.
Stage 3 Fontan Circuit: Lumped Parameter Values Used in Verification Tests
| R1 mmHg*(ml/s)−1 | R2 mmHg*(ml/s)−1 | C ml*mmHg−1 | |
|---|---|---|---|
| Lower body | 3.790 | 0.065 | 1.322 |
| Splanchnic | 9.135 | 0.094 | 2.168 |
| Upper body | 1.750 | 0.108 | 2.150 |
| Pulmonary | 0.077 | 0.163 | 1.398 |
| TCPC | 0.877 |
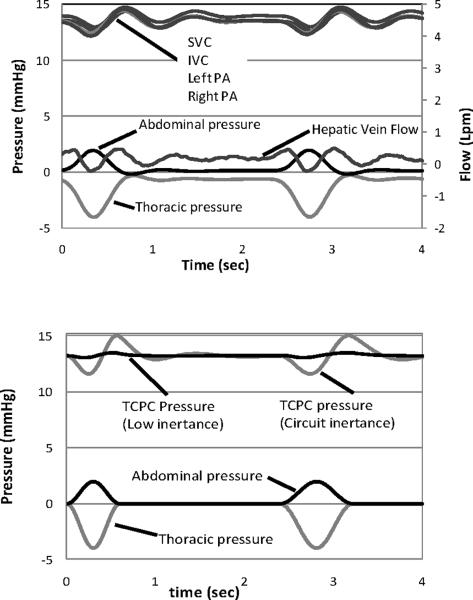
The measured pressures and flow rates are shown in Fig. 12 top. The experimental abdominal and thoracic cavity respiration pressures are physiologically reasonable and the computer-controlled waveforms can be further modified to simulate an individual patient. For comparison and in lieu of clinical data, the lumped parameter network of Fig. 5 is solved numerically (Mathworks, Inc.; Matlab) as shown in Fig. 12 bottom. The experimental respiration input values are seen closely matched with the numerical input values. Experimental pressures (Fig. 12 bottom) are measured in the superior and sub-inferior vena cava and the left and right pulmonary branches. The mean pressure falls within the expected range and the time-dependent behavior with respiration is as expected. Numerical results report the TCPC pressures in center of the junction. Agreement between the numerical mean pressure predictions (Fig. 13) and the mean experimental values is within ± 2.3%. In the mock circuit, the thoracic chamber has a length and inertance equivalent to an adolescent. When the numerical model inertance is matched to that existing in the circuit, the prediction shows the same pressure amplitude oscillations as the experiment. When the inertance is lowered to the small child values of Table 1, the oscillation amplitudes diminish. A thoracic chamber appropriately sized to the patient should accommodate this in the future. The experimentally measured hepatic vein flow rate shows a phasic relationship with the respiratory cycle, with satisfactory amplitudes. A flow reversal (negative flow rate) measured within the hepatic vein is observed during inspiration, duplicating previous clinical reports and measured experimentally for the first time (22, 23). The reasonable agreement in pressure and flow behavior provides verification of system function.
Figure 12.
(top) Instantaneous pressure, hepatic vein flow rate, and respiration in the Stage 3 Fontan circuit with compliant TCPC model and tuned to the element values in Table 1. (bottom) Predictions from a numerical simulation using the element values in Table 1. TCPC pressures are predicted at the junction. Low inertance is tuned to patient; circuit inertance is tuned to the system.
Figure 13.
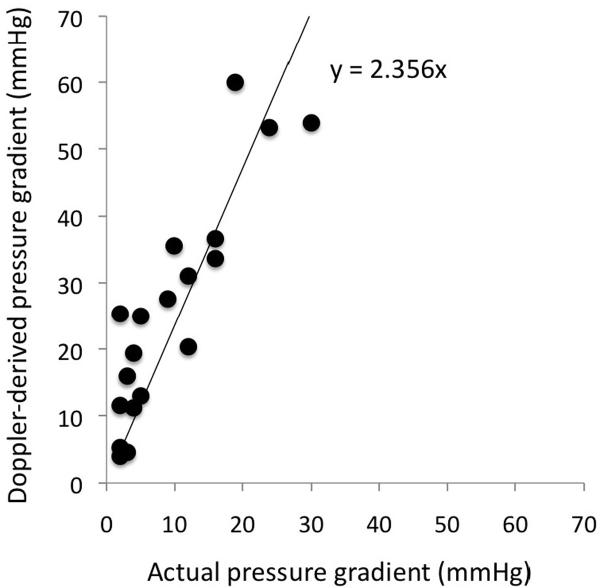
Comparison of non-invasive Doppler-derived (based on the modified Bernoulli equation) and invasive catheter measured pressure gradients in 23 patients following Stage 1 Norwood procedures.
4 Discussion
Multiscale modeling allows for realistic, time-dependent boundary conditions at the inflow and outflow boundaries of a three-dimensional (3D) model of a portion of the circulation. The boundary conditions are constantly and appropriately allowed to react by using a lumped parameter (0D) network. Progress has been made on multi-scale modeling to enable numerical simulations to obtain very detailed flow information (e.g., 24). By designing a mock circuit in a similar way, the mock circuit can be used to provide data to assess the quality of a numerical model.
Patients with congenital heart defects will undergo non-invasive (MR, CT, or echocardiography) and/or invasive (catheterization) investigations prior to a surgical procedure. Echocardiography examines both anatomy and function, while pulsed-waved Doppler characterizes flow. Catheterization of the cardiovascular system measures important fluid dynamic variables, such as pressures in various compartments of the circulation, resistances in the systemic and pulmonary circulations, and cardiac output (25). Imaging allows for 3D anatomical reconstructions of altered circulations within a virtual model. This clinical information provides the boundary conditions, parametric definitions, and anatomical details for multi-scale models.
Concomitant advances in rapid manufacturing technology permit transferring anatomical virtual models to a three-dimensional printer to provide for high resolution accurate reproduction for test sections (17, 18). Mean time for turnaround from imaging to a test ready model can be as little as a few days. Because they can be produced in a short period of time, these offer the real potential for patient-specific in vitro studies. When using a solid resin model, the actual distensibility of blood vessels and the associated Windkessel effect of the proximal arteries are not replicated. Instead compliance is implemented by means of downstream lumped element air chambers. But validation tests indicate that global time-dependent pressure and flow rate remain preserved. As many numerical models continue to use rigid test sections, this finding is both important and useful. Future advances anticipate the arrival of new compliant materials applicable with improved strength, MR compatibility, and optical clarity.
Congenital defects require very adaptable circulations to accommodate abnormalities or surgical alterations and the differing impedances between the pulmonary and systemic circulations (19). We describe a mock pulmonary circulation circuit intended for use in studies of pulmonary insufficiency. A common verification test for mock circuits is tuning to achieve acceptable and expected pressure waveforms. Verification of expected pressure and flow rate waveforms is provided using a mechanical heart valve with satisfactory results. The effects of circuit inertance are insidious allowing for a systematic error (i.e., offset) of test results, particularly results that rely on the correct simulation of antegrade diastolic motions, systolic accelerations, or phasic motions. In the case of pulmonary insufficiency, we speculate that a high inertance system will cause under-prediction in the magnitude of pulmonary regurgitation. A unique aspect of this study is its description of a verification test used in minimizing the influence of circuit inertance on diastolic function and test outcomes.
Validation tests are best done between systems of differing bases. An animal model based on farm swine is used to validate not only the physiological waveforms but, importantly, also the measurements of regurgitant fraction and pressure gradient made within the mock circulation. The demonstrated ability of the mock circuit to reproduce such information accurately provides a reliable and independent method to compare devices and to study the effects of congenital circulation anomalies.
By using a mock circuit to simulate the post-Norwood circulation with aortic coarctation, we substantiate our clinical impression that when pressure recovery is accounted for, overall pressure drop overestimation by Doppler is significantly reduced. We also demonstrated that the error is Reynolds number dependent and the data collapsed into a characteristic sigmoid pattern, identical to one previously observed for aortic valve stenosis (26). Measurement of pressure gradients across the aortic isthmus by the use of SBE is an integral part of quantitative echocardiographic assessment, and is widely used for noninvasive assessment of aortic coarctation. The pressure drop obtained at cardiac catheterization, however, remains the gold standard used in therapeutic decision-making. It is common knowledge that pressure drops estimated by Doppler in the echocardiography laboratory tend to be higher than those measured subsequently by catheter (e.g., Fig. 13). These often-dramatic changes in pressure drop cannot be fully explained by changes in the hemodynamic state of the patient. Indeed, when simultaneous echo-catheter studies are performed, apparent overestimation by Doppler is still found (26, 27). Using a mock circuit, we demonstrate that overestimation is basic because of the concept of pressure recovery, and that it is modulated by forces embodied in the Reynolds number.
For the first time, the important respiration-driven flow in a single ventricle Stage 3 Fontan circulation has been modeled experimentally within a mock circuit and with realistic patient-specific geometry and fully adjustable compartmentalized parameters. The hepatic venous flow is measured and found to be phasic with respiration with a brief flow reversal, a finding that is consistent with clinical reports. This negative flow places additional work on the Fontan circulation. The absence of a ventricular power source and placement of the pulmonary vascular resistance in series with the systemic resistance result in significant tension being placed on the systemic venous return. Such chronic hypertension may lead to liver failure and other consequences (23). Although flow characteristics are spatially continuous, these appear to be well modeled with the lumped parameter elements. Hsia et al (22, 23) have documented a simultaneous respiratory pressure coupled through the abdominal organs to the venous flow and sufficient to reverse flow in the hepatic vein during exhalation. This experimental circuit can be used to study different patient-specific strategies for the Fontan operation and with further verification be used to provide validation-quality data for validation of numerical models of the Fontan circulation.
Acknowledgement
The authors gratefully acknowledge the support of the Leducq Foundation, the National Institutes of Health (grant number HL083975), and the National Science Foundation.
Footnotes
Publisher's Disclaimer: This is a PDF file of an unedited manuscript that has been accepted for publication. As a service to our customers we are providing this early version of the manuscript. The manuscript will undergo copyediting, typesetting, and review of the resulting proof before it is published in its final citable form. Please note that during the production process errors may be discovered which could affect the content, and all legal disclaimers that apply to the journal pertain.
Conflict of Interest Statement None declared
References
- 1.de Leval MR, Kilner P, Gewillig M, Bull C. Total cavopulmonary connection: a logical alternative to atriopulmonary connection for complex Fontan operations. Experimental studies and early clinical experience. J Thorac Cardiovasc Surg. 1988 Nov;96(5):682–95. [PubMed] [Google Scholar]
- 2.Bonhoeffer P, Boudjemline Y, Saliba Z, Hausse AO, Aggoun Y, Bonnet D, et al. Transcatheter implantation of a bovine valve in pulmonary position: a lamb study. Circulation. 2000 Aug 15;102(7):813–6. doi: 10.1161/01.cir.102.7.813. [DOI] [PubMed] [Google Scholar]
- 3.Wieting DW. Ph.D. Dissertation. University of Texas; Austin: 1969. Dynamic flow characteristics of heart valves. [Google Scholar]
- 4.Figliola RS, Mueller TJ. On the hemolytic and thrombogenic potential of mechanical heart valve flows. J Biomech Engr. 1981;103:83–89. doi: 10.1115/1.3138265. [DOI] [PubMed] [Google Scholar]
- 5.Chandran KB, Yearwood TL, Chen C, Falsetti H. Pulsatile flow experiments on heart valve prostheses. Medical and Biological Engineering and Computing. 1983;5:529–537. doi: 10.1007/BF02442377. 21. [DOI] [PubMed] [Google Scholar]
- 6.Timms D, Hayne M, McNeil K, Galbraith A. A Complete Mock Circulation Loop for the Evaluation of Left, Right, and Biventricular Assist Devices. Artificial Organs. 2005;29(7):564–572. doi: 10.1111/j.1525-1594.2005.29094.x. [DOI] [PubMed] [Google Scholar]
- 7.Pantalos GM, Koenig SC, Gillars KJ, Giridharan GA, Ewert DL. Characterization of an Adult Mock Circulation for Testing Cardiac Support Devices. ASAIO Journal. 2004;50(1):37–46. doi: 10.1097/01.mat.0000104818.70726.e6. [DOI] [PubMed] [Google Scholar]
- 8.Tanné D, Bertrand E, Kadem L, Pibarot P, Rieu R. Assessment of left heart and pulmonary circulation flow dynamics by a new pulsed mock circulatory system. Experiments in Fluids. 2010;48(5):837–850. [Google Scholar]
- 9.Pantalos GM, Ionan C, Koenig SC, Gillars KJ, Horrell T, Sahetya S, Colyer J, Gray LA. Expanded Pediatric Cardiovascular Simulator for Research and Training. ASAIO Journal. 2010;56(1):67–72. doi: 10.1097/MAT.0b013e3181c838ae. [DOI] [PubMed] [Google Scholar]
- 10.Gohean J, Figliola R, Camp T, McQuinn T. Comparative in vitro study of bileaflet and tilting disk valve behavior in the pulmonary position. ASME J Biomechanical Engineering. 2006;128(4):631–635. doi: 10.1115/1.2206204. [DOI] [PubMed] [Google Scholar]
- 11.de Leval MR, Dubini G, Migliavacca F, Jalali H, Camporini G, Redington A, et al. Use of computational fluid dynamics in the design of surgical procedures: application to the study of competitive flows in cavo-pulmonary connections. J Thorac Cardiovasc Surg. 1996 Mar;111(3):502–13. doi: 10.1016/s0022-5223(96)70302-1. [DOI] [PubMed] [Google Scholar]
- 12.Kilner PJ, Balossino R, Dubini G, Babu-Narayan SV, Taylor AM, Pennati G, Migliavacca F. Pulmonary regurgitation: the effects of varying pulmonary artery compliance, and of increased resistance proximal or distal to the compliance. Int J Cardiol. 2009;133(2):157–166. doi: 10.1016/j.ijcard.2008.06.078. [DOI] [PubMed] [Google Scholar]
- 13.Camp TA, Stewart KC, Figliola RS, McQuinn T. In Vitro Study of Flow Regulation for Pulmonary Insufficiency. ASME J Biomechanical Engineering. 2007;129(2):284–288. doi: 10.1115/1.2540892. [DOI] [PMC free article] [PubMed] [Google Scholar]
- 14.Westerhof N, Stergiopulos N, Noble M. Snapshots of Hemodynamics. Springer; New York: 2005. [Google Scholar]
- 15.Weinberg CE, Hertzberg JR, Ivy DD, Kirby KS, Chan KC, Valdes-Cruz L, Shandas R. Extraction of Pulmonary Vascular Compliance, Pulmonary Vascular Resistance, and Right Ventricular Work From Single-Pressure and Doppler Flow Measurements in Children With Pulmonary Hypertension: a New Method for Evaluating Reactivity. Circulation. 2004;10(17):2609–2617. doi: 10.1161/01.CIR.0000146818.60588.40. [DOI] [PubMed] [Google Scholar]
- 16.Huez S, Brimioulle S, Naeije R, Vachiery JL. Feasibility of Routine Pulmonary Arterial Impedance Measurements in Pulmonary Hypertension. Chest. 2004;125(6):2121–2128. doi: 10.1378/chest.125.6.2121. [DOI] [PubMed] [Google Scholar]
- 17.Schievano S, Coats L, Khambadkone S, Carminati M, Wilson N, Deanfield JE, Bonhoeffer P, Taylor AM. Planning of percutaneous pulmonary valve implantation based on rapid prototyping of the right ventricular outflow tract and pulmonary trunk from magnetic resonance imaging data. Radiology. 2007;242(2):490–497. doi: 10.1148/radiol.2422051994. [DOI] [PubMed] [Google Scholar]
- 18.de Zélicourt D, Pekkan K, i Kitajima H, Frakes D, Yoganathan AP. Single-Step Stereolithography of Complex Anatomical Models for Optical Flow Measurements. J. Biomech. Eng. 2005;127(1):204–208. doi: 10.1115/1.1835367. [DOI] [PubMed] [Google Scholar]
- 19.Rosendorff C, editor. Essential Cardiology: Principles and Practice. W.B. Saunders; New York: 2001. [Google Scholar]
- 20.Hsia TY, Figliola RS, Camp TA, McQuinn T. A fluid diode for control of pulmonary insufficiency. Proceedings AATS. 2010 JAATS, 2010 (in press) [Google Scholar]
- 21.Migliavacca F, Balossino R, Pennati G, Dubini G, Hsia T-Y, de Leval MR, Bove EL. Multiscale modelling in biofluidynamics: application to reconstructive paediatric cardiac surgery. Journal of Biomechanics. 2006;39(6):1010–1020. doi: 10.1016/j.jbiomech.2005.02.021. [DOI] [PubMed] [Google Scholar]
- 22.Hsia T-Y, Khambadkone S, Redington AN, Migliavacca F, Deanfield JE, de Leval MR. Effects of respiration and gravity on infra-diaphragmatic venous flow in normal and Fontan patients. Circulation. 2000;102(Suppl III):III148–153. doi: 10.1161/01.cir.102.suppl_3.iii-148. [DOI] [PubMed] [Google Scholar]
- 23.Hsia T-Y, Khambadkone S, Deanfield JE, Taylor JFN, Migliavacca F, de Leval MR. Sub-diaphragmatic venous hemodynamics in the Fontan circulation. J Thorac Cardiovasc Surg. 2001;121:436–447. doi: 10.1067/mtc.2001.112527. [DOI] [PubMed] [Google Scholar]
- 24.Migliavacca F, Laganà K, Pennati G, de Leval MR, Bove EL, Dubini G. Global mathematical modeling of the Norwood circulation: a multiscale approach for the study of pulmonary and coronary perfusions. Cardiol Young. 2004;14(Suppl. 3):71–76. doi: 10.1017/s1047951104006614. [DOI] [PubMed] [Google Scholar]
- 25.Chaturvedi RR, et al. Left ventricular dysfunction after open repair of simple congenital heart defects in infants and children: quantitation with the use of a conductance catheter immediately after bypass. J Thorac Cardiovasc Surg. 1998;115(1):77–83. doi: 10.1016/s0022-5223(98)70446-5. [DOI] [PubMed] [Google Scholar]
- 26.Cape EG, Jones M, Yamada I, Van Auker MD, Valdes-Cruz LM. Turbulent/viscous interactions control dopller/catheter pressure discrepancies. Circulation. 1996;94:2975–2981. doi: 10.1161/01.cir.94.11.2975. [DOI] [PubMed] [Google Scholar]
- 27.Bengur AR, Snider AR, Meliones JN, Vermilion RP, Peters J, Merida-Asmus L. Doppler evaluation of aortic valve area in children with aortic stenosis. J Am Coll Card. 1991;18(6):1499–1505. doi: 10.1016/0735-1097(91)90681-x. [DOI] [PubMed] [Google Scholar]
- 28.Giardini A, Tracy TA. Non-invasive estimation of pressure gradients in regurgitant jets: an overdue consideration. European J Echocardiography. 2008;9:578–584. doi: 10.1093/ejechocard/jen156. [DOI] [PubMed] [Google Scholar]


