

Abstract
T cell activation requires the formation and maintenance of stable interactions between T cells and antigen presenting cells (APC). The formation of stable T cell-APC contacts depends on the activation of the integrin, LFA-1 (CD11aCD18). Several positive regulators of LFA-1 activation downstream of proximal TCR signaling have been identified including talin; however, negative regulators of LFA-1 activity remain largely unexplored. PIPKIγ90 is a member of the type I phosphatidylinositol phosphate kinase family that has previously been shown to modulate talin activation of integrins through production of phosphatidylinositol (4,5) bisphosphate, PI(4,5)P2, and direct binding to talin. In this study, we show that PIPKIγ90 negatively regulates LFA-1-mediated adhesion and activation of T cells. Using CD4+ T cells from PIPKIγ90-deficient mice, we show that CD4+ T cells exhibit increased LFA-1 dependent adhesion to ICAM-1 and increased rates of T cell-APC conjugate formation with enhanced LFA-1 polarization at the synapse. In addition to increased adhesiveness, PIPKIγ90-deficient T cells exhibit increased proliferation both in vitro and in vivo and increased production of interferon-γ and IL-2. Together, these results demonstrate that PIPKIγ90 is a novel negative regulator of antigen-induced T cell adhesion and activation.
Keywords: T cells, Cell Proliferation, Cell Activation, Transgenic/Knock Out Mice, Spleen/Lymph Node, Rodent
Introduction
T cells are highly motile cells that can rapidly transition to form stable, long-lasting contacts with antigen presenting cells (APC) bearing a peptide fragment in the context of MHC. Contact sites between T cells and APC, known as the immune synapse, are characterized by the polarization of signaling and adhesive molecules at the contact interface, including the integrin LFA-1 (1). Recent advances in imaging have shown that T cells can maintain contact with antigen bearing dendritic cells for up to 24 hours (2) and that the duration of contact between T cells and APC correlates with the degree of proliferation and cytokine production both in vitro and in vivo (3), (4), (5).
Formation of a stable immune synapse and stable T cell-APC interactions require the polarization of the integrin, leukocyte function antigen-1 (LFA-1) (CD11aCD18). LFA-1-deficient T cells and those treated with LFA-1 blocking antibodies fail to conjugate (1), (6). Additionally, CD18-deficient mice show defects in CD4+ T cell proliferation and antibody generation in response to antigen challenge (7). LFA-1 activity is regulated both by an upregulation of affinity for its ligand, ICAM-1, and by clustering at the immune synapse following TCR stimulation (reviewed in (8)). The cytoskeletal regulatory protein, talin, is an important positive regulator of both LFA-1 affinity and clustering in T cells. Binding of the talin FERM domain to the cytoplasmic tail of CD18 can increase integrin ligand affinity and the talin rod domain can promote integrin clustering (9). Talin-deficient T cells fail to conjugate normally due to impaired LFA-1 clustering at the immune synapse (9), (10). Other identified positive regulators of LFA-1 activity in T cells include ADAP (11), Rap1 ((12)), RAPL (13), (12), SKAP-55 (14) and Mst-1 ((15)) (reviewed in (16)). However, little is known about negative regulators of integrin activity in T cells.
Previous work in non-hematopoetic cells has shown that an extended isoform of phosphatidylinositol phosphate kinase type I gamma (PIPKIγ90) is an important modifier of talin-integrin interactions (17). PIPKIγ90 phosphorylates phosphatidylinositol 4 phosphate (PI(4)P) to generate PI(4,5)P2, which promotes talin-integrin interactions (18), actin dynamics and endocytosis, and can be further modified to form the signaling intermediates PI(3,4,5)P3, IP3 and diacylglycerol (DAG) (Reviewed in (19)). Several splice variants of PIPKIγ proteins, which all generate PI(4,5)P2 but differ in their subcellular localization, have been identified including a 635 amino acid (87 kDa) and a 661 amino acid (90 kDa) isoform (19). The 90 kDa isoform of PIPKIγ90 differs from other isoforms of PIP5K by a C-terminal extension capable of binding talin at the same site that talin uses to bind the cytoplasmic tail of beta integrins (20), (17). Given the importance of the 90 kDa isoform in regulating integrin activity during focal adhesion formation in fibroblasts (21),(22), we were interested in determining if PIPKIγ90 modulates LFA-1 activity in T cells.
No previous studies have specifically investigated the role of PIPKIγ90 in the context of T cell adhesion and activation. Recent studies investigating the function of PIPKIγ in natural killer (NK) cells (23), mast cells (24), and T cells (25) have depleted both PIPKIγ isoforms. This has clouded investigations into the relative contributions of the 87 and 90 kDa isoforms. Previous work has shown that the 87 kDa isoform is the primary PIPKIγ isoform responsible for generating PI(4,5)P2 that mediates calcium signaling downstream of G-protein coupled receptors (GPCRs) (26). Thus, recent findings showing that PIPKγ depletion in T cells decreases chemokine mediated adhesion to ICAM-1 are likely due to the depletion of the 87, but not the 90 kDa isoform (25). Supporting this idea is a recent report showing an essential role for PIPKIγ isoforms in target cell lysis by NK cells; however, they also demonstrate that loss of PIPKIγ results in a significant decrease in IP3 generation (23).
We previously reported that primary T cells express PIPKIγ90 and that it localizes to the T cell uropod (27). Here, we investigate the role that PIPKIγ90 plays in CD4+ T cell LFA-1-mediated adhesion and proliferation. Using mice that are specifically deficient in the PIPKγ 90 kDa isoform, we find that CD4+ T cell development is normal. However, cells from these mice have increased adhesion to ICAM-1 and increased T cell-APC conjugate formation. Immune synapses from PIPK90−/− CD4+ T cells show increased LFA-1 polarization, suggesting that PIPKIγ90 is a negative regulator of T cell adhesion and LFA-1 clustering. These increased rates of adhesion correspond to increased rates of proliferation and Th1 cytokine production in PIPKIγ90 −/− cells compared to wild type cells. Together, these findings suggest the PIPKIγ90 is a novel negative regulator of T cell activation, adhesion and proliferation.
Materials and Methods
Mice
PIPKIγ90 −/− mice were generated by deleting the exon encoding the talin-binding sequence (exon 17) of PIPKIγ90 and backcrossed onto a C57BL/6 background for 6 generations (Manuscript in Preparation). Knockout mice were crossed with mice expressing the OTII TCR Transgene that recognizes OVA peptide 223–230. All experiments used wild type and knockout siblings confirmed by DNA genotyping of tail clips with the following primers: Forward 5′ TACTAACTGCTTCCCGCTGCTGC 3′ Reverse 5′ TTCCTGGGTTTTCTGTGTCTTGTCG 3′ Annealing temp 60.2 C. OTII TCR Tg and C57/Bl6 mice were obtained from Jackson Labs. All experimental protocols involving the use of mice were approved by the Institutional Animal Care and Use Committee at the University of Wisconsin.
Reagents
For flow cytometry: PE anti-CD4, APC anti-CD4, PE anti-CD3, FITC anti-CD8, PE anti-CD62L, FITC anti-CD44, APC anti-CD69, PE anti-Beta 2, PE anti-Beta 1, FITC anti-alpha 4, PE anti-alpha L, PE IFN-γ, FITC IL-2, PE IL-10, FITC IL-4, APC B220, FITC CD11b and PE CD11c were all from Ebioscience. For immunoblotting: Talin (8d4) and actin were from Sigma. A PIPKIγ-specific antibody was obtained by immunizing rabbits against a KLH-conjugated peptide corresponding to amino acids 637–656 of the mouse PIPKIγ90 isoform (TDERSWVYSPLHYSARPASD).
Cell culture and retroviral transduction
Single cell suspensions of primary mouse T cells were made from lymph nodes and spleen from mice that were between 12 and 20 weeks of age. Following red blood cell lysis, mixed lymphocyte populations were resuspended in complete RPMI supplemented with 25 u/ml IL-2 (Chiron) and stimulated with OVA223–230 (Anaspec). OVA peptide expanded cells were used days 7 to 10 following isolation for antigen-dependent in vitro assays. Alternatively, CD4+ T cells were isolated from cell suspension by negative selection and automacs sorting (Miltenyi). Isolated CD4+ cells were stimulated 1:1 with anti-CD3/CD28 coated beads according to manufacturer’s instructions (Invitrogen) and maintained in RPMI supplemented with IL-2 (Chiron). Anti-CD3/CD28 bead activated cells were used days 7 to 10 following isolation for in vitro assays.
LB27.4 B cell were purchased from ATCC and maintained in RPMI complete media. Mouse D10 T cells and CH12 cells were maintained in culture as previously described (28). D10 cells were retrovirally transduced with PMX-GFP or PMX-GFP- PIPKIγ90 as described (27) and sorted for GFP expression using FACS.
RT PCR
RNA was isolated from anti-CD3/CD28 bead activated CD4+ T cells using Qiagen’s RNA-easy protect kit. PIPKIγ90 transcript was amplified using Qiagen’s one-step RT-PCR kit with the following primers: Forward 5′ GTGCACAACATCGATCAGCAGGA 3′ Reverse 5′ CTATAGTGAAGCGGGGAGTACAC 3′. PIPKIγ87 used the same forward primer as for 90 and the following reverse primer: 5′ GCTGCTCCGATGTATCTGAAGG 3′. GAPDH was amplified with the following primers: Forward 5′ GAGTCAACGGATTTGGTCGTAT 3′ Reverse 5′AGTCTTCTGGGTGGCAGTGAT 3′.
Immunoblotting
For immunoblotting, anti-CD3/CD28 bead activated CD4+ T cells were lysed in 50 mM Tris pH 7.6, 0.15 M NaCl, 0.1% SDS, 0.5% DOC, 1% NP-40 containing 0.2 mM PMSF, 1 ug/ml pepstatin, 2 ug/ml apoprotinin, 1 ug/ml apoprotinin, 1 ug/ml leupeptin and 1 mM sodium orthvanadate on ice and cleared by centrifugation. Protein concentration was determined by bicinchoninic acid protein assay kit (ThermoScientific), and equal concentrations of protein were added to SDS sample buffer, boiled and run on a 6–20% acrylamide gradient gel. Proteins were transferred to a nitrocellulose membrane and stained. Blots were imaged with an Odyssey infrared imaging system (Licor Biotechnologies).
Characterization of Leukocyte Subsets and Tissue Distribution
Single cell suspensions were made from blood, 2 inguinal and cervical lymph nodes, 3 Peyer’s patch lymph nodes and/or spleen from wild type and PIPKIγ90 −/− mice. Cells were counted using trypan blue exclusion, stained with antibodies as described and analyzed by flow cytometry to determine total cell and subset numbers.
Adhesion Assays
Adhesion assays were performed as previously described with minor modifications (9). Briefly, 96 well plates were coated with 3 ug/ml rmICAM-1 (R and D systems) and blocked with 1% BSA. Anti-CD3/CD28 bead activated CD4+ T cells were stained with 0.5 ug/ml Calcein AM (Invitrogen) and left untreated or stimulated with 0.5 ug/ml biotinylated anti-CD3 (Ebioscience) and streptavidin (Jackson labs), 20 ng/ml PMA (Sigma) or 10 uM MnCl2 (Sigma). Cells were allowed to adhere to plates for 25 minutes at 37 C and a prewash fluorescence emission measured on a VictorV3 plate reader (Perkin Elmer). Plate was washed by pipetting and post-wash fluorescence emission measured. Percent adhesion determined by Fluorescenceinitial-Fluorescence final/Fluorescenceinitial.
T Cell: APC Conjugation Assays
LB27.4 B cells were stained with 2.5 uM PKH-26 (Sigma) in 5% dextrose according to manufacturer’s instructions and left untreated or loaded with 2.5 ug/ml OVA peptide for 30 minutes at 37C. OVA peptide expanded CD4+ T cells were stained with 0.5 ug/ml Calcein AM (Invitrogen). Both cell types were resuspended in Hank’s Buffered Salt Solution (Mediatech) supplemented with 2 mg/ml BSA (Sigma) and 1 mM Hepes (Mediatech). Equal numbers were combined on ice and centrifuged at 0.6 RCF for 5 minutes. D10 cells overexpressing GFP or PIPKIγ90 were co-incubated with CH12 cells cultured for 18 hours +/− 250 ug/ml conalbumin (Sigma) and stained as above. Pellets were incubated at 37 C for indicated times prior to vortexing to dissociate non-specific conjugates. Conjugates were analyzed using a FACS Caliber (BD Bioscience), and the percent conjugate formation determined by the % double positive cells divided by the sum of % double positive and single positives.
Immunofluorescence
LB27.4 B cells were stained with 1 uM CMAC (Invitrogen) according to manufacturer’s directions and pulsed with 2.5 ug/ml OVA peptide for 30 minute at 37 C. CH12 cells were loaded for 18 hours with 250 ug/ml conalbumin and stained with 1 uM CMAC. Equal numbers of T cells and B cells in RPMI were combined, centrifuged and incubated at 37 C for 30 minutes prior to resuspension in PBS and pulse vortexing. Cells were allowed to adhere to poly-l-lysine (Sigma) coated coverslips for 5 minutes prior to fixing with 3% paraformaldehyde (Electron Microscopsy Services) for 15 minutes. Cells were permeabilized with 0.2% Triton X-100 and blocked in goat serum. Cells were stained with anti-PKC-theta (Santa Cruz), anti-LFA-1 (M17/4) (Ebioscience), and rhodamine phallodin (Invitrogen) along with FITC/TRITC conjugated anti-rat or FITC conjugated anti-rabbit secondary antibodies (Jackson Labs). Images were acquired on a laser scanning confocal microscope (Olympus) using a 60X Plan Apo/1.45 oil immersion objective with a 1X or 10x zoom factor and captured into Fluoview software (FV10-ASW version 01.07; Olympus).
Calcium Flux
Calcium flux was performed essentially as described previously (29). Briefly, CD4+ T cells were stained with 10 uM Indo-1 in PBS for 30 minutes and washed in complete RPMI. Cells were coated with biotinylated anti-CD3 (2C11) (Ebioscience) for 10 minutes on ice and a baseline reading of fluorescence at 495 and 450 acquired on the LSRII flow cytometer (BD Bioscience) for 45 seconds. Streptavidin (Jackson Labs) was added and fluorescence measured for an additional 5 minutes. The ratio of fluorescence at 405 and 495 was analyzed by FlowJo (Tree Star).
Live Imaging
Live imaging of T cell:APC interactions was done using methods adapted from previous studies (30). CH12 antigen presenting cells were loaded overnight with 250 ug/ml conalbumin. The following day, CH12 cells were labeled with 2.5 uM PKH-26 and allowed to adhere to the bottom of a poly-l-lysine (Sigma) coated glass bottom plate. D10 T cells resuspended in Hanks Buffered Salt Solution (Mediatech), supplemented with 1 mM Hepes (Mediatech), 10% FBS (HyClone) and 0.25% low melt agarose (Fisher), were plated on APC and overlayed with 1 ml of mineral oil (Sigma). Cells were maintained at 37 C for the duration of acquisition. Confocal images of GFP-PIPK localization were obtained using a laser scanning confocal microscope (Olympus) using a 60X Plan Apo/1.45 oil immersion objective with 1 image every 2 minutes. Long-term conjugation was measured using an epifluorescent microscope (Nikon) and a Coolsnap ES2 camera (Photometrics). 1 bright field image was acquired every 2 minutes and a fluorescent image every eight minutes for 5 hours. Images were acquired using MetaMorph Imaging software (MDS Analytical Technologies). Duration of conjugation was calculated as the time from initial T cell:APC contact to reformation of a T cell uropod.
In vitro proliferation
OVA peptide expanded CD4+ T cells were stained with 0.25 uM CFSE (Invitrogen) according to manufacturer’s directions. Cells were left unstimulated or stimulated with 1 anti-CD3/CD28 coated bead (Invitrogen) per cell, 5 ng/ml PMA and 0.5 ug/ml ionomycin (Sigma). Additionally, CD4+ T cells were stimulated with irradiated splenocytes (3000 gy) loaded with 0, 0.1 or 1 ug/ml OVA peptide. 72 hours following activation, cells were stained with anti-CD4 and CFSE dye dilution in CD4+ T cells analyzed using a FACS Caliber (BD Bioscience). Percentage of cells per division and proliferative index were determined using ModFit 3.2.1 (Verity) analysis program.
In vivo proliferation was performed essentially as described (7). Briefly, CD4+ cells from wild type and knockout mice were isolated by CD4+ negative selection and stained with 2.5 uM CFSE (Invitrogen). 5 million cells were injected intravenously into age/sex matched recipient mice. 18 hour later, 25 ug LPS (Sigma) or 25 ug LPS and 50 ug ovalbumin (Sigma) was injected intraperitoneally. 72 hours later, mice were sacrificed and splenocytes isolated and stained for CD4. The degree of CFSE dye dilution was determined for CD4+ T cells on a FACS Caliber (BD Bioscience).
Th1/Th2 cytokine production
1.5X10^6 OVA peptide expanded T cells were restimulated on days 7 to 10 following isolation on 24 well plates coated with 1 ug/ml anti-CD3 (2C11) (Biolegend) along with 2 ug/ml soluble anti-CD28 (Ebioscience) in the presence of Brefeldin A (Ebioscience). Four hours following restimulation, cells were stained with anti-CD4 and fixed with 4% paraformaldehyde (Electron Microscopsy Services). Intracellular staining was performed essentially as described (31). Briefly, cells were permeabilized in PBS supplemented with 0.1% saponin (Alfa Aesar), 2% FBS (Hyclone) and 0.01% sodium azide (Sigma), blocked with CD32/16 (Ebioscience) and stained with PE IFN-γ, FITC IL-2, PE IL-10, FITC IL-4 (Ebioscience). The percentage of CD4+ T cells producing cytokines was determined by flow cytometry using a FACS Calibur (BD Bioscience) and analyzed using FlowJo (Tree Star).
Statistical Analyses
Statistical analyses were performed using Prism 4 software (GraphPad Software Inc). Two tailed paired T-test or one-way analysis of variance (ANOVA) with Tukey post-test was used with P<0.05 considered statistically significant.
Results
CD4+ T cells from PIPKIγ90 −/− mice develop normally
We previously identified PIPKIγ90 as a novel component of the T cell uropod (27). To determine if PIPKIγ90 regulates T cell function, we characterized CD4+ T cells from PIPKIγ90-deficient mice. PIPKIγ90−/− mice were generated by deleting the PIPKIγ exon encoding the talin-binding sequence (exon 17) (manuscript in preparation). These mice were crossed onto the OTII TCR transgenic line, which recognizes OVA223–230. We found that PIPKIγ90−/− mice and wild type mice had similar numbers of T cells, B cells, dendritic cells and myeloid cells in the blood, spleen and Peyer’s patches (Supplementary Table 1). While there was a trend towards fewer cells in the peripheral lymph nodes of knockout mice compared to control, this difference was due to fewer B cells and dendritic cells, not T cells, suggesting that T cell development and distribution remain intact in PIPKIγ90−/− mice (Supplementary Table 1).
CD4+ T cells from PIPKIγ90 −/− mice, as compared to T cells from wild type littermate controls, specifically lacked expression of the 90 kDa isoform of PIPKIγ by both RT-PCR and immunoblotting using isoform-specific antibodies (Figure 1). T cells from PIPKIγ90-deficient mice had similar surface expression of CD3, CD4 and CD8 on cells from the thymus, spleen and peripheral lymph nodes (Figure 2A). Further analysis of CD4+ subsets also showed similar expression of CD62L and CD44 (Figure 2B), indicating that T cells from PIPKIγ90-deficient mice develop normally. We observed an increase in CD69, but not CD25, expression in CD4+ T cells from PIPKIγ90-deficient mice compared to wild type mice suggesting an increase in T cell activation in both lymph node and splenic populations (Figure 2C and D). Importantly, while loss of the 87 kDa isoform has been reported to result in calcium signaling defects in fibroblasts (26), T cells lacking the 90 kDa isoform demonstrated no defects in calcium signaling in response to TCR cross linking (Figure 2E). Taken together, the findings suggest that PIPKIγ90 is not required for T cell development in vivo.
Figure 1. T cells from PIPKIγ90 −/− mice are deficient in the PIPKIγ90 but not the PIPKIγ87 isoform.

A) Schematic showing the two isoforms of PIPK expressed in T cells. PIPKIγ87 and PIPKIγ90 differ by the presence of a talin binding 26 amino acid C-terminal domain. B) RT-PCR indicates the presence of PIPKIγ87 but not PIPKIγ90 in knockout T cells C) Immunoblotting shows loss of PIPKIγ90 expression in knockout T cells.
Figure 2. CD4+ T cells from PIPKIγ90 −/− mice develop normally and exhibit normal calcium responses following TCR stimulation.

Cells from lymph nodes and spleen of wild type and PIPKIγ90 −/− mice were stained with: A) CD3, CD4 and CD8 antibodies and expression of CD3+ subsets are shown. Results are representative of 3 independent experiments and 4 mice. B) CD4, CD62L and CD44 antibodies and CD4+ subsets are shown. Plot is representative of 2 independent experiments with 3 mice. C and D) CD4, CD25 and CD69 antibodies. Graphs represent normalized CD25 and CD69 fluorescent intensity +/− SEM of CD4+ cells from lymph nodes (C) and spleen (D) from 2 independent experiments with 3 mice. *=p<0.05. E) CD4+ T cells loaded with Indo-1 were coated with biotinylated anti-CD3. After acquiring baseline ratio of bound:unbound calcium, streptavadin was added to induce TCR crosslinking and change in the ratio of 405 to 495 was measured. Plot is representative of 3 independent experiments.
CD4+ T cells from PIPKIγ90 −/− mice have increased adhesion to ICAM-1 and T Cell:APC conjugate formation
Previous studies have shown that PIPKIγ90 can bind to the talin FERM domain at a position overlapping with talin’s primary integrin binding site and can impair integrin activation (17), (20). In addition, it was recently reported that T cells deficient in both the 87 and 90 kDa isoforms of PIPKIγ have impaired chemokine-mediated adhesion to ICAM-1 (25). To determine how the PIPKIγ90 isoform specifically regulates LFA-1-mediated adhesion, we assayed adhesion of PIPKIγ90-deficient T cells on plate-bound ICAM-1. Although there were no differences in basal levels of adhesion to ICAM-1, we observed a significant increase in TCR-induced adhesion of PIPKIγ90−/− CD4+ T cells to ICAM-1 compared to control cells (Figure 3A), suggesting that PIPKIγ90 is a negative regulator of T cell LFA-1-mediated adhesion induced by TCR stimulation. Furthermore, we found that the defect in adhesion was not present when T cells were stimulated with either MnCl2 or PMA, suggesting that PIPKIγ90 specifically regulates LFA-1 adhesion in response to TCR ligation. To determine if antigen-induced T cell-APC conjugation was also altered in PIPKIγ90-deficient T cells, we examined conjugate formation to OVA223–230 loaded LB27.4 B cells. Using a flow cytometry based conjugation assay, we found that depletion of PIPKIγ90 resulted in a 20% increase in T cell-APC conjugate formation following 2, 5 and 10 minutes of contact (Figure 3B). Taken together, these findings suggest that PIPKIγ90 negatively regulates both TCR-induced ICAM-1 adhesion and T cell-APC interactions.
Figure 3. PIPKIγ90 −/− CD4+ T cells exhibit increased adhesion to ICAM-1 and increased conjugation to APC.

a) Anti-CD3/28 bead activated CD4+ T cells were fluorescently labeled and adhered to ICAM-1 coated plates untreated or following stimulation with anti-CD3 crosslinking, PMA or MnCl2. Following washing step, the percentage of cells adherent to the plate was determined. Results are averages from 3 independent experiments +/− SEM. #=p<0.01 compared to wild type anti-CD3 treated. B) OVA peptide expanded CD4+ T cells were calcein labeled and incubated with PKH-26 labeled LB27.4 cells +/− 2.5 ug/ml OVA peptide for the indicated times. Non-specific conjugates were dissociated by vortexing and the percentage of OVA-dependent conjugation determined by flow cytometry. Results are averages from 5 independent experiments +/− SEM *=p<0.05 **=p<0.0001 compared to wild type.
PIPKIγ90 −/− T cell-APC conjugates have increased LFA-1 polarization at the immune synapse but no differences in integrin surface expression
Previous work has shown that depletion of talin results in impaired LFA-1, but not actin, polarization to the immune synapse suggesting that talin is required for LFA-1 clustering at the immune synapse (9). To determine if LFA-1 polarization is altered in PIPKIγ90-deficient T cells, we examined polarization of protein kinase C (PKC)-theta, LFA-1 and actin in T cell-APC conjugates in CD4+ T cells from wild type and PIPKIγ90−/− mice. We found that LFA-1, actin and PKC-theta polarize to the immune synapse in both wild type and knockout cells (Figure 4A and B). Interestingly, we observed an increase in LFA-1 polarization at the T cell-APC contact site in PIPKIγ90-deficient T cells as compared to control (Figure 4C). Using line scans of fluorescent intensity through the immune synapse of fixed conjugates, we found no difference in polarized actin fluorescence intensity between wild type and PIPKIγ90−/− conjugates (Figure 4C and E). However, there was a 25% increase in peak LFA-1 fluorescence intensity at the immune synapse in PIPKIγ90−/− conjugates compared to control (Figure 4C and D). This increase in LFA-1 fluorescence intensity was not caused by an increase in LFA-1 surface expression, since flow cytometry analysis of surface integrins indicated no difference in integrin expression between PIPKIγ90−/− and wild type CD4+ T cells (Figure 4F). Together, these data suggest that PIPKIγ90 negatively regulates LFA-1 clustering at the immune synapse and its absence potentially contributes to the observed increase in T cell-APC conjugate formation.
Figure 4. PIPKIγ90 −/− CD4+ T cells have increased LFA-1 polarization compared to wild type control cells.

OVA peptide expanded CD4+ T cells were allowed to interact with OVA peptide loaded LB27.4 cells for 15 minutes. Conjugates were then fixed and stained with anti-LFA-1 and PKC-theta (A) or with anti-LFA-1 and rhodamine phallodine (B). C) We observed increased LFA-1 polarization in PIPKIγ90 −/− CD4+ T cells compared to wild type cells. Scale bars, 5 um. All images are representative of at least 50 conjugates observed from 3 experiments. D) Quantification of LFA-1 fluorescence intensity around the immune synapse. 0 um corresponds to region of peak LFA-1 intensity at the immune synapse. E) Quantification of rhodamine phalloidin fluorescence intensity around the immune synapse. D and E: Data are averages +/− SEM from at least 30 cells from 2 independent experiments. *=p<0.05, **=P<0.01. F) Flow cytometry analysis of surface integrin expression in wild type and PIPKIγ90−/− OVA peptide expanded CD4+ T cells. Plots are representative of 4 independent experiments.
Ectopic expression of PIPKIγ90 impairs T Cell-APC contact duration in D10 T cells
To further characterize how PIPKIγ90 expression affects T cell-APC conjugate formation, we ectopically expressed wild type GFP-PIPKIγ90 in D10 T cells and examined PIPKIγ90 localization and conjugation with CH12 APC loaded with conalbumin. The advantage of this system is that it is amenable to live imaging of GFP-PIPKIγ90 dynamics in T cells contacting APC. In accordance with our findings indicating that PIPKIγ90 negatively regulates T cell-APC interactions, we found that ectopic expression of PIPKIγ90 impaired T cell-APC conjugate formation at early time points by flow cytometry (Figure 5C).
Figure 5. Overexpression of PIPKIγ90 impairs T cell conjugation and decreases duration of T cell-APC contact.

A) D10 T cells overexpressing GFP-PIPKIγ90 or PIPKIγ87 were fixed and stained with anti-LFA-1 antibodies following conjugation to conalbumin loaded CH12 cells (represented by star). Scale bar represents 5um. Images are representative of over 60 conjugates observed in 4 independent experiments. B) Quantification of GFP polarization in T cells overexpressing GFP-PIPKIγ90 or PIPKIγ87. Percentage of conjugates with polarized GFP was determined by blinded observation of over 60 conjugates from 4 independent experiments. *=P<0.05 C) D10 T cells overexpressing GFP or PIPKIγ90 were allowed to interact with PKH-26 labeled CH12 cells +/− conalbumin for 2 minutes prior to dissociation of non-specific conjugates. Percentage of antigen dependent conjugates was determined by flow cytometry. Data are mean +/− SEM from 3 independent experiments. *=P<0.05. D and E) Time-lapse microscopy of GFP-PIPKIγ90 overexpressing cells with PKH26 labeled APC. Scale bar represents 10 um. D) PIPKIγ90 is redistributed from the uropod following T cell-APC contact. E) PIPKIγ90 reestablishes uropod localization following conjugation. Images from C and D are representative of over 10 conjugation events observed in 4 independent experiments. F) Quantification of T-cell-APC duration in T cells overexpressing GFP or GFP PIPKIγ90. Data represent means +/− SEM from 4 independent experiments of at least 10 conjugation events. *=P<0.01.
Previous studies have demonstrated that talin concentrates at the immune synapse (1), (9). To determine if PIPKIγ90 also localizes to the immune synapse, we examined localization of GFP-PIPKIγ90 in T cell-APC conjugates by immunofluorescence. While LFA-1 localized to the T cell-APC contact site, GFP- PIPKIγ90 showed a diffuse localization at the membrane without specific concentration at the immune synapse (Figure 5A and B). In contrast, we found that GFP-PIPKIγ87 concentrated at the T cell-APC contact site and co-localized with LFA-1 (Figure 5A and B). These findings suggest that PIPKIγ90 and PIPKIγ87 have distinct intracellular distributions in T cell-APC conjugates.
To further characterize the dynamics of GFP-PIPKIγ90 in T cell-APC conjugates, live time-lapse fluorescent imaging was performed. Using live cell imaging, we found that GFP-PIPKIγ90 localized to the uropod of motile T cells not in contact with APC (27). Interestingly, upon contact with antigen loaded CH12 cells, PIPKIγ90’s uropod localization was lost, and GFP-PIPKIγ90 became diffusely localized at the cell membrane (Figure 5A and Supplemental Movie 1). Quantification of T cell-APC contact times showed a reduction in conjugation duration from around 4 hours in control cells expressing GFP alone to less than 1.5 hours in cells expressing GFP-PIPKIγ90 (Figure 5B), providing further evidence that PIPKIγ90 negatively regulates T cell-APC interactions. Further analysis of the live cell imaging revealed that PIPKIγ90 reestablishes uropod localization prior to T cell migration away from the APC, suggesting that PIPKIγ90 may play a role in release of T cell-APC interactions (Figure 5A and C).
PIPKIγ90 −/− CD4+ T cells exhibit increased proliferation in vitro and in vivo
Previous studies have reported that increased duration of T cell-APC interactions can result in increased rates of proliferation both in vitro and in vivo (3), (4), (5). To determine if altered conjugation duration is associated with increased proliferation of PIPKIγ90-deficient T cells, T cell proliferation was characterized both in vitro and in vivo. Following CFSE labeling of CD4+ T cells from wild type and PIPKIγ90 −/− mice, we stimulated cells with anti-CD3/CD28 coated beads or PMA and ionomycin (Figure 6A). Each cell division corresponds to a 50% decrease in CFSE intensity and the percentage of CD4+ T cells that had undergone anywhere from 0 to 6 cell divisions was calculated. We found that PIPKIγ90 −/− CD4+ T cells proliferated more than wild type cells to both anti-CD3/CD28 coated beads and PMA/ionomycin stimulation. Indeed, the proliferative index of PIPKIγ90−/− cells was 50% greater than that for wild type cells. To determine if altered T cell proliferation was also observed with specific antigen, CD4+ T cells from OTII+ wild type and PIPKIγ90 −/− mice were stimulated with irradiated splenocytes and varying concentrations of OVA peptide (0, 0.1 and 1 ug/ml). Similar to our bead and PMA/ionomycin stimulation, we found that CD4+ T cells from PIPKIγ90 −/− mice proliferate more than wild type cells (Supplemental Figure 1).
Figure 6. PIPKIγ90 −/− CD4+ T cells exhibit increased proliferation in response to CD3/CD28 coated beads and PMA/Ionomycin.
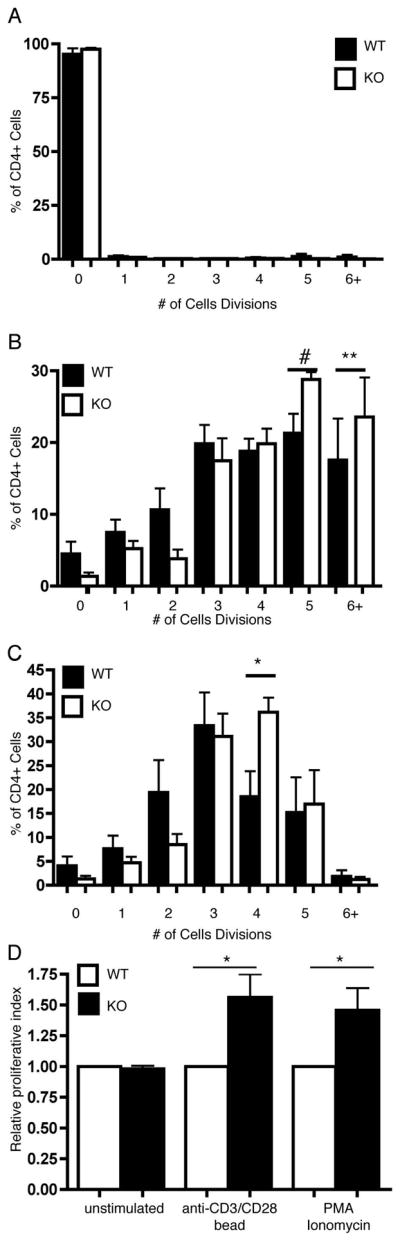
OVA peptide expanded CD4+ cells were stained with 0.25 uM CFSE and left unstimulated (a) or stimulated with anti-CD3/CD28 coated beads (B) or PMA/Ionomycin (c). CFSE dilution was measured 72 hours following stimulation. The % of cells in each cell division and proliferative index were determined by ModFIT analysis. D) Normalized proliferative index from 5 independent experiments. Data represent averages +/− SEM from 5 independent experiments *=p<0.05, **=p<0.01. #=P=0.065
Finally, to determine if proliferation was also altered in vivo, we injected mice with CFSE labeled CD4+ wild type and PIPKIγ90 −/− T cells. Eighteen hours later, mice were injected intraperitoneally with LPS alone or LPS and ovalbumin. Spleens were isolated 72 hours following injection, and CD4+ T cells were analyzed for CFSE dilution by flow cytometry. Consistent with our in vitro studies, we observed about a 2-fold increase in proliferation of PIPKIγ90 −/− cells compared to wild type cells in vivo (Figure 7). Taken together, these findings indicate that PIPKIγ90 negatively regulates T cell activation both in vitro and in vivo.
Figure 7. PIPKIγ90 −/− CD4+ T cells exhibit increased proliferation in vivo.

Naïve CD4+ T cells from wild type and PIPKIγ90 −/− mice were labeled with 2.5 uM CFSE and injected intravenously into age/sex matched recipients. 18 hours later, mice were given an IP injection of 25 ug LPS (A) or 25 ug LPS and 50 ug ovalbumin(B). 72 hours later, CFSE dilution was measured in CD4+ T cells by flow cytometry and proliferative index (C) determined by ModFit analysis. Data are representative of 2 independent experiments involving 3 wild type and knockout mice per condition.
PIPKIγ90 −/− CD4+ T cells exhibit increased IFN-γ and IL-2 production
Since we observed increased CD4+ T cell proliferation in PIPKIγ90 deficient mice, we wanted to determine if PIPKIγ90 also negatively regulated cytokine production in vitro. To investigate this, control and PIPKIγ90 deficient CD4+ T cells were activated in vitro with OVA peptide. Seven days following activation, cells were restimulated for four hours with anti-CD3 and CD28 in the presence of Brefeldin A, and cytokine production was assessed by intracellular staining and flow cytometry. While unstimulated CD4+ cells did not have a measureable cytokine response (data not shown), we found that CD4+ T cells from both wild type and knockout mice produced Th1 cytokines (Figure 8A and B). Interestingly, there were nearly twice as many IFN-γ and 50% more IL-2 producing PIPKIγ90−/− CD4+ cells compared to control cells, suggesting that PIPKIγ90 negatively regulates Th1 cytokine production.
Figure 8. PIPKIγ90 −/− CD4+ T cells have increased Th1 cytokine production in vitro.

A and B) OVA peptide expanded CD4+ cells were restimulated on day 7–10 post isolation with plate bound anti-CD3 and soluble CD28 in the presence of brefeldin A. Four hours later, cells were stained with anti-CD4, fixed, permeabilized, stained with antibodies to IFN-γ and IL-4 (A) or IL-2 and IL-10 (B), and analyzed by flow cytometry. Results are representative of 3 independent experiments with cells from 3 wild type and knockout mice. C and D) Normalized IFN-γ (C) and IL-2 (D) producing CD4+ cells +/− SEM from three independent experiments.
Discussion
Appropriate activation of the integrin LFA-1 is critical for establishing and maintaining T cell-APC interactions and generating T cell immune responses. Previous studies have demonstrated that altered LFA-1-mediated adhesion is associated with impaired immune responses and has significant pathological consequences ((32), (7)). Several positive regulators of LFA-1 activation downstream of TCR signaling have been identified, including Rap1, RapL, Skap55, Mst1 and talin. Depletion of these signaling components results in defects in LFA-1 polarization toward the immune synapse (Reviewed in (16)). While activation of LFA-1 is required for generation of immune responses, its deactivation is also necessary (33). Factors involved in the negative regulation of LFA-1-mediated adhesion in T cells are largely unknown. Most negative regulators of T cell activation, including surface receptors CTLA-4, PD-1 and CD5, influence proximal TCR signaling pathways and interfere with TCR signal transduction (Reviewed in (34)). This is the first study to identify PIPKIγ90 as a novel negative regulator of T cell activation that affects LFA-1 polarization and adhesion induced by TCR ligation.
Previous studies have demonstrated that the PIPKIγ87 isoform is necessary for LFA-1-mediated adhesion induced by chemokines (25). In contrast, we show that PIPKIγ90 impairs TCR-induced LFA-1 adhesion, suggesting that the two isoforms may have opposing functions in regulating T cell adhesion. We show that depletion of PIPKIγ90 enhances T cell LFA-1 adhesion to ICAM-1 and T cell-APC interactions, while overexpression of PIPKIγ90 impairs duration of T cell-APC interactions. The opposing roles of the two PIPKIγ isoforms is especially intriguing since the two isoforms differ by only 26 amino acids in the C-terminus. It is possible that these opposing functions are caused by the distinct intracellular distributions of the two isoforms. PIPKIγ90 localizes to the T cell uropod and is not polarized at the immune synapse. In contrast, PIPKIγ87 is not a uropod component in motile T cells (27) but colocalizes with LFA-1 at the immune synapse (Figure 5).
There have been several interacting proteins identified that specifically bind to the C-terminal 26 amino acids of PIPKIγ90, including talin. It is possible that the association of PIPKIγ90 with talin contributes to its negative regulation of LFA-1 adhesion and polarization to the synapse. An attractive hypothesis is that PIPKIγ90 binds talin and sequesters it away from the synapse thereby negatively regulating LFA-1 clustering at the immune synapse. Unfortunately, poor antibody staining and the large size of talin prohibited us from testing this directly. However, we observed increased LFA-1 polarization at the T cell-APC contact site in PIPKIγ90-deficient T cells. Alternatively, the C-terminal tail of PIPKIγ90 also interacts with other binding partners that may affect T cell-APC interactions and LFA-1 function. For example, previous work has supported a role for PIPKIγ90 as a key regulator of clathrin mediated endocytosis both through its generation of PI(4,5)P2 and its association with endocytic protein AP2 (35), (36), (37), (38). While it is possible that PIPKIγ90 influences T cell conjugation and proliferation by affecting endocytosis and internalization of the TCR or LFA-1, the finding that hyperproliferation is observed with PMA and ionomycin stimulation argues against the possibility that PI(4,5)P2 generation by PIPKIγ90 is solely responsible for the adhesion and proliferation defects observed with PIPKIγ90-deficient T cells.
Live imaging of GFP-PIPKIγ90 dynamics in motile T cells support the hypothesis that PIPKIγ90 localization to the uropod may sequester key components that mediate T cell-APC contact. We found that PIPKIγ90 was predominantly at the uropod in motile T cells and that with T cell-APC contact became diffusely localized to the membrane. Prior to cessation of T cell-APC contact, we noted an early relocalization of PIPKIγ90 back to the uropod and the subsequent migration of T cells away from the APC. These findings support the intriguing possibility that PIPKIγ90 may negatively regulate T cell-APC contacts and T cell proliferation by sequestering interacting proteins, such as talin, away from the synapse thereby promoting release of T cell-APC contact. Interestingly, other T cell uropod components, such as CD43, when depleted, are also associated with increased T cell adhesion and proliferation, suggesting that the uropod may in part function to negatively regulate T cell-APC contact and activation, although the mechanisms by which this occurs may be distinct (39), (40), (41). Taken together, these findings suggest that uropod components may potentially contribute to release of T cell-APC interactions and serve as negative regulators of T cell activation.
Maintenance of T cell-APC interactions is critical for subsequent T cell proliferation with increased duration of conjugation directly correlated with increased proliferation (4), (5). Previous reports have shown that continuous calcium flux and PI(3,4,5)P3 signaling are necessary for maintenance of T cell-APC interactions and T cell proliferation ((4, 42). Here we found, that in contrast to reports of PIPKIγ87 (26), PIPKIγ90 has no effect on TCR-induced calcium flux. We also found that PIPKIγ90 negatively regulates T cell proliferation since T cell proliferation was significantly increased in PIPKIγ90-deficient T cells both in vitro and in vivo. Although, we do not know how PIPKIγ87 affects T cell proliferation, its reported role in calcium flux suggests that it may be required for proper T cell activation by antigen.
In summary, our findings indicate that PIPKIγ90 is working downstream of proximal TCR signaling to negatively regulate T cell LFA-1 adhesion and proliferation. Our findings raise the possibility that PIPKIγ90 may negatively regulate T cell activation by affecting T cell uropod formation and the localization or activation of interacting partners including talin. A challenge for future investigation will be to identify the key binding partners that mediate PIPKIγ90 localization at the uropod and play a role in its inhibitory function during T cell activation. It will also be interesting to determine if expression of PIPKIγ90 alters susceptibility to the development of autoimmunity in animal models. It is intriguing to speculate that PIPKIγ90 may be an important downstream molecule responsible for down regulating T cell activation in response to self-antigens. While there is no evidence of systemic autoimmunity in PIPKIγ90−/− mice to date, several known negative regulators of TCR signaling also show no signs of systemic autoimmunity (reviewed in (34). Future investigations will be focused on challenging PIPKIγ90 −/− mice to determine how PIPKIγ90 expression affects susceptibility to autoimmunity in animals, including models of diabetes and EAE.
Supplementary Material
Supplemental Figure 1: PIPKIγ90 −/− CD4+ T cells exhibit increased proliferation in response to antigen stimulation.
OVA peptide expanded CD4+ cells were stained with 0.25 uM CFSE and combined with irradiated splenocytes with 0 ug/ml (A), 0.1 ug/ml (B) or 1 ug/ml OVA peptide (C). CFSE dilution was measured 72 hours following stimulation. The % of cells in each cell division was determined by ModFIT analysis. Data represent averages +/− SEM from 3 independent experiments *=p<0.05.
Supplemental Movie 1: GFP PIPKIγ90 establishes diffuse membrane localization during T-cell:APC conjugation
D10 T cells overexpressing GFP-PIPKIγ90 were imaged while interacting with conalbumin loaded CH12 cells. White arrow: GFP-PIPKIγ90 reestablishes uropod localization following conjugation with antigen-loaded CH12 cells (red). Green Arrow: GFP-PIPKIγ90 establishes a diffuse membrane localization following contact with antigen-loaded CH12 cell (red).
Table 1.
Leukocyte populations in PIPKIγ90−/− mice
| Tissue and Cell Populations | Number of Cells (106) 1,2 | P value3 | |
|---|---|---|---|
| Wild type | PIPKIγ90−/− | ||
| Lymph Nodes | |||
| Total | 8.4 ± 0.9 | 5.6 ± 1.3 | |
| CD3+ | 4.3 ± 0.7 | 3.14 ± 0.7 | |
| CD4+ | 2.8 ± 0.6 | 2.1 ± 0.5 | |
| CD8+ | 1.2 ± 0.1 | 0.9 ± 0.2 | |
| B220+ | 2.1 ± 0.2 | 1.3 ± 0.4 | P<0.1 |
| CD11c+ | 0.7 ± 0.01 | 0.3 ± 0.1 | P<0.05 |
| CD11b+ | 0.02 ± 0.01 | 0.01 ± 0.01 | |
| Peyer’s Patches | |||
| Total | 8.9 ± 0.3 | 8.7 ± 1.6 | |
| CD3+ | 1.5 ± 0.5 | 1.9 ± 0.7 | |
| CD4+ | 1.2 ± 0.5 | 1.6 ± 0.7 | |
| CD8+ | 0.3 ± 0.02 | 0.2 ± 0.03 | |
| B220+ | 3.7 ± 0.5 | 3.5 ± 1.2 | |
| CD11c+ | 0.7 ± 0.1 | 0.6 ± 0.2 | |
| CD11b+ | 0.07 ± 0.06 | 0.02 ± 0.02 | |
| Spleen | |||
| Total | 103 ± 6.9 | 110 ± 2.4 | |
| CD3+ | 33 ± 1.2 | 32 ± 8.5 | |
| CD4+ | 20 ± 1.1 | 20 ± 6 | |
| CD8+ | 11 ± 0.5 | 10 ± 2.3 | |
| B220+ | 38 ± 0.5 | 45 ± 9.7 | |
| CD11c+ | 16 ± 4.4 | 14 ± 3.6 | |
| CD11b+ | 0.2 ± 0.09 | 0.9 ± 0.8 | |
| Blood | |||
| Total | 3.8 ± 0.9 | 5.6 ± 1.9 | |
| CD3+ | 0.8 ± 0.09 | 0.7 ± 0.3 | |
| CD4+ | 0.5 ± 0.09 | 0.4 ± 0.2 | |
| CD8+ | 0.3 ± 0.03 | 0.3 ± 0.1 | |
| B220+ | 1.5 ± 0.4 | 2.7 ± 1.2 | |
| CD11c+ | 0.2 ± 0.1 | 0.3 ± 0.07 | |
| CD11b+ | 0.2 ± 0.08 | 0.3 ± 0.04 | |
Cells from 2 inguinal and 2 cervical lymph nodes (Lymph Nodes), 3 Peyer’s patches, spleen and blood were isolated from three, 5 month old knockout and littermate control OTII positive mice. Cell populations were determined by flow cytometry. Data are mean +/− SEM.
For blood populations, units are cells per milliliter of blood
Probability was calculated using Students ’ T test.
Acknowledgments
We appreciate the technical assistance of Lisa Fox, Subbe Hegde and the University of Wisconsin Paul P Carbone Comprehensive Cancer Center Flow Cyotmetry Facility.
Footnotes
This work was supported by the National Institutes of Health Grant R01 CA085862 and NIH NIAID R01 AI068062 to A.H.
Publisher's Disclaimer: This is an author-produced version of a manuscript accepted for publication in The Journal of Immunology (The JI). The American Association of Immunologists, Inc. (AAI), publisher of The JI, holds the copyright to this manuscript. This version of the manuscript has not yet been copyedited or subjected to editorial proofreading by The JI; hence, it may differ from the final version published in The JI (online and in print). AAI (The JI) is not liable for errors or omissions in this author-produced version of the manuscript or in any version derived from it by the U.S. National Institutes of Health or any other third party. The final, citable version of record can be found at www.jimmunol.org.
References
- 1.Monks CR, Freiberg BA, Kupfer H, Sciaky N, Kupfer A. Three-dimensional segregation of supramolecular activation clusters in T cells. Nature. 1998;395:82–86. doi: 10.1038/25764. [DOI] [PubMed] [Google Scholar]
- 2.Mempel TR, Henrickson SE, Von Andrian UH. T-cell priming by dendritic cells in lymph nodes occurs in three distinct phases. Nature. 2004;427:154–159. doi: 10.1038/nature02238. [DOI] [PubMed] [Google Scholar]
- 3.Iezzi G, Karjalainen K, Lanzavecchia A. The duration of antigenic stimulation determines the fate of naive and effector T cells. Immunity. 1998;8:89–95. doi: 10.1016/s1074-7613(00)80461-6. [DOI] [PubMed] [Google Scholar]
- 4.Huppa JB, Gleimer M, Sumen C, Davis MM. Continuous T cell receptor signaling required for synapse maintenance and full effector potential. Nat Immunol. 2003;4:749–755. doi: 10.1038/ni951. [DOI] [PubMed] [Google Scholar]
- 5.Celli S, Lemaitre F, Bousso P. Real-time manipulation of T cell-dendritic cell interactions in vivo reveals the importance of prolonged contacts for CD4+ T cell activation. Immunity. 2007;27:625–634. doi: 10.1016/j.immuni.2007.08.018. [DOI] [PubMed] [Google Scholar]
- 6.Krensky AM, Sanchez-Madrid F, Robbins E, Nagy JA, Springer TA, Burakoff SJ. The functional significance, distribution, and structure of LFA-1, LFA-2, and LFA-3: cell surface antigens associated with CTL-target interactions. J Immunol. 1983;131:611–616. [PubMed] [Google Scholar]
- 7.Kandula S, Abraham C. LFA-1 on CD4+ T cells is required for optimal antigen-dependent activation in vivo. J Immunol. 2004;173:4443–4451. doi: 10.4049/jimmunol.173.7.4443. [DOI] [PubMed] [Google Scholar]
- 8.Kinashi T. Intracellular signalling controlling integrin activation in lymphocytes. Nat Rev Immunol. 2005;5:546–559. doi: 10.1038/nri1646. [DOI] [PubMed] [Google Scholar]
- 9.Simonson WT, Franco SJ, Huttenlocher A. Talin1 regulates TCR-mediated LFA-1 function. J Immunol. 2006;177:7707–7714. doi: 10.4049/jimmunol.177.11.7707. [DOI] [PubMed] [Google Scholar]
- 10.Mace EM, Monkley SJ, Critchley DR, Takei F. A dual role for talin in NK cell cytotoxicity: activation of LFA-1-mediated cell adhesion and polarization of NK cells. J Immunol. 2009;182:948–956. doi: 10.4049/jimmunol.182.2.948. [DOI] [PubMed] [Google Scholar]
- 11.Mueller KL, Thomas MS, Burbach BJ, Peterson EJ, Shimizu Y. Adhesion and degranulation-promoting adapter protein (ADAP) positively regulates T cell sensitivity to antigen and T cell survival. J Immunol. 2007;179:3559–3569. doi: 10.4049/jimmunol.179.6.3559. [DOI] [PubMed] [Google Scholar]
- 12.Katagiri K, Hattori M, Minato N, Kinashi T. Rap1 functions as a key regulator of T-cell and antigen-presenting cell interactions and modulates T-cell responses. Mol Cell Biol. 2002;22:1001–1015. doi: 10.1128/MCB.22.4.1001-1015.2002. [DOI] [PMC free article] [PubMed] [Google Scholar]
- 13.Sebzda E, Bracke M, Tugal T, Hogg N, Cantrell DA. Rap1A positively regulates T cells via integrin activation rather than inhibiting lymphocyte signaling. Nat Immunol. 2002;3:251–258. doi: 10.1038/ni765. [DOI] [PubMed] [Google Scholar]
- 14.Raab M, Wang H, Lu Y, Smith X, Wu Z, Strebhardt K, Ladbury JE, Rudd CE. T cell receptor “inside-out” pathway via signaling module SKAP1-RapL regulates T cell motility and interactions in lymph nodes. Immunity. 32:541–556. doi: 10.1016/j.immuni.2010.03.007. [DOI] [PMC free article] [PubMed] [Google Scholar]
- 15.Katagiri K, Imamura M, Kinashi T. Spatiotemporal regulation of the kinase Mst1 by binding protein RAPL is critical for lymphocyte polarity and adhesion. Nat Immunol. 2006;7:919–928. doi: 10.1038/ni1374. [DOI] [PubMed] [Google Scholar]
- 16.Burbach BJ, Medeiros RB, Mueller KL, Shimizu Y. T-cell receptor signaling to integrins. Immunol Rev. 2007;218:65–81. doi: 10.1111/j.1600-065X.2007.00527.x. [DOI] [PubMed] [Google Scholar]
- 17.Calderwood DA, Tai V, Di Paolo G, De Camilli P, Ginsberg MH. Competition for talin results in trans-dominant inhibition of integrin activation. J Biol Chem. 2004;279:28889–28895. doi: 10.1074/jbc.M402161200. [DOI] [PubMed] [Google Scholar]
- 18.Martel V, Racaud-Sultan C, Dupe S, Marie C, Paulhe F, Galmiche A, Block MR, Albiges-Rizo C. Conformation, localization, and integrin binding of talin depend on its interaction with phosphoinositides. J Biol Chem. 2001;276:21217–21227. doi: 10.1074/jbc.M102373200. [DOI] [PubMed] [Google Scholar]
- 19.Doughman RL, Firestone AJ, Anderson RA. Phosphatidylinositol phosphate kinases put PI4,5P(2) in its place. J Membr Biol. 2003;194:77–89. doi: 10.1007/s00232-003-2027-7. [DOI] [PubMed] [Google Scholar]
- 20.Barsukov IL, Prescot A, Bate N, Patel B, Floyd DN, Bhanji N, Bagshaw CR, Letinic K, Di Paolo G, De Camilli P, Roberts GC, Critchley DR. Phosphatidylinositol phosphate kinase type 1gamma and beta1-integrin cytoplasmic domain bind to the same region in the talin FERM domain. J Biol Chem. 2003;278:31202–31209. doi: 10.1074/jbc.M303850200. [DOI] [PubMed] [Google Scholar]
- 21.Di Paolo G, Pellegrini L, Letinic K, Cestra G, Zoncu R, Voronov S, Chang S, Guo J, Wenk MR, De Camilli P. Recruitment and regulation of phosphatidylinositol phosphate kinase type 1 gamma by the FERM domain of talin. Nature. 2002;420:85–89. doi: 10.1038/nature01147. [DOI] [PubMed] [Google Scholar]
- 22.Ling K, Doughman RL, Firestone AJ, Bunce MW, Anderson RA. Type I gamma phosphatidylinositol phosphate kinase targets and regulates focal adhesions. Nature. 2002;420:89–93. doi: 10.1038/nature01082. [DOI] [PubMed] [Google Scholar]
- 23.Micucci F, Capuano C, Marchetti E, Piccoli M, Frati L, Santoni A, Galandrini R. PI5KI-dependent signals are critical regulators of the cytolytic secretory pathway. Blood. 2008;111:4165–4172. doi: 10.1182/blood-2007-08-108886. [DOI] [PubMed] [Google Scholar]
- 24.Vasudevan L, Jeromin A, Volpicelli-Daley L, De Camilli P, Holowka D, Baird B. The beta- and gamma-isoforms of type I PIP5K regulate distinct stages of Ca2+ signaling in mast cells. J Cell Sci. 2009;122:2567–2574. doi: 10.1242/jcs.048124. [DOI] [PMC free article] [PubMed] [Google Scholar]
- 25.Bolomini-Vittori M, Montresor A, Giagulli C, Staunton D, Rossi B, Martinello M, Constantin G, Laudanna C. Regulation of conformer-specific activation of the integrin LFA-1 by a chemokine-triggered Rho signaling module. Nat Immunol. 2009;10:185–194. doi: 10.1038/ni.1691. [DOI] [PubMed] [Google Scholar]
- 26.Wang YJ, Li WH, Wang J, Xu K, Dong P, Luo X, Yin HL. Critical role of PIP5KI{gamma}87 in InsP3-mediated Ca(2+) signaling. J Cell Biol. 2004;167:1005–1010. doi: 10.1083/jcb.200408008. [DOI] [PMC free article] [PubMed] [Google Scholar]
- 27.Lokuta MA, Senetar MA, Bennin DA, Nuzzi PA, Chan KT, Ott VL, Huttenlocher A. Type Igamma PIP kinase is a novel uropod component that regulates rear retraction during neutrophil chemotaxis. Mol Biol Cell. 2007;18:5069–5080. doi: 10.1091/mbc.E07-05-0428. [DOI] [PMC free article] [PubMed] [Google Scholar]
- 28.Schaefer BC, Ware MF, Marrack P, Fanger GR, Kappler JW, Johnson GL, Monks CR. Live cell fluorescence imaging of T cell MEKK2: redistribution and activation in response to antigen stimulation of the T cell receptor. Immunity. 1999;11:411–421. doi: 10.1016/s1074-7613(00)80116-8. [DOI] [PubMed] [Google Scholar]
- 29.Billadeau DD, Mackie SM, Schoon RA, Leibson PJ. The Rho family guanine nucleotide exchange factor Vav-2 regulates the development of cell-mediated cytotoxicity. J Exp Med. 2000;192:381–392. doi: 10.1084/jem.192.3.381. [DOI] [PMC free article] [PubMed] [Google Scholar]
- 30.Friedman RS, Jacobelli J, Krummel MF. Surface-bound chemokines capture and prime T cells for synapse formation. Nat Immunol. 2006;7:1101–1108. doi: 10.1038/ni1384. [DOI] [PubMed] [Google Scholar]
- 31.Skapenko A, Schulze-Koops H. Analysis of Th1/Th2 T-cell subsets. Methods Mol Med. 2007;136:87–96. doi: 10.1007/978-1-59745-402-5_7. [DOI] [PubMed] [Google Scholar]
- 32.Schmits R, Kundig TM, Baker DM, Shumaker G, Simard JJ, Duncan G, Wakeham A, Shahinian A, van der Heiden A, Bachmann MF, Ohashi PS, Mak TW, Hickstein DD. LFA-1-deficient mice show normal CTL responses to virus but fail to reject immunogenic tumor. J Exp Med. 1996;183:1415–1426. doi: 10.1084/jem.183.4.1415. [DOI] [PMC free article] [PubMed] [Google Scholar]
- 33.Semmrich M, Smith A, Feterowski C, Beer S, Engelhardt B, Busch DH, Bartsch B, Laschinger M, Hogg N, Pfeffer K, Holzmann B. Importance of integrin LFA-1 deactivation for the generation of immune responses. J Exp Med. 2005;201:1987–1998. doi: 10.1084/jem.20041850. [DOI] [PMC free article] [PubMed] [Google Scholar]
- 34.Acuto O, Di Bartolo V, Michel F. Tailoring T-cell receptor signals by proximal negative feedback mechanisms. Nat Rev Immunol. 2008;8:699–712. doi: 10.1038/nri2397. [DOI] [PubMed] [Google Scholar]
- 35.Zoncu R, Perera RM, Sebastian R, Nakatsu F, Chen H, Balla T, Ayala G, Toomre D, De Camilli PV. Loss of endocytic clathrin-coated pits upon acute depletion of phosphatidylinositol 4,5-bisphosphate. Proc Natl Acad Sci U S A. 2007;104:3793–3798. doi: 10.1073/pnas.0611733104. [DOI] [PMC free article] [PubMed] [Google Scholar]
- 36.Krauss M, Kukhtina V, Pechstein A, Haucke V. Stimulation of phosphatidylinositol kinase type I-mediated phosphatidylinositol (4,5)-bisphosphate synthesis by AP-2mu-cargo complexes. Proc Natl Acad Sci U S A. 2006;103:11934–11939. doi: 10.1073/pnas.0510306103. [DOI] [PMC free article] [PubMed] [Google Scholar]
- 37.Bairstow SF, Ling K, Su X, Firestone AJ, Carbonara C, Anderson RA. Type Igamma661 phosphatidylinositol phosphate kinase directly interacts with AP2 and regulates endocytosis. J Biol Chem. 2006;281:20632–20642. doi: 10.1074/jbc.M601465200. [DOI] [PubMed] [Google Scholar]
- 38.Nakano-Kobayashi A, Yamazaki M, Unoki T, Hongu T, Murata C, Taguchi R, Katada T, Frohman MA, Yokozeki T, Kanaho Y. Role of activation of PIP5Kgamma661 by AP-2 complex in synaptic vesicle endocytosis. EMBO J. 2007;26:1105–1116. doi: 10.1038/sj.emboj.7601573. [DOI] [PMC free article] [PubMed] [Google Scholar]
- 39.Manjunath N, Correa M, Ardman M, Ardman B. Negative regulation of T-cell adhesion and activation by CD43. Nature. 1995;377:535–538. doi: 10.1038/377535a0. [DOI] [PubMed] [Google Scholar]
- 40.Stockton BM, Cheng G, Manjunath N, Ardman B, von Andrian UH. Negative regulation of T cell homing by CD43. Immunity. 1998;8:373–381. doi: 10.1016/s1074-7613(00)80542-7. [DOI] [PubMed] [Google Scholar]
- 41.Sperling AI, Sedy JR, Manjunath N, Kupfer A, Ardman B, Burkhardt JK. TCR signaling induces selective exclusion of CD43 from the T cell-antigen-presenting cell contact site. J Immunol. 1998;161:6459–6462. [PubMed] [Google Scholar]
- 42.Costello PS, Gallagher M, Cantrell DA. Sustained and dynamic inositol lipid metabolism inside and outside the immunological synapse. Nat Immunol. 2002;3:1082–1089. doi: 10.1038/ni848. [DOI] [PubMed] [Google Scholar]
Associated Data
This section collects any data citations, data availability statements, or supplementary materials included in this article.
Supplementary Materials
Supplemental Figure 1: PIPKIγ90 −/− CD4+ T cells exhibit increased proliferation in response to antigen stimulation.
OVA peptide expanded CD4+ cells were stained with 0.25 uM CFSE and combined with irradiated splenocytes with 0 ug/ml (A), 0.1 ug/ml (B) or 1 ug/ml OVA peptide (C). CFSE dilution was measured 72 hours following stimulation. The % of cells in each cell division was determined by ModFIT analysis. Data represent averages +/− SEM from 3 independent experiments *=p<0.05.
Supplemental Movie 1: GFP PIPKIγ90 establishes diffuse membrane localization during T-cell:APC conjugation
D10 T cells overexpressing GFP-PIPKIγ90 were imaged while interacting with conalbumin loaded CH12 cells. White arrow: GFP-PIPKIγ90 reestablishes uropod localization following conjugation with antigen-loaded CH12 cells (red). Green Arrow: GFP-PIPKIγ90 establishes a diffuse membrane localization following contact with antigen-loaded CH12 cell (red).