Abstract
We present a three-dimensional mathematical framework for modeling the evolving geometry, structure, and mechanical properties of a representative straight cylindrical artery subjected to changes in mean blood pressure and flow. We show that numerical predictions recover prior findings from a validated two-dimensional framework, but extend those findings by allowing effects of transmural gradients in wall constituents and vasoactive molecules to be simulated directly. Of particular note, we show that the predicted evolution of the residual stress related opening angle in response to an abrupt, sustained increase in blood pressure is qualitatively similar to measured changes when one accounts for a nonlinear transmural distribution of pre-stretched elastin. We submit that continuum-based constrained mixture models of arterial adaptation hold significant promise for deepening our basic understanding of arterial mechanobiology and thus for designing improved clinical interventions to treat many different types of arterial disease and injury.
Keywords: constrained mixture model, finite elasticity, adaptation, hypertension
1 Introduction
Stimulated in large part by the work of Rodriguez et al., 1994, the past decade and a half has seen increasingly greater attention directed toward mathematically modeling soft tissue growth (i.e., changes in mass) and remodeling (i.e., changes in microstructure), particularly in arteries. Such modeling is made challenging by the intrinsic complexities of arterial mechanics, including its composite make-up and associated active smooth muscle contractility plus nonlinear, anisotropic, pseudo-elastic passive behaviors over finite deformations (Humphrey, 2002). Whereas the “kinematic growth” approach of Rodriguez and colleagues has been embraced and extended by various investigators to model arterial responses to sustained alterations in blood pressure and flow (e.g., Taber & Eggers, 1996, Rachev, 1997, Taber, 1998, Rachev, 2000), Humphrey & Rajagopal, 2002 suggested that this approach focuses primarily on consequences of growth and remodeling (G&R), not underlying mechanisms. Hence, they proposed a fundamentally different approach, one based on modeling changes in the rates and extents of cellular and extracellular matrix turnover in response to perturbations of mechanical stimuli from normal. Moreover, they introduced the concept of a constrained mixture model wherein different structurally significant constituents are constrained to move together with the mixture (i.e., artery), but are allowed to possess different natural (stress-free) configurations, material behaviors, and rates of turnover.
The goal of this paper is to extend to 3-D the prior 2-D constrained mixture model for arterial G&R proposed by Baek et al., 2006 for cerebral aneurysms and extended by Valentín et al., 2009, Valentín & Humphrey, 2009a, and Valentín & Humphrey, 2009b for cerebral arteries. Whereas 2-D frameworks provide information on arterial adaptations that is of most importance clinically (i.e., changes in caliber and structural stiffness), advantages of a 3-D framework include the ability to account for gradients in the distribution and prestretch of individual structurally significant constituents, particularly elastin (Cardamone et al., 2009), and similarly gradients in the concentration of non-structurally significant constituents (e.g., oxygen, vasoactive molecules, growth factors, and proteases). We confirm the consistency of predictions by the proposed 3-D model with prior 2-D results for sustained alterations in mean blood pressure and flow, and show advantages of a 3-D model in predicting changes in the residual stress related opening angle. Because of a continuing lack of some of the essential data on cell and matrix turnover, many results are presented parametrically based on the best data available.
2 The Mass Change Function – Jm
We assume that the three primary structurally significant constituents comprising the wall of the basilar artery are elastin, four families of fibrillar collagens (oriented axially, circumferentially, and symmetrically oblique; Wicker et al., 2008, and smooth muscle. Data consistently reveal that effective elastin cannot be not produced during maturity even though it is removed via normal aging processes as well as in diseases such as hypertension. In contrast, fibrillar collagens and smooth muscle turnover continuously throughout maturity, which emphasizes the importance of tracking individual balances or imbalances in production and removal. For more information on histology, pathology, and mechanobiology of arteries, see Humphrey, 2002 and Humphrey, 2008a.
Consider first the change of total mass during G&R. Mass balance for individual constituents k that are constrained to move with a mixture that deforms quasi-statically can be written at any G&R time τ ∈[0,s], where s is the current time, as
| (1) |
where Mk the mass of constituent k and is its net rate of production or removal. Summing Eq. (1) for all constituents, we have
| (2) |
which can be used to find the total mass . Hence,
| (3) |
Total volumes between two instants, e.g. between τ = 0 and τ = s , are given by the overall Jacobian, V(τ) = Jm(τ)V(0) for all τ ∈[0,s]. Using this relation and assuming that the mass density of the mixture is constant over all past times and throughout G&R (Humphrey & Rajagopal, 2002), that is, ρ(τ) ≈ ρ(0) for all τ ∈[0,s], Equation (3) becomes
| (4) |
or,
| (5) |
The right hand side of Eq. (5) represents the total change in mass over time and gives us relatively simple expression for the mass change function
| (6) |
3 Kinematics
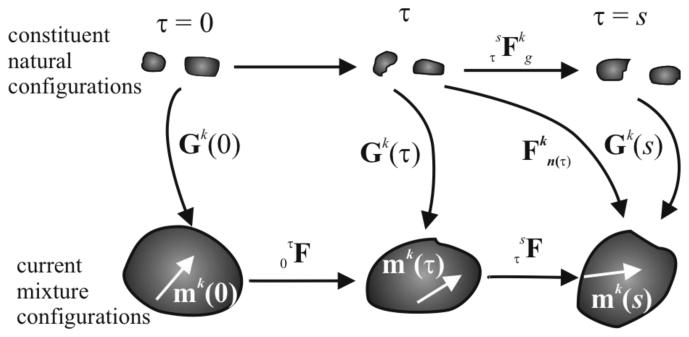
Consistent with prior 2-D constrained mixture models, we assume that the mechanical properties and “deposition stretches” of newly synthesized constituents (i.e., fibrillar collagens and smooth muscle) remain the same despite changes in overall tissue geometry or loading. We denote individual deposition stretches (or pre-stretch in the case of elastin because it is only produced during the perinatal period) by, Gk (τ) , which as illustrated in Figure 1 is defined relative to constituent-specific natural configurations rather than an overall mixture configuration (cf. Humphrey & Rajagopal, 2003). That is, Gk (τ) quantifies mappings from natural (stress-free for each constituent) to intermediate (in vivo, loaded mixture) configurations at each deposition time τ ∈[0,s]. Henceforth, τ = 0 denotes the instant at which the mechanical loading is perturbed from normal in maturity and s denotes the current G&R time. Note, too, that the deformation gradient quantifies mappings from natural configurations of constituent k at time τ to a current mixture configuration at time s, and the deformation gradient similarly quantifies mappings for each constituent k between its natural configurations at times τ and s . Moreover, quantifies mappings within in vivo mixture configurations between τ and s. Because the total mixture mass density is assumed to remain constant, that is, ρ(s) ≅ ρ(0) , despite expected changes in total mass (Humphrey & Rajagopal, 2002), we have
| (7) |
Hence, J(s) represents local volume change within the in vivo configuration. Note from Figure 1 that
| (8) |
or
| (9) |
To define orientations of 1-D constituents (e.g., fibrillar collagen and smooth muscle, which are assumed to have a fibrous structure), let the unit vector mk (τ) denote the orientation of constituent k in any in vivo mixture configuration at time τ ∈[0,s]. The change in constituent orientation between two times is thus
| (10) |
Given the definitions in Eqs. (8) and (9), it is possible to write the following
| (11) |
If we let the deposition stretch tensor be written
| (12) |
then we have the result
| (13) |
or, by use of Eq. (10), one obtains the following relation between natural and current mixture configurations,
| (14) |
Having identified , which will be fundamental to the constituent specific stress response function, note that the right Cauchy–Green tensor is .
Figure 1.
Schema of configurations important in arterial growth and remodeling (G&R). The current (in vivo) mixture configurations track both deformations and G&R of the vessel. The constituent natural configurations are stress-free separately for each constituent. Deformations and G&R are often best considered at the generic time τ ∈[0,s].
Finally, we define possible deformation gradients F from the current to an unloaded mixture configuration (i.e., using the current configuration as the reference; see Cardamone et al., 2009). Hence, considering motions relative to the in vivo configuration, the deformation gradient is simply F = I, where we emphasize that taking the in vivo configuration, not the unloaded configuration, as the reference is convenient both computationally and biologically. Conversely, considering the deformation to an unloaded mixture configuration yields F ≠ I , as will be used below.
4 Kinetics of G&R
The mass of each constituent may change due to stress-mediated changes in local production and removal. Although our model builds upon prior work (Humphrey & Rajagopal, 2002, Baek et al., 2006, and Valentín et al., 2009), we postulate changes in mass rather than mass density as done previously. Focusing directly on mass better reflects the underlying biology because cells produce mass, not mass density, and it is straightforward to implement in the case of a uniform cylindrical vessel. Hence, let the evolution of mass for constituent k be given by (cf. Baek et al., 2006)
| (15) |
where Mk (s) is the total mass of constituent k existing at G&R time s, Qk ∈[0,1] accounts for fractions of material produced at or before time τ = 0 that survive to time τ = s , with Qk (0) = 1 by definition, mk (τ) > 0 is the true mass production rate (cf. the net mass production rate which can be negative, zero, or positive), and qk ∈[0,1] accounts for fractions of material produced at time τ that survive to time τ = s .
Production Function
Similar to prior studies (Valentín et al., 2009), we also let the true rate of mass production / removal depend on differences from normal (homeostatic) values for both wall stress and the concentration of effector molecules, namely
| (16) |
where is the basal rate, is a gain-type rate parameter that models wall stress-mediated changes (note: increased wall stress or stretch of smooth muscle cells promotes the production of collagen and proliferation of cells), and is a gain-type rate parameter responsible for constrictor-mediated changes (note: increased wall shear stress upregulates endothelial cell production of nitric oxide, an inhibitor of collagen synthesis and smooth muscle cell proliferation, whereas decreased wall shear stress upregulates endothelial cell production of endothelin-1, a promoter of collagen synthesis and smooth muscle cell proliferation). Although 3-D problems allow one to develop such relations based on individual components of stress and transmural distributions of endothelial derived molecules, for illustrative purposes we employ the following scalar metric for Cauchy stress,
| (17) |
where and tSMC are the total stress in the four families of collagen fibers and smooth muscle, respectively, while is a homeostatic value. The concentration effect is similarly simplified by considering a lumped parameter ratio C of constrictor (e.g., endothelin-1 or angiotensin II) to dilator (e.g., nitric oxide or prostacyclin), hence differences in this concentration from the basal value CB are denoted
| (18) |
where C(τ) depends on changes in the blood flow induced wall shear stress (with high wall shear stress upregulating dilators and low wall shear stress upregulating constrictors), thus
| (19) |
Here, CS is a scaling factor and τw and are wall shear stresses experienced by the endothelial cells at G&R time τ ∈[0,s] and the homeostatic state, respectively.
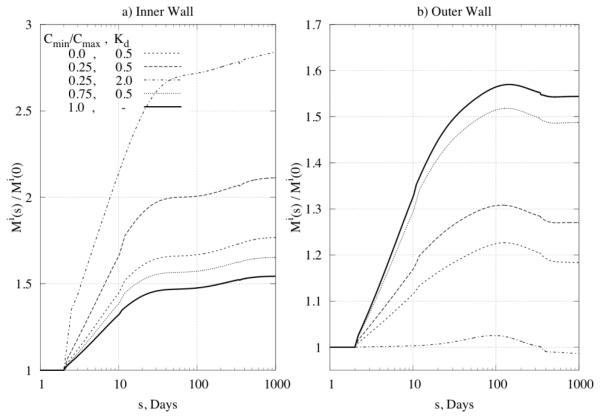
Furthermore, we considered the influence of distributions through the wall (i.e., for all r ∈[ri,ro]) of this vasoconstrictor / vasodilator ratio. As a first approximation, let
| (20) |
Here, Cmax and Cmin are constrictor/dilatator ratios at the inner and outer radius, respectively, while Kd defines the nonlinearity of the prescribed distribution. The maximum occurs at the inner wall because the associated vasoactive molecules (e.g., NO and ET-1) are produced primarily by the endothelium. Results would be more accurate if the diffusion of constrictors and dilatators was modeled directly, but this will require additional data. Inclusion of diffusion will thus be left for future work.
Removal Function
We also consider the same first-order-kinetic relation as used previously (Valentín et al., 2009), namely
| (21) |
where Kk (τ̃) are rate-type parameters for mass removal with units of day−1. The functions Qk are just special cases of qk with integration limits of τ̃ ∈[0,s]. It is well known that rates of protein degradation / denaturation and cell death can depend on the level of stress (Humphrey, 2008a), hence we let the rate parameter depend on the level of tension experienced by constituent k, namely
| (22) |
is an initial value for the rate parameter and ζ is difference in fiber tension from its homeostatic value,
| (23) |
5 Constitutive Formulation and Stress Analysis
Arteries typically exhibit a nonlinear, anisotropic, nearly elastic behavior under passive conditions but they also generate smooth muscle contractile stress under active conditions, hence the stress response is assumed as
| (24) |
where W is the stored energy function for the elastic response and tactive is the smooth muscle contractility, which acts primarily in the circumferential direction. By the rule of mixtures, the stored energy is decomposed conceptually as with ϕk a constituent mass fraction. Following Baek et al., 2006, the stored energy for a constituent k that is allowed to turnover continuously can be written
| (25) |
Hence, herein because the evolving mass fractions are accounted for naturally by the production / removal functions.
Constituent specific stored energy functions are assumed as follows. For elastin, it is customary to use a neoHookean response (Dorrington & McCrum, 1977)
| (26) |
with c1 a material parameter. Because structurally effective elastin is only produced during the perinatal period, and it is very stable biologically (Langille, 1996), let
| (27) |
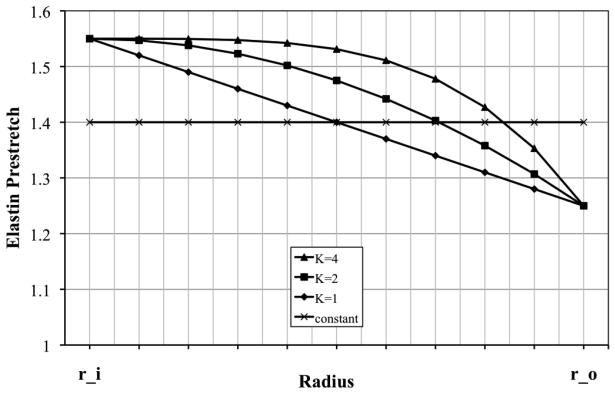
Generally, the pre-stretches built into elastin during development and maturation vary across the arterial wall (cf. Figure 2). To include such variations, we prescribe a nonlinear distribution function for elastin pre-stretches suggested previously (Cardamone et al., 2009)
| (28) |
where K governs the “deposition rate” (e.g., K = 0 implies constant deposition through the wall, K = 1 a linear distribution, and so forth).
Figure 2.
Assumed distributions of elastin pre-stretch through the arterial wall (r_i stands for inner and r_o for outer radius), which are thought to result during development and subsequent biological growth to maturation (Cardamone et al., 2009).
For the other two constituents, fibrillar collagen (defined by four families, with axial, circumferential, and diagonal orientations, the latter assumed to initially be 45 and 135 degrees from the axial direction) and passive smooth muscle, we assume exponential behavior
| (29) |
with and the associated material parameters and . The last term in equation (24) is taken as (Rachev & Hayashi, 1999)
| (30) |
where Tmax is the maximum actively generated stress, having units N/m2 , λM is the circumferential stretch at which active stress is maximum, λ0 is the circumferential stretch at which active stress goes to zero, C(s) is the aforementioned net ratio of constrictors to dilators, and evolving via a first order rate equation (Baek et al., 2007)
| (31) |
where rm(active) = r(0) in a normal artery.
6 Formulation of the Axisymmetric 3-D Cylinder
Deformation Gradients for the Mixture
Implementation of the proposed theory for a general 3-D geometry will require finite element analysis. In contrast, we focus here on a simpler sub-class of 3-D problems, one that allows a semi-analytical solution and development of increased intuition: the finite extension and distension of a straight cylindrical segment of an artery. Such problems are clinically relevant for particular arteries, including common carotids, the infrarenal aorta, and the basilar artery that is considered herein.
As a first step, therefore, consider the deformation gradient associated with mappings within mixture configurations between two times τ and s, namely (recall Figure 1). In general,
| (32) |
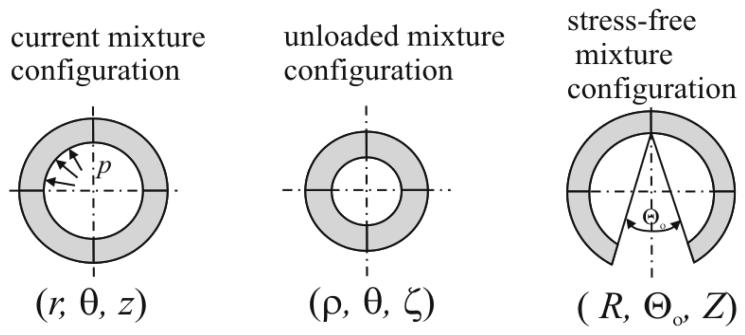
In the case of an axisymmetric cylinder maintained at a fixed in vivo length (cf. Figure 3), the following relations hold
| (33) |
thus the deformation is assumed to depend on radius alone, yielding
| (34) |
A volume change of the mixture (due to possible mass production or removal) between two times is given by equation (6), but it was assumed further that
| (35) |
Hence, Eq. (34) can be written
| (36) |
Figure 3.
Assumed configurations of importance for an axisymmetric cylinder representation of an artery: current pressurized and axially extended (left), excised and unloaded (middle), and excised, unloaded, and radially cut (right), which renders the artery nearly stress-free.
Opening Angles
Residual stress is that stress which exists in a body in the absence of externally applied loads. Although its existence was mentioned indirectly by Bergel, 1960, Fung, 1983 and Vaishnav & Vossoughi, 1983 independently highlighted the need to calculate and account for residual stresses in overall stress analyses. Herein, we follow the approach in Cardamone et al., 2009. There are two different configurations suitable for experimental observation: excised or excised plus radially cut, which is assumed to be almost stress free. For the excised configuration (cf. Figure 3), the deformation gradient relative to the intact in vivo configuration is
| (37) |
with ρ(τ) and λ(τ) the unloaded radius and axial stretch, respectively, whereas for the excised and radially-cut configuration we have
| (38) |
Here, R(τ), Λ(τ), and Θ0(τ) are radius, axial stretch, and opening angle, respectively, for the instant τ. It is important to note that the deformation gradient given by Equation (24) has to be taken as in Eq. (37) or (38).
Equilibrium Equations
It has been shown by many that inertial loads are typically negligible in arteries during the cardiac cycle, hence allowing the elastodynamic problem to be solved via a series of quasi-static motions. Local equilibrium, in absence of body forces, is
| (39) |
which, for an axisymmetric cylinder exhibiting an overall cylindrical orthotropy and subjected to uniform axial extensions and distensions alone, reduces to one non-trivial equation in the radial direction:
| (40) |
where ri and ro are the inner and outer radius, respectively, and P is luminal pressure in the artery. Although the traction boundary condition in the axial direction cannot be prescribed exactly, one can enforce a mean boundary condition that requires the sum of axial stresses over the cross-sectional area to balance the net axial load L, namely
| (41) |
Finally, from equation (6) and by using the assumption that the overall mass density is constant during G&R processes (Humphrey & Rajagopal, 2002), we have a third expression that must be satisfied,
| (42) |
where l is the length of artery.
7 Simulation Results
To study the general behavior of the model, we simulated G&R for a basilar artery, one of the key vessels supplying blood to the brain. Material parameters are given in Table 1 (cf. Valentín & Humphrey, 2009a) or were calculated to satisfy equilibrium and ensure normal tissue maintenance.
Table 1.
Parameter values used to simulate G&R of a basilar artery
| Geometry and Applied Loads |
| ri = 1.42 mm, ρs = 1050 kg/m3, Ph = 95 mmHg, |
| Deposition Stretches or Pre-stretches |
| Gcollagen = 1.08, Gelastin = 1.4, Gsmc = 1.2, |
| Muscle Activation Parameters |
| TM = 150 kPa, λM = 1.1, λ0 = 0.4, CB = 0.68, CS = 20CB |
| Initial Mass Fractions and Half-lives |
| ϕc = 0.22, ϕe = 0.02, ϕsmc = 0.76 |
| , |
| Material Parameters |
| c1 = 237.6kPa, , , , |
Diverse observations of arterial responses to altered pressure and flow provide an easy check of results from G&R simulations (Humphrey, 2008b). Assuming mean values of wall shear stress and circumferential wall stress, homeostatic (h) values are
| (43) |
If perturbations in blood flow and pressure are given by Q = εQh and P = γPh, and both wall shear stress and circumferential stress are returned to homeostatic values, then stress-mediated G&R must produce specific changes in geometry: and . For example, when blood flow is 30% below its homeostatic (normal) value, ε = 0.7 and it is expected that inner radius and thickness should both change as 0.71/3 = 0.8879 of homeostatic values. Whereas these simple relations provide insight into final values of geometric changes, they do not inform us with regard to the evolution of these changes. Let us now consider predictions of the present G&R model for insights into the evolution.
Sustained Alteration in Pressure
As the first test of our model, consider an abrupt and sustained 50% increase in luminal pressure, which is relevant to the study of hypertension. Consistent with the aforementioned discussion, the most conspicuous empirically observed response by the arterial wall to hypertension is a thickening of the wall and an associated return of circumferential wall stress toward its normal value (e.g., see Fridez et al., 2003 or Hu et al., 2007). To simulate such responses, the rate parameters for mass production were studied parametrically over a range considered previously in 2-D simulations (Valentín & Humphrey, 2009a), that is, and .
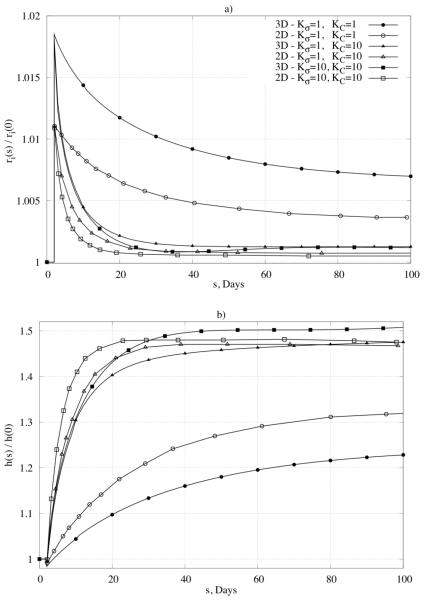
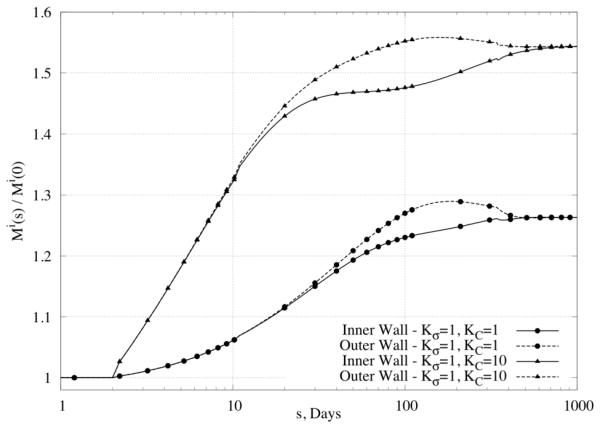
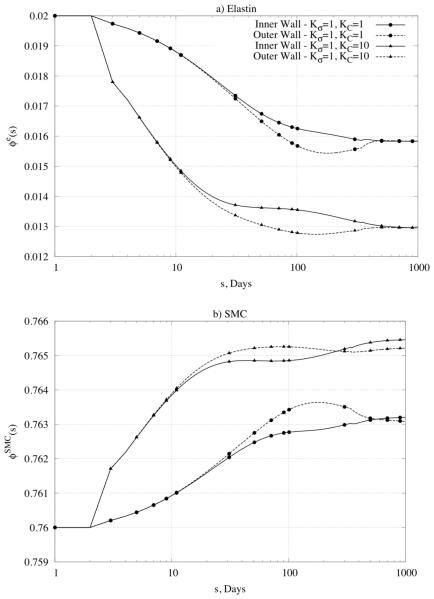
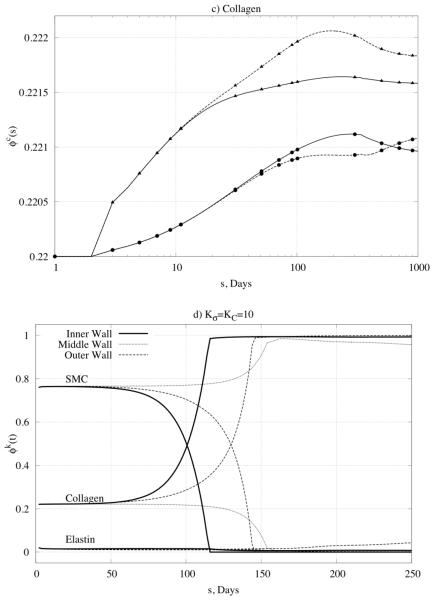
Figure 4a shows the predicted time course of changes in inner radius, normalized with respect to the assumed homeostatic value, for different values of the production rate parameters; note, too, the direct comparison with results obtained from the aforementioned validated 2-D (membrane) formulation. As expected, the inner radius first increased due to the increased pressure and distensibility of the wall, but then was restored toward its homeostatic value over time via vasoactive constriction and cell and matrix turnover in the vaso-altered configuration. This restoration was achieved to within 0.6% of the homeostatic value for and to within 0.1% for , and for the period considered. Figure 4b shows further that the model predicted wall thickness to increase over G&R time in response to the increased pressure. Note that the extent of thickening varied, over the period considered, from 22% to the expected 50%, depending on the specific values of the production rate parameters. Thickening resulted, in part, from an increased production of collagen and smooth muscle; associated changes in mixture mass through the wall (inner versus outer portion of the wall) are shown in Figure 5 for a sub-set of the parameter values. Albeit not shown, higher values of the production rate parameter for stress-mediated changes led to “biological instabilities” after 110 or 350 days whereas thickening converged to reasonable values for lower values of the gain parameters. These biological instabilities suggest a possible unbounded, unbalanced turnover and are discussed further below. It appears from Figure 4 and Figure 5, therefore, that the best correspondence with expected behaviors was achieved in this case with , , noting that G&R in response to abrupt changes in pressure can be dramatic within 2 weeks (Hu et al., 2007). Predicted changes in individual mass fractions are shown in Figure 6a-c for different positions within the arterial wall and for rate parameters that yielded convergent predictions for inner radius and thickness (cf. Figure 4). Note that the mass fraction for elastin decreased simply due to the increased production of collagen and smooth muscle in this case. It is possible that elastin fragments or degrades during long periods of hypertension (particularly increased pulse pressure), but we did not consider this possibility here.
Figure 4.
Predicted geometric changes of normalized inner radius (panel a) and normalized thickness (panel b) over time in response to an abrupt and sustained 50% increase in pressure. Note the comparison of results for our 3-D formulation with results for a membrane formulation (marked as 2-D) published in Valentín et al., 2009. Shown, too, are different responses for different values of the gain-type rate parameters (Kσ and KC).
Figure 5.
Change in mass relative to original values at different positions within the wall, namely those closest to the inner or outer radius (superscript i stands for integration region), in response to a 50% increase in pressure. Note that lower values of the rate parameters (Kσ ≅ 1) yielded stable mass production unlike that for higher values (not shown).
Figure 6.
Predicted time courses of constituent mass fractions for (panel a) elastin, (panel b) smooth muscle cells (SMC), and (panel c) collagen in response to a 50% increase in pressure given modest values of the rate parameters. Note the three different sets of values of the rate parameters (KC = Kσ = 1 , KC = 1, Kσ = 10 , and KC = 10, Kσ = 1) and the multiple locations within the wall (inner radius and outer radius). Also shown (panel d) are all three mass fractions for large values of the rate parameters, which led to unstable results.
Figure 6d shows predicted changes in all three primary mass fractions for the case of , , which was one that led to non-convergent predictions. Note the dramatic changes in the mass fractions of smooth muscle and collagen – the former almost vanished at the inner and outer radii while the latter nearly vanished within the central region of the wall. One consequence of loosing smooth muscle is a lower active stress, which forces the wall to seek a different equilibrium state. Reasons why large values of the production rate parameters led to unrealistic behaviors need to be investigated further, but these simulations serve to bound further the acceptable range of parameter values (cf. Valentín & Humphrey, 2009a).
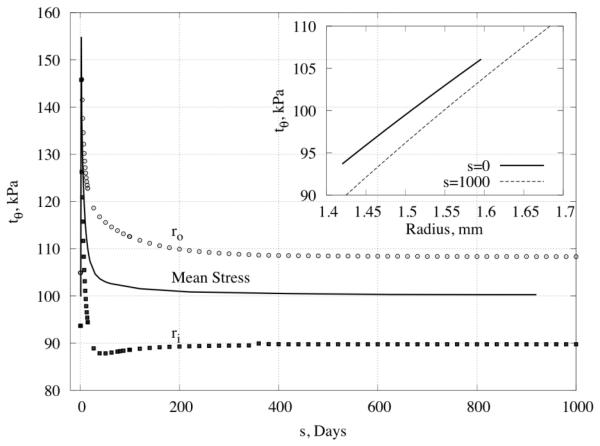
Returning to one of the convergent predictions , Figure 7 shows the predicted time course for circumferential stress. As expected, values of stress increased dramatically and abruptly in response to the prescribed 50% increase in pressure, but subsequent vasoactive changes and altered turnover rates in vaso-altered configurations quickly returned the stress toward its homeostatic value. In particular, consistent with the problem formulation, the mean value of circumferential stress was returned fully to its homeostatic value by 200 days, with most of the changes happening within the first month. Although stress returned to near normal values at all locations within the wall, that in the inner portion of the wall converged to a value slightly lower than homeostatic whereas that in the outer portion converged to a value slightly greater than homeostatic.
Figure 7.
Predicted time course of the transmural distribution of circumferential stress following a 50% increase in pressure: shown at the inner and outer radius and in contrast to the overall mean stress. The inserted figure shows the full transmural distribution of circumferential stress through the wall at time s = 0 days and s = 1000 days.
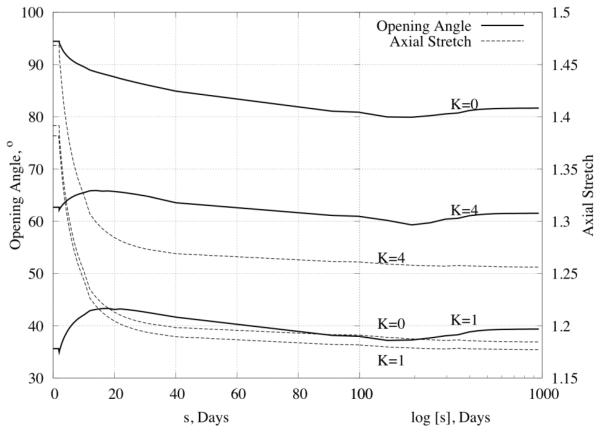
An advantage of a 3-D model is its capability to predict time courses for the unloaded or almost stress-free configurations (and the associated opening angles), which can be checked experimentally. Figure 8 shows changes in opening angle (solid lines) over time for production rate parameters of , 10 as well as for different distributions of elastin pre-stretches through the wall (K=0 for constant, K=1 (linear), and K=4 for the distribution prescribed by equation (28)). Similar to many reports in the literature, the opening angle first increased, then returned toward baseline. In addition, Figure 8 also shows the predicted evolution of the in vivo axial stretch (dashed line and right hand ordinate). As it can be seen, the model predicted dramatic decreases in the axial stretch (from ~1.4 to ~1.2). Such reductions in the in vivo axial stretch have also been reported for hypertension (Humphrey, 2008b).
Figure 8.
Time course of opening angle (left scale of y axis) and axial stretch (right scale of y axis) for Kσ = 1, KC = 10 and three different distributions of elastin (constant K=0, linear K=1 and 4th order curve K=4; recall Figure 2) in response to a 50% increase in pressure.
Altered blood flow
Sustained increases or decreases in blood flow can result in an increased or decreased arterial caliber as well as associated changes in wall thickness and axial behavior (Lehman et al., 1991, Langille, 1996, Rudic et al., 1998). The vasoactive response to altered flow (e.g., altered production of NO and ET-1 by the endothelium, which in turn affects smooth muscle contractility) can occur within minutes; if this response is sufficient to restore wall shear stress to its homeostatic value, then subsequent G&R serves to entrench the artery at its new size. If the initial vasoactive response is not sufficient to restore wall shear stress to its homeostatic value, then a series of vasoactive and G&R responses serve to restore all stresses toward near normal values over longer periods. Regardless, growth and remodeling processes are fundamental to the long-term adaptation to altered blood flow.
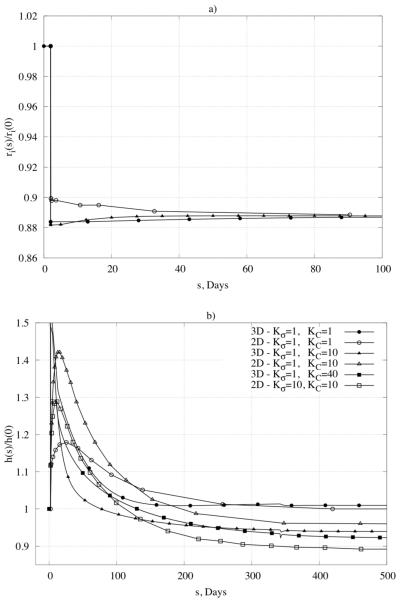
Consider the predicted response of a basilar artery (Table 1) to an abrupt and sustained 30% reduction in blood flow. Again the time course depends strongly on the G&R rate parameters. Figure 9 shows predicted changes in caliber and wall thickness. The rapid change in radius reflects the dominant vasoactive response in this case; the initial increase in thickness simply reflects the early isochoric thickening due to the reduction in caliber. Recall from earlier that, in this case, the expected values for inner radius and thickness are 88.79% of the homeostatic values. Figure 9a shows that such results are achieved regardless of the imposed rate parameters Kσ and KC because vasoactivity dominates; Figure 9b shows that predicted changes in thickness do depend on the rate parameters and that these changes are much slower because they depend on cell and matrix turnover. As seen in the figure, the predicted results are again consistent with those from the aforementioned verified 2-D model (Valentín & Humphrey, 2009).
Figure 9.
Time course of changes of (panel a) normalized inner radius and (panel b) normalized thickness in response to a 30% decrease in blood flow. Note the comparison of results for our 3-D formulation with results for a membrane formulation (marked as 2D) published in Valentín et al., 2009. Shown, too, are different responses for different values of the gain-type rate parameters (Kσ and KC).
Influence of loading time on arterial responses
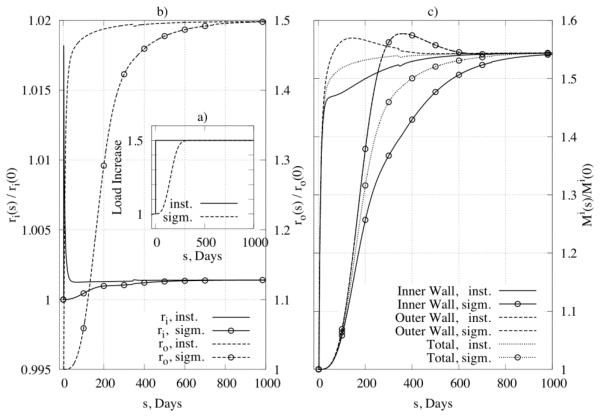
It is convenient to consider numerically the special cases of abrupt changes in pressure and flow, which model well some cases of experimental models of hypertension or clinical interventions. Nevertheless, such changes often occur over extended periods in normal pathologies, particularly hypertension. Hence, consider comparisons between abrupt and gradual changes in pressure, the latter of which was modeled by prescribing pressure changes using a sigmoidal function
| (44) |
where Ph is the homeostatic pressure, ΔP is the increase in pressure, τ½ is the half time for the change, and k1, k2 are parameters. Figure 10b shows results for normalized inner (left y-axis) and outer (right y-axis) radius and Figure 10c shows results for changes in overall wall mass, both for the case of , . As expected, results show that differences manifest mainly in the time course, not the extent, of the predicted changes.
Figure 10.
Influence of loading time on G&R: (panel a) two types of loading, that is, an instantaneous increase in pressure (solid line) and a sigmoidal increase (dotted line) with s½ = 250 days, (panel b) the change of inner radius (left y –axis) and outer radius (right y –axis) for the different loadings, and (panel c) the mass change as a function of loading for inner and outer parts of the wall.
Distribution of Constrictor/Dilator Ratio through the Wall
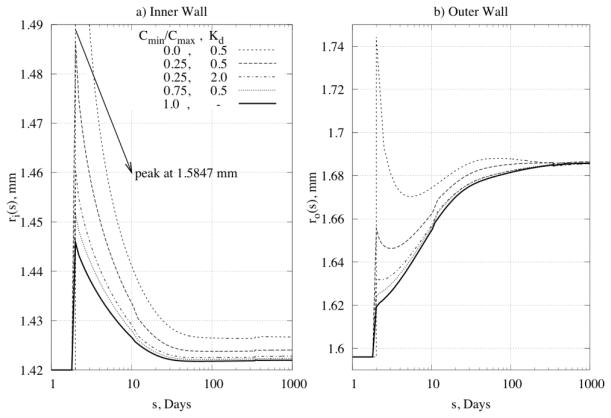
Next, we prescribed transmural differences in the constrictor to dilator ratio C (cf. equation (20)) for the problem of a 50% increase in pressure, with , . Figure 11 and Figure 12 reveal a significant influence of the concentration distribution on converged values of inner and outer radius as well as on the distribution of mass. Different ratios can induce transmural differences in local G&R, with potentially important consequences on overall arterial homeostasis. There is a need, therefore, for more data on the diffusion, consumption, and half-lives of these effector molecules and then their direct incorporation within 3-D G&R models.
Figure 11.
Predicted time courses of change of (panel a) inner radius and (panel b) outer radius for different ratios of vasoconstrictor/vasodilator through the wall.
Figure 12.
Time courses of mass increase for Kσ = 1, KC = 10 at (panel a) the inner wall and (panel b) the outer wall for different ratios of vasoconstrictor/vasodilator through the wall.
8 Discussion
Previous simulations of arterial adaptations based on 2-D implementations of a general constrained mixture theory of soft tissue growth and remodeling (Humphrey & Rajagopal, 2002) capture many salient features of disease progression and responses to altered hemodynamic loads (e.g., Baek et al., 2006, Baek et al., 2007, Valentín et al., 2009, Valentín & Humphrey, 2009a; Cardamone et al., 2010). Although such studies remain useful, for they provide clinically important insight into evolving luminal caliber and structural stiffness, 3-D implementations can yield further insight into the underlying mechanics and mechanobiology (cf. Alford et al., 2008). We showed herein, for the finite extension and distension of a cylindrical basilar artery, that our 3-D model recovers verified results from prior 2-D models while providing increased information, as, for example, on the residual stress related opening angle. Because 3-D models allow one to examine effects of transmural distributions of wall constituents and diffusion of important effector molecules from the endothelium into the wall (e.g., nitric oxide or endothelin-1), there is now a pressing need for better biological data to inform and extend such models.
Consistent with Cardamone et al., 2009, we examined consequences of postulated transmural differences in the prestretch of intramural elastin (Figure 2 and Figure 8), which have a dramatic impact on the predicted opening angle and would likely play an important role in both aging and adaptations in hypertension. Although experimental determination of actual transmural distributions of elastin prestretch will be challenging, this factor clearly merits increased attention. There is similarly a need for better data on transmural distributions of collagen, including fiber orientation, diameter, and cross-linking as well as collagen type. Using nonlinear optical microscopy (i.e., second harmonic generation), Wicker et al., 2008 showed in rabbit basilar arteries that collagen fibers cluster around the axial direction in the adventitia (−60 to 0 to 60 degrees) and around the circumferential direction in the media (−60 to 90 to 60 degrees), each with a near Gaussian distribution. This finding reveals the need to model predominantly axial and circumferential families of fibers directly, not just diagonal families as originally proposed by Holzapfel et al., 2000 for non-cerebral arteries. Although modeling continuous distributions of fiber angles would be more realistic, fits to biaxial data show that the 4 fiber family model used herein captures well the pressure-diameter and axial force-extension behavior of the basilar artery (Baek et al., 2007; Wicker et al., 2008) and hence enables predictive capability. Indeed, in a careful comparison of multi-fiber family models, Zeinali-Davarani et al., 2009 showed that 4 and 6 fiber family models provide much better fits to biaxial data than 2 or 3 fiber family models and they give nearly as good of a fit as 8 and 10 fiber family models; hence, 4 fiber family models represent a practical compromise. Toward this end, note that although the standard Holzapfel model consists of 2 fiber families, the wall of the carotid artery was originally modeled as a separate media and adventitia. That is, they effectively modeled the wall with 4 fiber families.
Similar to most prior models of G&R, we did not consider the media and adventitia separately; there is clearly a need to do so in future 3-D models. Indeed, not only is there a need to account for different mass fractions of constituents within these two layers (with smooth muscle and elastin found predominantly within the media and fibrillar collagen dominating the adventitia), there is a need to account for different distributions of collagen by type and fiber diameter within these two primary layers. Wicker et al., 2008 showed, for example, that the circumferentially oriented collagen within the media of the rabbit basilar artery has a smaller fiber diameter than the more axially and diagonally oriented collagen of the adventitia. Additional data, including information on collagen type (e.g., the wall normally consists of about 70% type I and 30% type III collagen) and cross-linking, are thus needed to refine future models. Moreover, there is a need to understand better the possible reorientation of collagen fibers in diverse cases of disease progression or altered hemodynamics (cf. Hariton et al., 2007; Driessen et al., 2008; Karsaj et al., 2009). Baek et al., 2006 showed, for example, that allowing newly synthesized collagen to be oriented differently from extant fibers influenced greatly the biological stability of aneurysmal enlargement. Whereas it is intuitive that collagen fibers will reorient in cases wherein overall shape changes dramatically, it is less clear in cases of enlargement or thickening that retains a cylindrical geometry at the same in vivo length, which was considered herein. How circumferentially oriented smooth muscle cells versus more randomly oriented fibroblasts orient extracellular matrix upon deposition may differ, but neither is known well. Lacking guidance from experiments, we did not allow collagen fiber reorientation due to G&R.
There is also a need for more information on stress-mediated collagen production, which was assumed herein to be promoted primarily by intramural stresses above homeostatic levels but modified by wall shear stress (i.e., endothelial derived nitric oxide and endothelin-1 decrease and increase, respectively, collagen production by medial smooth muscle cells; Humphrey, 2008a). Among others, Baek et al., 2006 also allowed collagen production to be scaled by the number of cells, which was reasonable for aneurysmal G&R is likely driven primarily by remnant (myo)fibroblasts having a uniform phenotype. In contrast, consistent with Valentín et al., 2009 and Cardamone et al., 2010, we did not scale collagen production by cell number. In cases of hypertension and altered flow, smooth muscle cells can exhibit considerable phenotypic heterogeneity, meaning some cells hypertrophy and remain largely contractile while others proliferate and become largely synthetic (cf. Hu et al., 2008). Moreover, smooth muscle cells and fibroblasts both contribute to overall collagen production, perhaps to different extents depending of the time of G&R. There is clearly a need for better data on specific cell mediated collagen production to guide constitutive formulations for mass production. Related to this, we assumed that the production of collagen and smooth muscle depended on the total Cauchy stress in that constituent (equation 17), not particular components. When the associated gain-type parameters for collagen were each 10, we found that solutions did not converge to expected values after long periods (Figure 6d). Albeit not shown, a similar constitutive relation wherein collagen production depended on the stress borne by both the collagen and the smooth muscle (which is responsible, in part, for producing the collagen) yielded convergent solutions for all values of the associated gain parameters considered. There is a pressing need for both experiments and theoretical investigations to identify the most appropriate constitutive relations for mass production and removal, which should also delineate effects of pulsatile versus mean pressure and flow on cell response (cf. Cardamone et al., 2010). Like most prior studies, we focused our attention on responses to mean values due to the lack of information on adaptations by cerebral arteries to pulsatile hemodynamics.
In conclusion, we have shown that a 3-D constrained mixture model of arterial growth and remodeling recovers verified results from prior 2-D simulations while providing additional insight into the evolution of residual stress opening angles and different degrees of change within the inner versus the outer wall of the artery. Whereas it was long thought that changes within the media were most important in hypertension, increasing evidence reveals that changes are dramatic within the adventitia as well (Humphrey, 2008a). In contrast, responses to injury (e.g., balloon embolectomy) and the development of atherosclerosis affect primarily the (neo)intima (Humphrey, 2002). There is a need for continued research into 3-D models of arterial adaptation that account for and predict the different cell mediated changes within the different layers of the arterial wall, for only in this way will we truly understand better how to effectively diagnosis and treat many maladies of the arterial wall that have a biomechanical basis (Taylor & Humphrey, 2009).
Acknowledgments
This work was supported, in part, by a Fulbright Fellowship (to I. Karšaj) and a grant from the NIH (HL086418 to JD Humphrey). We also thank the guest editors for inviting this paper, which stems in large part from the original paper by Humphrey and Rajagopal (2002). JDH acknowledges continued collaboration with Prof. Rajagopal and extends special congratulations on this occasion celebrating his 60th birthday.
Footnotes
Publisher's Disclaimer: This is a PDF file of an unedited manuscript that has been accepted for publication. As a service to our customers we are providing this early version of the manuscript. The manuscript will undergo copyediting, typesetting, and review of the resulting proof before it is published in its final citable form. Please note that during the production process errors may be discovered which could affect the content, and all legal disclaimers that apply to the journal pertain.
This paper is dedicated to Professor K.R. Rajagopal in celebration of his 60th birthday.
References
- 1.Alford PW, Humphrey JD, Taber LA. Growth and remodeling in a thick-walled artery model: effects of spatial variations in wall constituents. Biomech Model Mechanobiol. 2008;7:245–62. doi: 10.1007/s10237-007-0101-2. [DOI] [PMC free article] [PubMed] [Google Scholar]
- 2.Baek S, Rajagopal KR, Humphrey JD. A theoretical model of enlarging intracranial fusiform aneurysms. J Biomech Eng. 2006;128:142–149. doi: 10.1115/1.2132374. [DOI] [PubMed] [Google Scholar]
- 3.Baek S, Valentín A, Humphrey JD. Biochemomechanics of cerebral vasospasm and its resolution: II. Constitutive relations and model simulations. Ann Biomed Eng. 2007;35:1498–509. doi: 10.1007/s10439-007-9322-x. [DOI] [PubMed] [Google Scholar]
- 4.Bergel D. The visco-elastic properties of the arterial wall. 1960 [Google Scholar]
- 5.Cardamone L, Valentín A, Eberth JF, Humphrey JD. Origin of axial prestretch and residual stress in arteries. Biomech Model Mechanobiol. 2009;8:431–446. doi: 10.1007/s10237-008-0146-x. [DOI] [PMC free article] [PubMed] [Google Scholar]
- 6.Cardamone L, Valentín A, Eberth JF, Humphrey JD. Modelling carotid artery adaptations to dynamic alterations in pressure and flow over the cardiac cycle. Math Med Biol. 2010 doi: 10.1093/imammb/dqq001. [DOI] [PMC free article] [PubMed] [Google Scholar]
- 7.Dorrington KL, McCrum NG. Elastin as a rubber. Biopolymers. 1977;16:1201–22. doi: 10.1002/bip.1977.360160604. [DOI] [PubMed] [Google Scholar]
- 8.Driessen NJB, Cox MAJ, Bouten CVC, Baaijens FPT. Remodelling of the angular collagen fiber distribution in cardiovascular tissues. Biomech Model Mechanobiol. 2008;7:93–103. doi: 10.1007/s10237-007-0078-x. [DOI] [PMC free article] [PubMed] [Google Scholar]
- 9.Fridez P, Zulliger M, Bobard F, Montorzi G, Miyazaki H, Hayashi K, Stergiopulos N. Geometrical, functional, and histomorphometric adaptation of rat carotid artery in induced hypertension. J Biomech. 2003;36:671–680. doi: 10.1016/s0021-9290(02)00445-1. [DOI] [PubMed] [Google Scholar]
- 10.Fung Y. On the foundations of biomechanics. Journal of Applied Mechanics. 1983;50:1003. [Google Scholar]
- 11.Hariton I, de Botton G, Gasser TC, Holzapfel GA. Stress-driven collagen fiber remodeling in arterial walls. Biomech Model Mechanobiol. 2007;6:163–75. doi: 10.1007/s10237-006-0049-7. [DOI] [PubMed] [Google Scholar]
- 12.Holzapfel GA, Gasser TC, Ogden RW. A new constitutive framework for arterial wall mechanics and a comparative study of material models. Journal of elasticity. 2000;61:1–48. [Google Scholar]
- 13.Hu J-J, Ambrus A, Fossum TW, Miller MW, Humphrey JD, Wilson E. Time courses of growth and remodeling of porcine aortic media during hypertension: a quantitative immunohistochemical examination. J Histochem Cytochem. 2008;56:359–70. doi: 10.1369/jhc.7A7324.2007. [DOI] [PMC free article] [PubMed] [Google Scholar]
- 14.Hu J-J, Fossum TW, Miller MW, Xu H, Liu J-C, Humphrey JD. Biomechanics of the porcine basilar artery in hypertension. Ann Biomed Eng. 2007;35:19–29. doi: 10.1007/s10439-006-9186-5. [DOI] [PubMed] [Google Scholar]
- 15.Humphrey J, Rajagopal K. A constrained mixture model for growth and remodeling of soft tissues. Mathematical models and methods in applied sciences. 2002;12:407–430. [Google Scholar]
- 16.Humphrey JD. Cardiovascular solid mechanics: cells, tissues, and organs. Springer Verlag. 2002 [Google Scholar]
- 17.Humphrey JD. Vascular adaptation and mechanical homeostasis at tissue, cellular, and sub-cellular levels. Cell Biochem Biophys. 2008;50:53–78. doi: 10.1007/s12013-007-9002-3. [DOI] [PubMed] [Google Scholar]
- 18.Humphrey JD. Mechanisms of arterial remodeling in hypertension: coupled roles of wall shear and intramural stress. Hypertension. 2008;52:195–200. doi: 10.1161/HYPERTENSIONAHA.107.103440. [DOI] [PMC free article] [PubMed] [Google Scholar]
- 19.Humphrey JD, Rajagopal KR. A constrained mixture model for arterial adaptations to a sustained step change in blood flow. Biomech Model Mechanobiol. 2003;2:109–126. doi: 10.1007/s10237-003-0033-4. [DOI] [PubMed] [Google Scholar]
- 20.Karsaj I, Sansour C, Soric J. The modelling of fibre reorientation in soft tissue. Biomechanics and Modeling In Mechanobiology. 2009;8:359–370. doi: 10.1007/s10237-008-0142-1. [DOI] [PubMed] [Google Scholar]
- 21.Langille BL. Arterial remodeling: relation to hemodynamics. Can J Physiol Pharmacol. 1996;74:834–841. [PubMed] [Google Scholar]
- 22.Lehman RM, Owens GK, Kassell NF, Hongo K. Mechanism of enlargement of major cerebral collateral arteries in rabbits. Stroke. 1991;22:499–504. doi: 10.1161/01.str.22.4.499. [DOI] [PubMed] [Google Scholar]
- 23.Rachev A. Theoretical study of the effect of stress-dependent remodeling on arterial geometry under hypertensive conditions. Journal of biomechanics. 1997;30:819–827. doi: 10.1016/s0021-9290(97)00032-8. [DOI] [PubMed] [Google Scholar]
- 24.Rachev A. A model of arterial adaptation to alterations in blood flow. Journal of Elasticity. 2000;61:83–111. [Google Scholar]
- 25.Rachev A, Hayashi K. Theoretical study of the effects of vascular smooth muscle contraction on strain and stress distributions in arteries. Ann Biomed Eng. 1999;27:459–68. doi: 10.1114/1.191. [DOI] [PubMed] [Google Scholar]
- 26.Rodriguez EK, Hoger A, McCulloch AD. Stress-dependent finite growth in soft elastic tissues. J Biomech. 1994;27:455–467. doi: 10.1016/0021-9290(94)90021-3. [DOI] [PubMed] [Google Scholar]
- 27.Rudic RD, Shesely EG, Maeda N, Smithies O, Segal SS, Sessa WC. Direct evidence for the importance of endothelium-derived nitric oxide in vascular remodeling. J Clin Invest. 1998;101:731–736. doi: 10.1172/JCI1699. [DOI] [PMC free article] [PubMed] [Google Scholar]
- 28.Taber LA. A model for aortic growth based on fluid shear and fiber stresses. J Biomech Eng. 1998;120:348–54. doi: 10.1115/1.2798001. [DOI] [PubMed] [Google Scholar]
- 29.Taber LA, Eggers DW. Theoretical study of stress-modulated growth in the aorta. J Theor Biol. 1996;180:343–357. doi: 10.1006/jtbi.1996.0107. [DOI] [PubMed] [Google Scholar]
- 30.Taylor CA, Humphrey JD. Open Problems in Computational Vascular Biomechanics: Hemodynamics and Arterial Wall Mechanics. Comput Methods Appl Mech Eng. 2009;198:3514–3523. doi: 10.1016/j.cma.2009.02.004. [DOI] [PMC free article] [PubMed] [Google Scholar]
- 31.Vaishnav R, Vossoughi J. Biomedical Engineering II: Recent Developments. Pergamon Press; NewYork: 1983. Estimation of Residual Stress inAortic Segments; pp. 330–333. [Google Scholar]
- 32.Valentín A, Cardamone L, Baek S, Humphrey JD. Complementary vasoactivity and matrix remodelling in arterial adaptations to altered flow and pressure. J R Soc Interface. 2009;6:293–306. doi: 10.1098/rsif.2008.0254. [DOI] [PMC free article] [PubMed] [Google Scholar]
- 33.Valentín A, Humphrey JD. Parameter sensitivity study of a constrained mixture model of arterial growth and remodeling. J Biomech Eng. 2009;131:101006. doi: 10.1115/1.3192144. [DOI] [PMC free article] [PubMed] [Google Scholar]
- 34.Valentín A, Humphrey JD. Evaluation of fundamental hypotheses underlying constrained mixture models of arterial growth and remodelling. Philos Transact A Math Phys Eng Sci. 2009;367:3585–606. doi: 10.1098/rsta.2009.0113. [DOI] [PMC free article] [PubMed] [Google Scholar]
- 35.Wicker BK, Hutchens HP, Wu Q, Yeh AT, Humphrey JD. Normal basilar artery structure and biaxial mechanical behaviour. Comput Methods Biomech Biomed Engin. 2008;11:539–51. doi: 10.1080/10255840801949793. [DOI] [PubMed] [Google Scholar]
- 36.Zeinali-Davarani S, Choi J, Baek S. On parameter estimation for biaxial mechanical behavior of arteries. J Biomech. 2009;42:524–30. doi: 10.1016/j.jbiomech.2008.11.022. [DOI] [PubMed] [Google Scholar]


