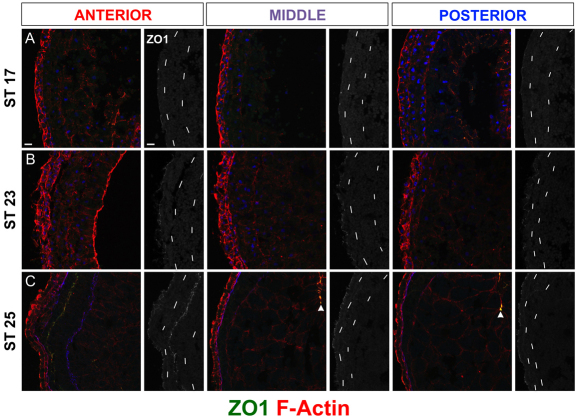
Fig. 2.
LPM undergoes symmetric epithelial polarization after Xnr1/Lefty expression. Anterior, middle and posterior transverse cryosections showing F-actin (Phalloidin, red), ZO1 (green) and nuclei or ECM [blue, DAPI (A,B), Laminin (C)]; 40× images. ZO1 alone (left side shown) is in grayscale, chained lines indicate LPM epidermal/endodermal boundaries. (A) Stage 17, LPM is not yet polarized. ZO1 puncta indicate tight junctions in polarized epidermal layer; no puncta are apparent within LPM at stages before asymmetric Xnr1/Lefty expression. (B) Stage 23, unpolarized LPM during peak Xnr1/Lefty expression. (C) Stage 25, punctate ZO1 signal appears at somatic/splanchnic interface in anterior left and right LPM; at this stage, asymmetric Xnr1/Lefty expression is waning. Arrowheads in C indicate ZO1 in epithelial archenteron. Scale bars: 20 μm.

