

Abstract
Acute infection with Trypanosoma cruzi, the aetiological agent of Chagas’ disease, results in parasitaemia and polyclonal lymphocyte activation. It has been reported that polyclonal B-cell activation is associated with hypergammaglobulinaemia and delayed parasite-specific antibody response. In the present study we analysed the development of a B-cell response within the different microenvironments of the spleen during acute T. cruzi infection. We observed massive germinal centre (GC) and extrafollicular (EF) responses at the peak of infection. However, the EF foci were evident since day 3 post-infection (p.i.), and, early in the infection, they mainly provided IgM. The EF foci response reached its peak at 11 days p.i. and extended from the red pulp into the periarteriolar lymphatic sheath. The GCs were detected from day 8 p.i. At the peak of parasitaemia, CD138+ B220+ plasma cells in EF foci, red pulp and T-cell zone expressed IgM and all the IgG isotypes. Instead of the substantial B-cell response, most of the antibodies produced by splenic cells did not target the parasite, and parasite-specific IgG isotypes could be detected in sera only after 18 days p.i. We also observed that the bone marrow of infected mice presented a strong reduction in CD138+ B220+ cells compared with that of normal mice. Hence, in acute infection with T. cruzi, the spleen appears to be the most important lymphoid organ that lodges plasma cells and the main producer of antibodies. The development of a B-cell response during T. cruzi infection shows features that are particular to T. cruzi and other protozoan infection but different to other infections or immunization with model antigens.
Keywords: antibody responses, B cells, Chagas’ disease, germinal centre, parasite
Introduction
Chagas’ disease is a chronic disease that constitutes a public health problem in Latin America and represents one of the greatest tropical disease burdens after malaria and schistosomiasis.1Trypanosoma cruzi, the protozoan blood-circulating parasite responsible for Chagas’ disease, triggers the production of parasite-specific and autoreactive antibodies as well as of high levels of antibodies with unknown specificity.2 In experimental infection in mice the parasite-specific antibody response is detectable only after 2 weeks of infection, when parasitaemia is high. Interestingly, the parasite-specific response is maximal after 4 weeks of infection and remains at a plateau during the chronic phase when parasites are rare.3 In contrast to the humoral response in the chronic stage, which shows a preferential IgG2a pattern, the anti-T. cruzi response in murine acute infection comprises all the different immunoglobulin isotypes: IgM, IgG1, IgG3, IgG2a and IgG2b.3
The humoral response elicited against the parasite antigens is critical to control the spread of parasites.4,5 Indeed, we reported that signals that enhance plasma cell differentiation and antibody secretion promote parasite clearance.6 Nevertheless, the immune response induced during infection does not seem to be sufficient to completely eradicate the pathogen and, therefore, allows chronic infection. The causes of this incomplete parasite clearance in the presence of a considerable humoral response are a matter of study. Most of the studies addressing the impact of T. cruzi infection on B-cell compartments have been focused on antibody production, the final product of plasma cells, or on B-cell populations analysed by flow cytometry.3,7,8 At present there is not an overall picture about how the generation of antibody response occurs during an ongoing T. cruzi infection.
In a typical response against a foreign protein, B cells start to proliferate and differentiate into antibody-secreting cells after the encounter with the antigen in the presence of T-cell help. After B-cell receptor engagement, activated B cells migrate to the interface between the T-cell and B-cell zones and expand as a consequence of signals derived from CD4+ helper T cells.9 Later, activated B cells can migrate to either the follicles to form germinal centres (GC) or the bridging channels and red pulp of the spleen to form extrafollicular (EF) foci. In GC, proliferating B cells expand within a mantle zone of naive follicular B cells as secondary follicles. There, B blasts undergo affinity maturation through somatic hypermutation followed by selection based on antigen and T-cell recognition.10–12 A proportion of the antigen-selected B cells eventually differentiate into plasmablasts/plasma cells or memory B cells. In the spleen, EF B-cell proliferation and plasma cell differentiation occur in the periarteriolar lymphocytic sheaths (PALS). In T-cell-dependent EF responses, plasma cells secrete antibodies that may be either switched or unswitched (IgM),9,13 but that are in general of modest affinity.
The humoral response during infectious processes differs considerably from the standard response triggered by model purified protein antigens. Perhaps the antigenic mosaic and the inflammatory response induced by the different micro-organisms are responsible for the complex humoral response they cause. For example, in mice Salmonella induces a massive EF response the induction of which is T-cell-independent but where immunoglobulin switching is T-cell-dependent. This T-cell-independent induction reflects, in part, the ability of Salmonella cell wall proteins to be recognized by B1b cells.14,15 In contrast to EF responses that are rapid, GC formation is delayed until 1 month after infection.14 In other infections, such as those with Leishmania major, substantial GCs are detectable by 5 days post-infection (p.i.), and can account for approximately 10% of white pulp area at this time.16 This emphasizes that B-cell responses to pathogens can vary depending upon the characteristics of the pathogen and the infection. Elucidating how these responses develop is likely to help in understanding how and when antibodies can help control the infection and prevent further re-infection.
In this work we performed a detailed immunohistological analysis of the spleen of T. cruzi-infected mice at different intervals after infection, and we correlated these findings with antibody production. Our results describe the remarkable features of the splenic B-cell response during an ongoing T. cruzi infection, providing new information to understand how parasite-specific and parasite-non-specific humoral responses develop.
Material and methods
Reagents
RPMI-1640 and red blood cell lysis buffer (Sigma Aldrich, St Louis, MO); l-glutamine (Life Technologies, Paisley, UK) and fetal bovine serum (Gibco, Grand Island, NY) were used; other chemical reagents were of analytical grade.
Infection with T. cruzi
BALB/c mice were originally obtained from Comisión Nacional de Energía Atómica, Buenos Aires, Argentina and housed in our animal facility, where all experiments were performed in compliance with the Institutional Review Board and Ethical Committee of the School of Chemical Sciences, National University of Cordoba. BALB/c mice, 6–8 weeks old, were intraperiteonally infected with 500 trypomastigotes from T. cruzi (Tulahuén strain) diluted in physiological solution, as previously described.17 Non-infected normal littermates were injected intraperitoneally with physiological solution and processed in parallel. At different times after infection blood was collected by retro-orbital bleeding and after that, mice were killed by cervical dislocation and the spleen, lymph organs, bone marrow and peritoneal cells were obtained.
Parasitaemia counts
After blood collection, erythrocytes were lysed in a 0·87% ammonium chloride buffer, and viable trypomastigotes were counted in a Neubauer counting chamber.18
Cell preparation
Spleens obtained in one experimental group were prepared for histology and immunohistology. In other experimental groups, spleens and inguinal lymph nodes were obtained and homogenized through a tissue strainer. Peritoneal cells were obtained by peritoneal washouts and bone marrow cells were isolated by flushing femurs and tibias of mice with RPMI-1640. When it was necessary, red blood cells were lysed for 5 min in Tris–ammonium chloride buffer. Viable mononuclear cell numbers were determined by trypan blue exclusion using a Neubauer counting chamber.
Flow cytometry studies
Spleen or bone marrow cell suspensions were washed twice in ice-cold FACS buffer (Physiological solution, 2% fetal bovine serum) and pre-incubated with anti-mouse CD32/CD16 monoclonal antibody (mAb; Fc block) for 30 min at 4°. The cells were then incubated with each phycoerythrin, FITC, or biotinylated antibody purchased from BD Pharmingen (Franklin Lakes, NJ) for 30 min at 4° and washed with FACS buffer. Data were acquired on a FACSCanto II cytometer (Becton Dickinson, San Jose, CA) and analysed using Facsdiva (Becton Dickinson) software.
Immunohistology
Spleens were wrapped in aluminium foil snap, frozen by repeated dipping in liquid nitrogen and stored at − 70°. Spleens were embedded in cold OCT compound (Sakura, Zoeterwede, the Netherlands), and serial 5-μm cryosections were mounted on four-spot glass slides (Hendley Essex, Loughton, UK), air-dried before fixation in acetone at 4° for 20 min, and stored at − 20°. The following reagents were used: rat anti-mouse CD3 (KT3) and rat anti-mouse IgM (LO MM 9; Serotec, Oxford, UK); rat anti-mouse syndecan-1 (CD138, 09341D; BD PharMingen, Oxford, UK); rat anti-mouse IgG1, IgG2a, IgG2b and IgG3 (Serotec, UK); biotinylated peanut agglutinin (PNA; Vector Laboratories, Burlingame, CA); rabbit anti-mouse Ki67 (a gift from Johannes Gerdes, Borstel, Germany), swine anti-rabbit immunoglobulin, rabbit anti-horseradish peroxidase (HRP) complexes, biotinylated rabbit anti rat immunoglobulin and alkaline phosphatase-labelled StreptABC complex (Dako, Cambridgeshire, UK), sheep anti-mouse IgD, HRP-labelled donkey anti-sheep/goat immunoglobulin (The Binding Site, Birmingham, UK).
Immunohistology was performed as previously described.19 In brief, primary antibodies were added to thawed sections for 1 hr at room temperature, followed by washing and HRP- or biotin-labelled secondary antibodies for 45 min. After another wash, alkaline phosphatase-labelled StreptABC complex was added. The HRP activity was detected with freshly prepared diaminobenzidine tetrahydrochloride solution containing hydrogen peroxide. Alkaline phosphatase activity was detected using the substrate Naphthol AS MX phosphate (0·4 mg/ml) and the chromogen Fast Blue BB salt (1 mg/ml; Sigma Aldrich, Poole, UK) in 50 mm Tris-buffered saline (pH 9·2), containing 0·8 mg/ml levamisole (Sigma Aldrich) to inhibit endogenous phosphatases, and 3·8% v/v N,N-dimethylformamide (Sigma Aldrich). The slides were then mounted in Immu-Mount (Thermo Shandon, Pittsburgh, PA).
Total immunoglobulin determination
Splenic cells from normal or T. cruzi-infected mice were cultured with medium for 30 hr. Total IgM and IgG isotype levels (in ng/ml) were determined by ELISA as previously described.18,20 In brief, plates were coated with 2·5 μg/ml of the isotype-specific goat anti-mouse antibody (IgM, IgG1, IgG2a, IgG2b and IgG3; Sigma Aldrich) overnight at 4°, and blocked with 1% BSA. Culture supernatants were incubated overnight at 4°. Peroxidase conjugate anti-mouse IgG or anti-mouse IgM (2·5 μg/ml) were added and incubated for 1 hr at 37°. The reaction was developed with TMB Substrate Reagent (BD OptEIA™). The concentration was measured with reference to standard curves using known amounts of the respective murine immunoglobulin isotypes (Sigma Aldrich).
Parasite-specific serum antibody determination
For ELISA, T. cruzi antigens were prepared from epimastigote (Tulahuén strain) harvested from cultures in monophasic medium.21 The epimastigotes were broken by three cycles of freezing at − 20° and thawing. The freeze–thawed parasites were centrifuged at 105 000 g for 30 min at 4° and the supernatant (F105) was used as antigen for ELISA.22 The titres of T. cruzi-specific seric IgM and IgG subclasses were determined at intervals after infection by ELISA as described.22,23 The ELISA test sera were considered positive if the mean optical density value was two standard deviations above the mean value for control sera assayed in parallel.
Statistical analysis
Statistical significance of comparisons of mean values was assessed by a two-tailed Student’s t-test or non-parametric Mann–Whitney U-test using Graph pad software. In the case of T. cruzi-specific antibodies, mean values were assessed by a one-way non-parametric Kruskal–Wallis test. P< 0·05 was considered significant.
Results
T. cruzi infection generated an increase in splenic B-cell populations
It has been previously shown that T. cruzi infection induces a marked increase in the number of total splenic B cells.7 Using flow cytometry, we found that T. cruzi-infected mice showed an increase in B220+ IgM+ IgD+ (mature B2) (Fig. 1a) and B220+ IgM+ IgD– cells (immature and/or activated B cells) (Fig. 1b). A population of B220+ IgM– IgD– cells was also increased (Fig. 1c). This population is probably comprised of plasmablast and/or plasma cells because no changes in B220+ dendritic cells were detected (data not shown).
Figure 1.
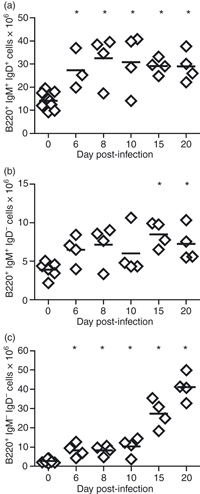
B-cell subset numbers in Trypanosoma cruzi infection. Splenic cells from normal (day 0) or T. cruzi-infected mice were obtained at different days post infection (p.i.). Graphs show absolute number of (a) IgM+ IgD+ B220+ cells (mature B2 cells), (b) IgM+ IgD− B220+ cells (immature and/or activated B cells) and (c) IgM− IgD− B220+ cells at different days p.i. Diamonds represent the value obtained from each mouse. The lines represent the median value in each analysed group. The statistically significant difference between normal (day 0) and infected mice is shown as * in each graph (P< 0·01). Results are representative for four individual experiments.
T. cruzi induced massive and persistent splenic EF and GCs B-cell responses
To characterize the features of the B-cell response, and to determine the location of the different B-cell populations including plasmablasts and plasma cells, a detailed immunohistology study in the spleen of T. cruzi-infected mice was performed. Infection with the parasite induced a rapid EF response that preceded GC formation (Fig. 2a) so that EF foci of plasmablasts (CD138+) were detectable by day 3 p.i. Later, by day 18 p.i. EF foci and GCs occupied comparatively similar areas of the spleen and this was sustained at least up to day 32 p.i. (Fig. 2a). The impressive GC formation is shown in Fig. 2(b). The GCs were observed as packed Ki67+ proliferating cells (upper photograph), unstained areas (middle photograph) and as PNA+ areas (lower photograph). By this time EF areas containing non-proliferating (Ki67–) CD138+ plasmacytoid cells could be distinguished. Interestingly, when parasitaemia reached its highest level (between days 11 and 15 p.i.; see Supplementary Information Fig. S1), a massive EF response could be observed. Figure 3 shows the EF plasmacytoid cells (CD138+, Fig. 3a) extended inside from the classical sites of EF plasmablast growth and displaced broad sections of the T-cell zones (CD3+) (Fig. 3b). Although plasmacytoid cells occupied a substantial portion of the white pulp where T cells are normally found, apparently, T cells and plasmacytoid cells did not overlap (Fig. 3). This invasion of T-cell zone space is not a distinct characteristic of T. cruzi infection. In fact, a similar picture is observed in infections produced by other parasites, such as Plasmodium.24,25
Figure 2.
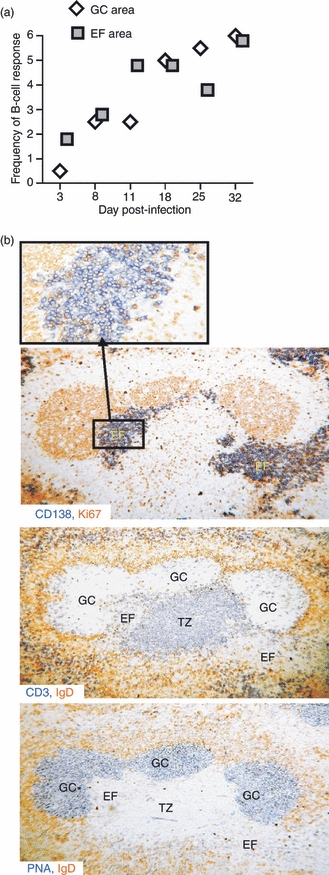
Germinal centres (GCs) and extrafollicular (EF) splenic B-cell responses in T. cruzi infection. (a) Semi-quantitative histological analysis of splenic B-cell response. Slides from the immunohistological analysis were assessed by two people independently as the extent of reaction in arbitrary units (zero = the level seen in non-infected mice and 6 = a maximum response). The mean score for four mice in each group at each time-point is depicted. GCs were identified as PNA+ Ki67+ areas. EF foci were defined as CD138+ PNA− Ki67−. (b) Photomicrographs of serial sections from the same spleen obtained from 32-day Trypanosoma cruzi-infected mice stained with: anti-Ki67 and anti-CD138 (upper photograph), anti-IgD and anti-CD3 (middle photograph) and anti-IgD and peanut agglutinin (PNA; lower photograph). The inset shows, at high power, Ki67 expression by some of the plasmacytoid cells in part of an EF focus. The sections shown are representative of four mice at this time-point. GC, germinal centre; EF, extrafollicular; TZ, T-cell zone.
Figure 3.
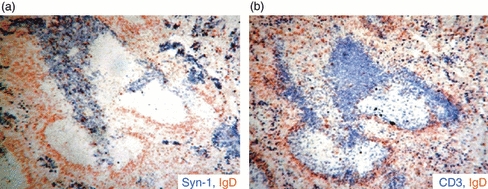
Extrafollicular (EF) foci in Trypanosoma cruzi-infected mice infiltrate T-cell zone Photomicrograph of serial sections from the same spleen obtained from 11-day T. cruzi-infected mice stained with: anti-CD138, anti-IgD and anti-CD3. (a) CD138+ EF focus stained blue and IgD+ B cells (follicular mantle) stained brown; (b) CD3+ T cells in blue and the follicular mantle in brown.
Most GCs developed, as expected, within follicles, but from day 18 of infection T. cruzi-infected mice also had ectopic proliferating GC structures in the red pulp consisting of elongated collections of PNA+ Ki67+ cells (Fig. 4a). A representative photograph of immunohistology shows ectopic GC-like structures that are PNA+ (stained in blue), surrounded by the follicular mantle (IgD+ cells, stained in brown) (Fig. 4b). Taken together, the results demonstrate that both GC (follicular) and EF B-cell responses were mounted in mice with experimental Chagas’ disease.
Figure 4.
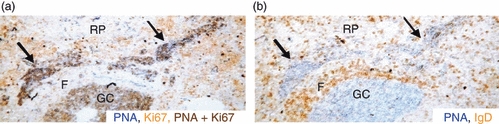
Trypanosoma cruzi infection induces ectopic germinal centres (GC). Photomicrograph of serial sections from the same spleen obtained from 18-day T. cruzi-infected mice stained with: peanut agglutinin (PNA), anti-IgD and anti-Ki67. Photograph shows ectopic GC tissue in the red pulp (RP). (a) Ectopic PNA+ Ki67+ cells double stained in dark brown, (b) a PNA+ GC stained blue surrounded by follicular mantle (F) with IgD+ B cells stained brown. Elongated collections of PNA+ GC-like cells in the red pulp are indicated by arrows.
Immunoglobulins production by EF and GC responses
Analysing the antibody isotype profile expressed by plasma cells in EF foci, red pulp and T-cell zone by immunohistology, we observed that until 11 days p.i. IgM was mainly expressed by EF plasma cells (Fig. 5a). By 18 days p.i., EF plasma cells and plasma cells in the red pulp and T-cell zone expressed IgM, IgG2a, IgG3 and also IgG1, although at lower level. On days 25 and 32 p.i. the majority of plasma cells switched equally to all IgG isotypes (Fig. 5b).
Figure 5.
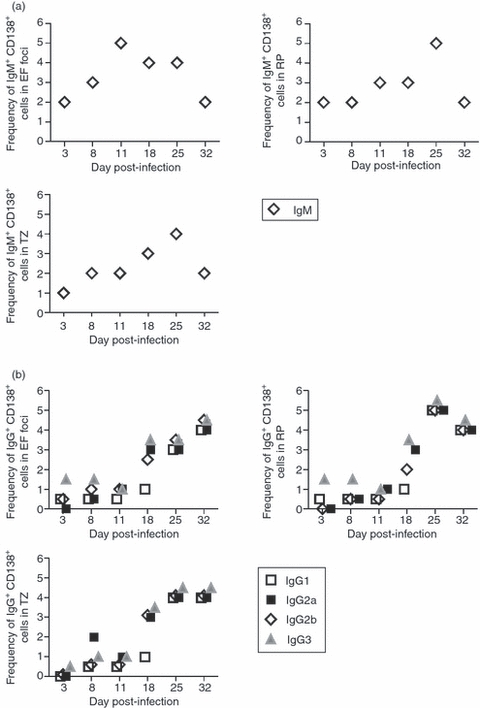
Immunoglobulin expression in plasma cells from extrafollicular (EF) foci, red pulp and T-cell zones. Semi-quantitative histological analysis of immunoglobulin expression in CD138+ cells. Slides from the immunohistological analysis were assessed by two people independently as the extent of reaction in arbitrary units (zero = the level seen in non-infected mice, and 6 = a maximum response) and the mean score for four mice in each group at each time-point is depicted. CD138+ IgM+ (a) or CD138+ IgG isotypes+ (b) cells were identified in EF foci, red pulp and T-cell zone by the staining with: anti-CD138, anti-IgM, anti-IgG1, anti-IgG2a, anti-IgG2b, anti-IgG3, peanut agglutinin (PNA), anti-IgD and anti-CD3. EF, extrafollicular; TZ, T-cell zone; RP, red pulp.
As an indirect way to quantify the immunoglobulin production by plasmablast/plasma cells described above, we studied the concentration of immunoglobulin isotypes in the culture supernatant of splenic cells incubated for 48 hr. Splenocytes from mice with 8 days of infection secreted increased levels of IgG2a and IgG3 compared with splenocytes from non-infected control and these levels remained elevated at all subsequent times. Levels of IgM remained comparable to those in controls in most cultures, although a small, but significant, increase in IgM concentration was detected in the culture supernatant of splenocytes obtained at days 11 and 18 p.i. IgG1 levels increased after 11 days of infection but less than IgG2a (Fig. 6). Indeed, the isotype IgG2a dominated the antibody response by splenic B cells with > 300 ng/ml of antibody detected from day 18 p.i. Despite the high concentration of antibodies quantified in culture supernatants, no reactivity against parasite antigens was detected by ELISA using either parasite lysates or recombinant antigens (data not shown). In contrast, serum parasite-specific IgM was detectable after day 11 of infection and reached peak titres on day 18 p.i. (Fig. 7). The detection of peak titres coincided with the fall in parasitaemia (see Supplementary Information Fig. S1). Specific IgG1 and IgG2a were present at day 18 and rose further on days 25 and 32. Although switching to all four IgG subclasses was seen after 18 days of infection, IgG2b and IgG3 appeared earlier than IgG1 and IgG2a (Fig. 7).
Figure 6.
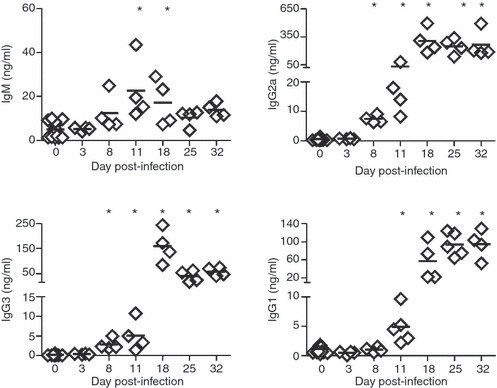
Immunoglobulin production by spleen cells from Trypanosoma cruzi-infected mice. IgM and IgG isotype concentrations, determined by ELISA, in culture supernatant of splenic cells obtained from normal (day 0) or T. cruzi-infected mice at different days post-infection. Diamonds represent the value obtained from each mouse. The lines represent the median value in each analysed group. The significant difference between normal (day 0) and infected mice is indicated by * (P< 0·05). Results are representative for four individual experiments.
Figure 7.
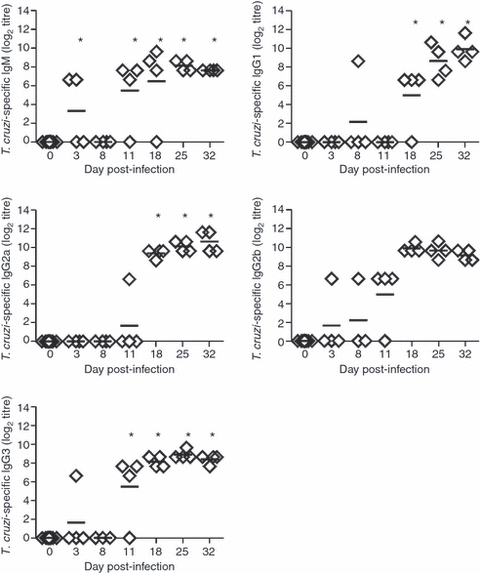
Parasite-specific antibodies in sera from Trypanosoma cruzi-infected mice. T. cruzi-specific IgM and IgG isotypes titres were determined by ELISA in sera from normal (day 0) or T. cruzi-infected mice at different days post-infection. Test sera were considered positive if the mean optical density value was two standard deviations above the mean value for control sera. Diamonds represent the value obtained from each mouse. The lines represent the median value in each analysed group. The significant difference between normal (day 0) and infected mice is indicated by * (P< 0·05). Results are representative for four individual experiments.
Massive splenic B-cell response is a high source of antibodies in T. cruzi infection
It has been demonstrated that plasma cells can survive for long periods in the appropriate niches. The migration of plasmablasts from the spleen to these niches, such as the bone marrow, is important for the generation of long-lived antibody responses,26,27 which are necessary for protection against further infection. To analyse whether the massive plasmablast generation provided plasma cells for the bone marrow, we evaluated the presence of plasma cells (B220+ CD138+) in the bone marrow of T. cruzi-infected mice. We observed that T. cruzi-infected mice undergoing the acute phase of infection (days 8 and 18 p.i.), showed a large reduction in the percentage (Fig. 8a) and number of CD138+ cells in the bone marrow (Fig. 8b).
Figure 8.
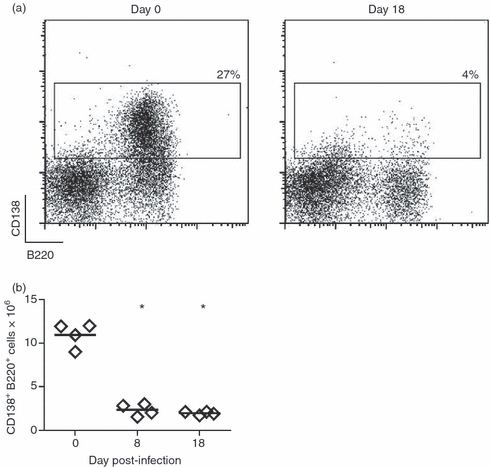
Plasma cells are absent in the bone marrow of Trypanosoma cruzi-infected mice. Bone marrow cells were obtained from non-infected (day 0) or T. cruzi-infected mice (day 8 and 18) and incubated with anti-B220 and anti-CD138 and analysed by flow cytometry. Graphs show in (a) are representative plots of CD138 versus B220 with the percentages of CD138+ B220+ cells, and in (b) are the absolute number of B220+ CD138+cells on different days of infection. Diamonds represent the value obtained from each mouse. The lines represent the median value in each analysed group. The significant difference between normal (day 0) and infected mice is indicated by * (P< 0·05). Results are representative for two individual experiments.
Based on the absence of plasma cells in bone marrow, and to compare the contribution of splenic antibody-secreting cells to the pool of circulating antibodies with that of other lymphoid organs, we determined the concentrations of immunoglobulins produced by the cells from spleen, inguinal lymph nodes, peritoneum and bone marrow. The values were expressed as immunoglobulin concentration/lymphoid tissue total cells. Spleen was the most important source of all IgG isotypes, providing more than 100 000 ng total IgG, followed by inguinal lymph nodes and peritoneal cavity (Fig. 9). In accordance with the low number of plasma cells, the production of immunoglobulins by bone marrow was almost undetectable (data not shown).
Figure 9.
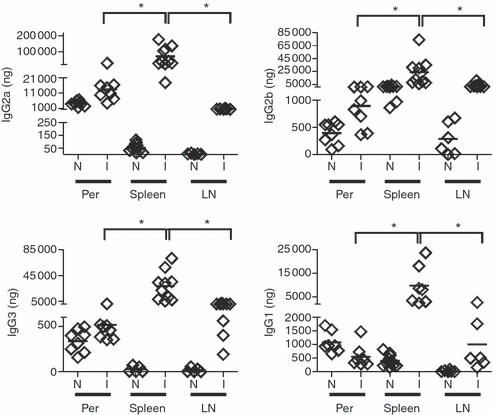
Spleen of Trypanosoma cruzi-infected mice is the main immunoglobulin-producing lymphoid organ. Mononuclear cells from spleen, peritoneum (Per) and inguinal lymph nodes (LN) were obtained from normal (N) or 18-day T. cruzi-infected mice, counted in a Neubauer chamber and incubated for 30 hr at 37° in 5% CO2 without stimulus. IgG isotype concentration was determined in the culture supernatant of 2 × 10⁶ cells/ml by ELISA. The values expressed as amount of immunoglobulins/lymphoid tissue mononuclear cells were depicted in ordinates. Diamonds represent the value obtained from each mouse. The lines represent the median value in each analysed group. The significant difference between normal (day 0) and infected mice is indicated by * (P< 0·05). Results are representative for three individual experiments.
Discussion
Minoprio et al.7,8 reported that T. cruzi infection increases the number of B cells. Two weeks after parasite infection most cells in spleen and lymph nodes are enlarged and more than half are dividing and activated B cells are still detected at the chronic phase of infection. The intense B-cell response is polyclonal and most of this massive response is not specific to the parasite antigens.2 Therefore, it has been postulated that the polyclonal B-cell response may contribute to a delayed parasite-specific humoral response and hence promote infection.2,3,28–30 In this study we extend previously reported data,2,7,8 performing a detailed analysis of the kinetics of the B-cell response in T. cruzi-infected mice and its association with the emergence of parasite-specific antibodies.
Our study demonstrates that even though T. cruzi infection induces early, persistent and massive EF and follicular plasmablast responses together with classical and ectopic GCs, infected mice have a delayed parasite-specific antibody response. The EF antibody response in mice infected with T. cruzi was evident from day 3 of infection and reached a peak after 18 days after infection. These long-lasting/extended kinetics of the EF response could be characteristic of infections caused by blood-circulating protozoan parasites.24 In fact, in Plasmodium chabaudi chabaudi infection EF plasmablasts are visible from day 4 and by day 10 they are unconventionally sited in the periarteriolar region of the white pulp. In this region, EF plasmablasts form clusters occupying part of the area normally filled by T cells.24 In contrast, viruses and bacteria induce very early protective EF responses. Indeed, the vesicular stomatitis virus induces an early differentiation of EF plasma cells that peaks between day 2 and 3 p.i. and produces mainly vesicular stomatitis virus-specific IgM but also low levels of specific IgG.31 During Salmonella infection, an EF antibody response with accelerated switching to IgG2c is well established by day 3 p.i.,14 possibly as the result of the fast recruitment of B1b cells to the response.15 In contrast to the Salmonella infection, where the EF response is enough to impede the extracellular spreading of the infectious agent,14 we determined that the early EF antibody response observed in T. cruzi-infected mice was apparently not efficient to control parasite replication because parasitaemia decreased after 18 days of infection, long after the EF response is established.
The kinetics of the appearance of GCs during T. cruzi infection are similar to those observed after immunization with classical haptenated proteins, where GCs are visible within 8 days of immunization.10 However, the GC and EF responses triggered by T. cruzi were larger and more persistent than those typically observed in responses to conventional test antigens.19,32 In addition, we detected functional (antibody-producing) GCs in atypical sites. The GCs in the spleens of T. cruzi-infected mice persisted for at least 32 days, which resembled the kinetics of the response seen in P. chabaudi,24L. amazonensis33 and murine mammary virus19 infections.
A key finding in this study is that antibodies are rapidly secreted during infection, whereas antigen-specific antibodies were not detected until the third week of infection. In agreement with Minoprio et al.,2 our results showed that the initial humoral response triggered by T. cruzi infection is dominated by the production of IgG2a isotype and that the appearance of a parasite-specific antibody response correlates with a decrease in the number of circulating parasites (see Supplementary Information Fig. S1). As parasite-specific IgG1 and IgG2b can help to restrict parasite replication34,35 and modest levels of IgM were detected, mainly the IgG isotypes are likely to be important for parasite clearance. Although the total antibody response is dominated by IgG2a, the parasite-specific response does not present any particular IgG isotype predominance.
T cells are likely to be important for directing the efficacy of the specific response to parasite antigen because T cells are involved in GC formation, somatic hypermutation and affinity maturation.35 The localization of some plasmablasts and plasma cells in the T-cell zone of the spleen during T. cruzi infection did not affect the total T-cell number as the absolute T-cell number increased during the infection (data not shown and ref. 7). Considering the high amount of total antibodies produced during the infection, the displacement of T cells would not affect the extent of the ongoing B-cell response. However, it may affect the quality of the B-cell response potentiating T-cell-dependent polyclonal B-cell activation36 to the detriment of a parasite-specific antibody response.
Switched plasmablasts leaving GCs often migrate to distant sites of antibody production such as the bone marrow where they might have longer life spans as a consequence of increased availability of survival factors.37–39 In this study, we detected few plasma cells in the bone marrow of T. cruzi-infected mice, suggesting that either plasma cells differentiated in spleen were unable to reach bone marrow or bone marrow may not sustain plasma cell survival during the early phase of the infection. In any case, the absence of plasma cells in bone marrow may be a consequence of an altered chemokine expression in bone marrow stromal cell.37,39 Although practically absent in bone marrow, a high number of CD138+ plasma cells lodged in the spleen during the acute phase of T. cruzi infection. Also, lymph nodes and the peritoneal cavity of T. cruzi-infected mice presented antibody-secreting cells. However, the ability of these cells to produce immunoglobulins was different depending on the lymphoid compartment they belonged to. Hence, peritoneum of infected mice presented low-frequency antibody-secreting cells that released high concentrations of immunoglobulins,40 whereas the spleen lodged a high number of plasma cells that released the same amount of immunoglobulins as lymph node plasma cells.
By further characterizing the development of the B-cell response, the present study provides a detailed understanding of the development of total versus parasite-specific humoral responses during T. cruzi infection. This response has shown features that are particular to T. cruzi and other protozoan infections but different from those of other infections or from immunization with test antigens. To understand the unique features of B-cell responses during an infection process is essential to the design of potential immune intervention strategies.
Acknowledgments
We are grateful to Renata Defagó for the language corrections. E.V.A.R., C.L.M. and A.G. are members of the Scientific Career of CONICET. This work received financial support from CONICET, ANPCyT, SECYT UNC to AG.f
Glossary
Abbreviations:
- EF
extrafollicular
- GC
germinal centre
- PALS
periarteriolar lymphatic sheath
- PNA
peanut agglutinin
Disclosures
The authors have declared that no competing interests exist.
Supporting Information
Additional Supporting Information may be found in the online version of this article:
Figure S1. Parasitaemia in Trypanosoma cruzi-infected mice.
Please note: Wiley-Blackwell are not responsible for the content or functionality of any supporting materials supplied by the authors. Any queries (other than about missing material) should be directed to the corresponding author for the article.
References
- 1.Hotez PJ, Bottazzi ME, Franco-Paredes C, et al. The neglected tropical diseases of Latin America and the Caribbean: a review of disease burden and distribution and a roadmap for control and elimination. PLoS Negl Trop Dis. 2008;2:e300. doi: 10.1371/journal.pntd.0000300. [DOI] [PMC free article] [PubMed] [Google Scholar]
- 2.Minoprio P, Burlen O, Pereira P, et al. Most B cells in acute Trypanosoma cruzi infection lack parasite specificity. Scand J Immunol. 1998;28:553–61. doi: 10.1111/j.1365-3083.1988.tb01487.x. [DOI] [PubMed] [Google Scholar]
- 3.Spinella S, Liegeard P, Hontebeyrie-Joskowicz M. Trypanosoma cruzi: predominance of IgG2a in nonspecific humoral response during experimental Chagas’ disease. Exp Parasitol. 1992;74:46–56. doi: 10.1016/0014-4894(92)90138-z. [DOI] [PubMed] [Google Scholar]
- 4.Kierszenbaum F, Howard JG. Mechanisms of resistance against experimental Trypanosoma cruzi infection: the importance of antibodies and antibody-forming capacity in the Biozzi high and low responder mice. J Immunol. 1976;116:1208–11. [PubMed] [Google Scholar]
- 5.Sepulveda P, Hontebeyrie M, Liegeard P, et al. DNA-based immunization with Trypanosoma cruzi complement regulatory protein elicits complement lytic antibodies and confers protection against Trypanosoma cruzi infection. Infect Immun. 2000;68:4986–91. doi: 10.1128/iai.68.9.4986-4991.2000. [DOI] [PMC free article] [PubMed] [Google Scholar]
- 6.Acosta-Rodriguez EV, Montes CL, Motran CC, et al. Galectin-3 mediates IL-4-induced survival and differentiation of B cells: functional cross-talk and implications during Trypanosoma cruzi infection. J Immunol. 2004;172:493–502. doi: 10.4049/jimmunol.172.1.493. [DOI] [PubMed] [Google Scholar]
- 7.Minoprio PM, Eisen H, Forni L, et al. Polyclonal lymphocyte responses to murine Trypanosoma cruzi infection. I. Quantitation of both T- and B-cell responses. Scand J Immunol. 1986;24:661–8. doi: 10.1111/j.1365-3083.1986.tb02185.x. [DOI] [PubMed] [Google Scholar]
- 8.Minoprio P, Bandeira A, Pereira P, et al. Preferential expansion of Ly-1 B and CD4– CD8– T cells in the polyclonal lymphocyte responses to murine T. cruzi infection. Int Immunol. 1989;1:176–84. doi: 10.1093/intimm/1.2.176. [DOI] [PubMed] [Google Scholar]
- 9.Maclennan IC, Toellner KM, Cunningham AF, et al. Extrafollicular antibody responses. Immunol Rev. 2003;194:8–18. doi: 10.1034/j.1600-065x.2003.00058.x. [DOI] [PubMed] [Google Scholar]
- 10.Jacob J, Kassir R, Kelsoe G. In situ studies of the primary immune response to (4-hydroxy-3-nitrophenyl)acetyl. I. The architecture and dynamics of responding cell populations. J Exp Med. 1991;173:1165–75. doi: 10.1084/jem.173.5.1165. [DOI] [PMC free article] [PubMed] [Google Scholar]
- 11.Liu YJ, Zhang J, Lane PJ, et al. Sites of specific B cell activation in primary and secondary responses to T cell-dependent and T cell-independent antigens. Eur J Immunol. 1991;21:2951–62. doi: 10.1002/eji.1830211209. [DOI] [PubMed] [Google Scholar]
- 12.Toellner KM, Luther SA, Sze DM, et al. T helper 1 (Th1) and Th2 characteristics start to develop during T cell priming and are associated with an immediate ability to induce immunoglobulin class switching. J Exp Med. 1998;20:187. doi: 10.1084/jem.187.8.1193. [DOI] [PMC free article] [PubMed] [Google Scholar]
- 13.Phan TG, Gardam S, Basten A, et al. Altered migration, recruitment, and somatic hypermutation in the early response of marginal zone B cells to T cell-dependent antigen. J Immunol. 2005;15:174. doi: 10.4049/jimmunol.174.8.4567. [DOI] [PubMed] [Google Scholar]
- 14.Cunningham AF, Gaspal F, Serre K, et al. Salmonella induces a switched antibody response without germinal centers that impedes the extracellular spread of infection. J Immunol. 2007;178:6200–7. doi: 10.4049/jimmunol.178.10.6200. [DOI] [PubMed] [Google Scholar]
- 15.Gil-Cruz C, Bobat S, Marshall JL, et al. The porin OmpD from nontyphoidal Salmonella is a key target for a protective B1b cell antibody response. Proc Natl Acad Sci USA. 2009;106:9803–8. doi: 10.1073/pnas.0812431106. [DOI] [PMC free article] [PubMed] [Google Scholar]
- 16.Smelt SC, Engwerda CR, McCrossen M, et al. Destruction of follicular dendritic cells during chronic visceral leishmaniasis. J Immunol. 1997;158:3813–21. [PubMed] [Google Scholar]
- 17.Zuniga E, Motran CC, Montes CL, et al. Trypanosoma cruzi infection selectively renders parasite-specific IgG+ B lymphocytes susceptible to Fas/Fas ligand-mediated fratricide. J Immunol. 2002;168:3965–73. doi: 10.4049/jimmunol.168.8.3965. [DOI] [PubMed] [Google Scholar]
- 18.Zuniga E, Acosta-Rodriguez E, Merino MC, et al. Depletion of immature B cells during Trypanosoma cruzi infection: involvement of myeloid cells and the cyclooxygenase pathway. Eur J Immunol. 2005;35:1849–58. doi: 10.1002/eji.200526005. [DOI] [PubMed] [Google Scholar]
- 19.Luther SA, Gulbranson-Judge A, cha-Orbea H, et al. Viral superantigen drives extrafollicular and follicular B cell differentiation leading to virus-specific antibody production. J Exp Med. 1997;185:551–62. doi: 10.1084/jem.185.3.551. [DOI] [PMC free article] [PubMed] [Google Scholar]
- 20.Montes CL, Acosta-Rodriguez EV, Mucci J, et al. A Trypanosoma cruzi antigen signals CD11b+ cells to secrete cytokines that promote polyclonal B cell proliferation and differentiation into antibody-secreting cells. Eur J Immunol. 2006;36:1474–85. doi: 10.1002/eji.200535537. [DOI] [PubMed] [Google Scholar]
- 21.Camargo EP. Growth and differentiation in Trypanosoma cruzi. I. Origin of metacyclic trypanosomes in liquid media. Rev Inst Med Trop Sao Paulo. 1964;12:93–100. [PubMed] [Google Scholar]
- 22.Zuniga E, Montes C, Barbieri G, et al. Antibodies against Trypanosoma cruzi alkaline antigens are elicited in sera from acute but not chronic human chagasic patients. Clin Immunol. 1999;93:81–9. doi: 10.1006/clim.1999.4744. [DOI] [PubMed] [Google Scholar]
- 23.Laderach D, Cerban F, Motran C, et al. Trypanosoma cruzi: the major cysteinyl proteinase (cruzipain) is a relevant immunogen of parasite acidic antigens (FIII) Int J Parasitol. 1996;26:1249–54. doi: 10.1016/s0020-7519(96)00099-9. [DOI] [PubMed] [Google Scholar]
- 24.Achtman AH, Khan M, Maclennan IC, et al. Plasmodium chabaudi chabaudi infection in mice induces strong B cell responses and striking but temporary changes in splenic cell distribution. J Immunol. 2003;171:317–24. doi: 10.4049/jimmunol.171.1.317. [DOI] [PubMed] [Google Scholar]
- 25.Carvalho LJ, Ferreira-da-Cruz MF, Daniel-Ribeiro CT, et al. Germinal center architecture disturbance during Plasmodium berghei ANKA infection in CBA mice. Malar J. 2007;6 doi: 10.1186/1475-2875-6-59. 1475-2875-6-59. [DOI] [PMC free article] [PubMed] [Google Scholar]
- 26.Hofer T, Muehlinghaus G, Moser K, et al. Adaptation of humoral memory. Immunol Rev. 2006;211:295–302. doi: 10.1111/j.0105-2896.2006.00380.x. [DOI] [PubMed] [Google Scholar]
- 27.Radbruch A, Muehlinghaus G, Luger EO, et al. Competence and competition: the challenge of becoming a long-lived plasma cell. Nat Rev Immunol. 2006;6:741–50. doi: 10.1038/nri1886. [DOI] [PubMed] [Google Scholar]
- 28.Hontebeyrie-Joskowicz M, Minoprio P. Chagas’ disease: Trypanosoma cruzi vs. the host immune system. Res Immunol. 1991;142:125–6. doi: 10.1016/0923-2494(91)90020-j. [DOI] [PubMed] [Google Scholar]
- 29.Reina-San-Martin B, Degrave W, Rougeot C, et al. A B-cell mitogen from a pathogenic trypanosome is a eukaryotic proline racemase. Nat Med. 2000;6:890–7. doi: 10.1038/78651. [DOI] [PubMed] [Google Scholar]
- 30.Reina-San-Martin B, Cosson A, Minoprio P. Lymphocyte polyclonal activation: a pitfall for vaccine design against infectious agents. Parasitol Today. 2000;16:62–7. doi: 10.1016/s0169-4758(99)01591-4. Review. [DOI] [PubMed] [Google Scholar]
- 31.Fink K, Manjarrez-Orduño N, Schildknecht A, et al. B cell activation state-governed formation of germinal centers following viral infection. J Immunol. 2007;179:5877–85. doi: 10.4049/jimmunol.179.9.5877. [DOI] [PubMed] [Google Scholar]
- 32.Mohr E, Serre K, Manz RA, et al. Dendritic cells and monocyte/macrophages that create the IL-6/APRIL-rich lymph node microenvironments where plasmablasts mature. J Immunol. 2009;182:2113–23. doi: 10.4049/jimmunol.0802771. [DOI] [PubMed] [Google Scholar]
- 33.Abreu-Silva AL, Calabrese KS, Cupolilo SM, et al. Histopathological studies of visceralized Leishmania (Leishmania) amazonensis in mice experimentally infected. Vet Parasitol. 2004;121:179–87. doi: 10.1016/j.vetpar.2004.03.002. [DOI] [PubMed] [Google Scholar]
- 34.Pyrrho AS, Moraes JL, Pecanha LM, et al. Trypanosoma cruzi: IgG1 and IgG2b are the main immunoglobulins produced by vaccinated mice. Parasitol Res. 1998;84:333–7. doi: 10.1007/s004360050406. [DOI] [PubMed] [Google Scholar]
- 35.McHeyzer-Williams LJ, Malherbe LP, McHeyzer-Williams MG. Helper T cell-regulated B cell immunity. Curr Top Microbiol Immunol. 2006;311:59–83. doi: 10.1007/3-540-32636-7_3. Review. [DOI] [PubMed] [Google Scholar]
- 36.Minoprio P, Eisen H, Joskowicz M, et al. Suppression of polyclonal antibody production in Trypanosoma cruzi-infected mice by treatment with anti-L3T4 antibodies. J Immunol. 1987;139:545–50. [PubMed] [Google Scholar]
- 37.Kunkel EJ, Butcher EC. Plasma-cell homing. Nat Rev Immunol. 2003;3:822–9. doi: 10.1038/nri1203. [DOI] [PubMed] [Google Scholar]
- 38.Manz RA, Hauser AE, Hiepe F, et al. Maintenance of serum antibody levels. Annu Rev Immunol. 2005;23:367–86. doi: 10.1146/annurev.immunol.23.021704.115723. 10. [DOI] [PubMed] [Google Scholar]
- 39.Moser K, Tokoyoda K, Radbruch A, et al. Stromal niches, plasma cell differentiation and survival. Curr Opin Immunol. 2006;18:265–70. doi: 10.1016/j.coi.2006.03.004. [DOI] [PubMed] [Google Scholar]
- 40.Merino MC, Montes CL, Acosta-Rodriguez EV, et al. Peritoneum from Trypanosoma cruzi infected mice is a homing site of Syndecan-1neg plasma cells which mainly provide non-parasite specific antibodies. Int Immunol. 2010;22:399–410. doi: 10.1093/intimm/dxq019. [DOI] [PubMed] [Google Scholar]
Associated Data
This section collects any data citations, data availability statements, or supplementary materials included in this article.