
Figure 4.
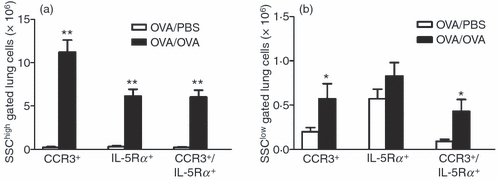
Number of CCR3+-IL-5Rα+ cells in the lung. (a) The number of CCR3+, interleukin-5 receptor α subunit-positive (IL-5Rα+)and CCR3+ IL-5Rα+ cells in the lung, analysed by FACS and gated on SSChigh cell population and (b) gated on SSClow cell population in ovalbumin (OVA) -sensitized/exposed BALB/c mice compared with OVA-sensitized but PBS-exposed mice. Open bars represent PBS-exposed animals and dark bar represents OVA-exposed animals. Data are shown as mean (+ SEM) (n = 5–6). *P< 0·05 and **P< 0·01 between OVA-exposed and PBS-exposed groups.