Abstract
A midsized broad beam Optical-CT scanner is being developed for collaborative research between Duke and the Radiological Physics Center (RPC). The Duke Midsized Optical-CT Scanner (DMOS-RPC) is designed to be compatible with several of the RPC phantoms, including the head and neck, stereotactic SRS, and lung phantoms. Preliminary data investigating the basic performance of the scanner is described. Two 10 cm PRESAGE cylinders were irradiated with simple test plans. Projections of ~80 μm resolution of each dosimeter were collected at 1 degree intervals over a full 360 degrees both before and after irradiation. 3 dimensional reconstructions of attenuation coefficients throughout the dosimeter were computed with 1 mm3 resolution. Scans were normalized to the calculated dose distribution and a 3D comparison was made with a commissioned treatment planning system. Initial results indicate DMOS-RPC can produce accurate relative dose distributions with high spatial resolution (up to 1 mm3 in 3D) in less than 30 minutes (acquisition and reconstruction). A maximum dose of ~3.6Gy was delivered in these tests, and observed noise was ~2% for 1 mm3 reconstructions. Good agreement is observed with the planning system in these simple distributions, indicating promising potential for this scanner.
1. Introduction
The DMOS-RPC scanner is a robust, economical scanning system which can quickly and effectively provide 3-dimensional dosimetric information on the accuracy of delivery of complex dose distributions, as determined in radiochromic dosimeters with low levels of contaminant scattered light (e.g. PRESAGE). The design of the scanner has been developed from earlier systems in our lab [1–3]. Here we describe preliminary first experiences with the scanner, carried out at Duke prior to installation at the RPC.
2. Methods
The methods section is separated in two main parts. Section 2.1 will introduce the DMOS-RPC and related components. Section 2.2 will discuss two current experiments designed to evaluate the DMOS-RPC for verification of simple radiation treatments.
2.1. The Duke Midsized Optical Scanner dedicated for the RPC
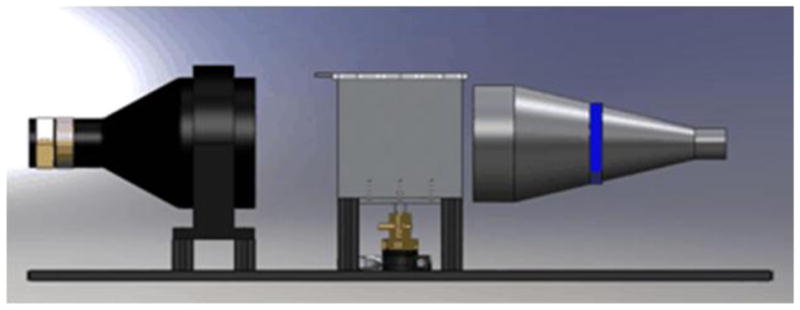
A schematic of the DMOS-RPC scanner is given in Figure 1. A telecentric lens and light source are displayed along with the central water bath which will contain the dosimeter and refractive index-matched fluid. The camera is equipped with a 1″, 1608x1208 ccd array. The entire system is about 1 meter from camera (left) to light source (right). The system is designed for a dosimeter of up to 12 cm in diameter and 10 cm height. A 2/3″, 1392x1040 ccd array camera is currently being used for preliminary testing until the 1″ camera is received. The imaging lens has a magnification of 0.08X translating to isotropic reconstruction resolution down to ~80μm. All motion and image acquisition parameters are set and automated through LabView™ [www.ni.com]. For all scans presented in this work 360 projections were acquired over 360 degrees with 10 images averaged together at each projection angle for noise reduction. Each projection was flood and dark corrected. Projections were downsized from 80μm to 1 mm pixels for further noise reduction, less disk space and decreased computation time. Reconstructed 3D data cubes of isotropic resolution 1 mm3 were created using the Matlab iradon function. Total time for data acquisition and reconstruction (including set-up time of dosimeter in the scanner) was about 30 minutes. Fuller details of the operation of Optical-CT are described in an accompanying abstract [4] and elsewhere in the literature [5–7].
Figure 1.

The DMOS-RPC system. The camera attached to a telecentric lens is shown on the left side, the water bath in the center and the light source with telecentric lens on the right. The rotation motor is displayed below the water bath. Total length is ~ 1 m.
2.2 Preliminary Tests of the DMOS-RPC
Two 10 cm diameter cylindrical PRESAGE dosimeters were irradiated with simple treatment plans where the planning system was known to provide accurate dose distributions. Both dosimeters were pre-scanned with the DMOS-RPC just before irradiation. The first dosimeter was treated with a two-field plan which consisted of orthogonal 4x4 cm fields delivering a maximum dose of ~3.6 Gy at isocenter. The second dosimeter was treated with a rotationally symmetric “spoke” plan with 9, 1cm width spokes of alternating high dose (5Gy), medium dose (3.6 Gy) and low dose (1.6 Gy) fields, with an SSD of 94 cm. The spoke plan was proposed by Sakhalkar et al [3] as a rigorous plan for evaluating optical-CT 3D dosimetry. The dosimeters were then rescanned in the DMOS-RPC scanner immediately after irradiation to find the radiation induced change in OD.
3. Results
3.1 The Two Field Plan
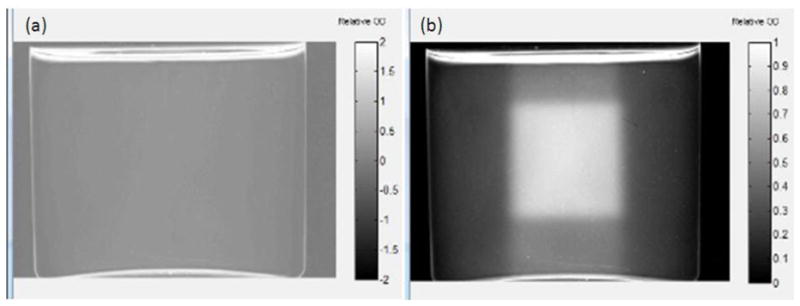
Figure 2 shows flood field corrected projections, taken with the DMOS-RPC system, of the 10 cm PRESAGE dosimeter prior to irradiation (a) and immediately after irradiation with the two field plan (b). Excellent index of refraction matching was achieved as evidenced by minimal edge artefacts. In figure 2b, increased attenuation is observed along the beam-path of one beam entering from the top of the dosimeter, orientated straight down. A bright square of increased attenuation is also observed in the center of the image, corresponding to the overlap region where the second beam is incident into the plane of the image (this projection is acquired in the beams-eye-view of the 2nd lateral beam).
Figure 2.

A single projection from the DMOS-RPC of the 10 cm PRESAGE dosimeter (a) prior to irradiation with the two field plan and (b) immediately after irradiation. In (b) one beam is incident on the top surface oriented vertically downward, and the other is incident normal to the plane of the image, resulting in the central cubed region of high attenuation (high dose).
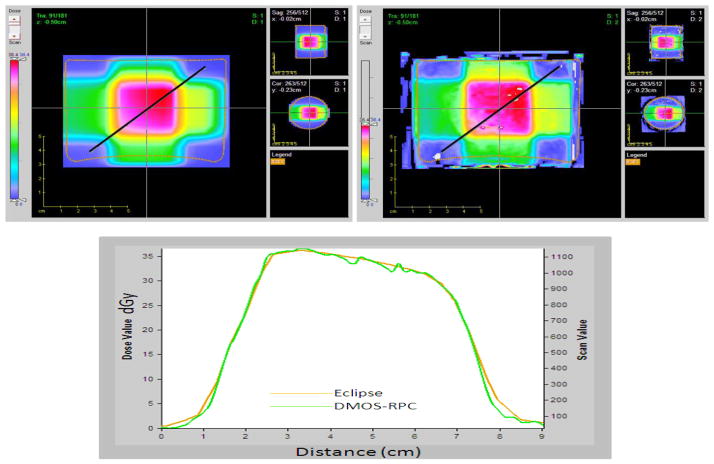
Figure 3 shows both the calculated (Eclipse) and PRESAGE measured dose distributions, in a single coronal slice towards the center of the dosimeter. A comparative line profile through the center of the two field dose is shown below. Good agreement is observed between the calculated and measured relative distributions, except for in the very low dose tails. The precise cause of the latter is under investigation.
Figure 3.
Comparison of dose-distributions in the central coronal slice from Eclipse (left panel) and as measured with Presage (right panel). Line profiles along the diagonal line are compared in the lower panel.
3.2 The Spoke Plan
Figure 4 shows a reconstructed DMOS-RPC image of the OD change in the 10 cm PRESAGE dosimeter after irradiation with the spoke plan for 3 separate depths of 1cm, 3 cm and 5cm (selected from the 0.5 mm3 isotropic 3D data of the whole dosimeter). The DMOS-RPC data have been normalized to the calculated plan at the center of the high-dose spoke. The alternating spoke intensities are clearly visible along with distinct edges to each spoke. Inter-spoke consistency between the 3 images suggests good consistency of dose response throughout the PRESAGE dosimeter. An increase in intensity is observed at the edges of the dosimeter, where the PRESAGE/fluid interface occurs. Further analysis is currently underway for a comparison of the measured DMOS-RPC data with the calculated dose distributions.
Figure 4.
Individual slices of the complete 360° reconstruction of the DMOS-RPC projections for the spoke plan irradiation at depths of 1 cm (left), 3 cm (middle) and 5 cm (right). The dose map values are in units of dGy (10 dGy = 1 Gy).
4. Conclusion
Preliminary results with the DMOS-RPC system are promising. The results of the two-field plan analysis show good agreement between the DMOS-RPC system and Eclipse in the PRESAGE dosimeters, and minimal edge artifacts. The reconstructed distributions from the spoke plan showed an ability to image high resolution variations in the delivered dose, and good consistency of response throughout the volume. Further measurements and quantitative analysis are currently underway and will be presented.
Acknowledgments
Supported by NIH R01CA100835.
References
- 1.Sakhalkar HS, Oldham M. Fast, high-resolution 3D dosimetry utilizing a novel optical-CT scanner incorporating tertiary telecentric collimation. Med Phys. 2008;35(1):101–11. doi: 10.1118/1.2804616. [DOI] [PMC free article] [PubMed] [Google Scholar]
- 2.Sakhalkar HS, et al. Med Phys. 2009;36(7):3371–7. doi: 10.1118/1.3148534. [DOI] [PMC free article] [PubMed] [Google Scholar]
- 3.Sakhalkar HS, et al. A comprehensive evaluation of the PRESAGE/optical-CT 3D dosimetry system. Med Phys. 2009;36(1):71–82. doi: 10.1118/1.3005609. [DOI] [PMC free article] [PubMed] [Google Scholar]
- 4.Thomas A, Oldham M. An ivestigation into the feasibility of a fast, large field-of-view, telecentric optical-CT scanning system for 3D radiochromic dosimetry. IC3D Dose. 2010 doi: 10.1088/1742-6596/250/1/012007. [DOI] [PMC free article] [PubMed] [Google Scholar]
- 5.Krstajic N, Doran SJ. Focusing optics of a parallel beam CCD optical tomography apparatus for 3D radiation gel dosimetry. Phys Med Biol. 2006;51:2055–2075. doi: 10.1088/0031-9155/51/8/007. [DOI] [PubMed] [Google Scholar]
- 6.Wolodzko JG, Marsden C, Appleby A. CCD imaging for optical tomography of gel radiation dosimeters. Med Phys. 1999;26(11):2508–2513. doi: 10.1118/1.598772. [DOI] [PubMed] [Google Scholar]
- 7.Gore JC, Ranade M, Maryanski MJ, Schulz RJ. Radiation dose distributions in three dimensions from tomographic optical density scanning of polymer gels: I. Development of an optical scanner. Phys Med Biol. 1996;41:2695–2704. doi: 10.1088/0031-9155/41/12/009. [DOI] [PubMed] [Google Scholar]


