The structures of SgrAI bound to secondary-site DNA and Ca2+ or Mg2+, as well as bound to cleaved primary-site DNA and Mg2+, are presented and show similar overall conformations interpreted as the low-activity form of the enzyme. A third Mg2+ ion-binding site is found in the structure with cleaved primary-site DNA, as predicted by the two-metal-ion mechanism.
Keywords: SgrAI, DNA cleavage, restriction endonucleases
Abstract
SgrAI is a type II restriction endonuclease that cuts an unusually long recognition sequence and exhibits allosteric self-activation with expansion of DNA-sequence specificity. The three-dimensional crystal structures of SgrAI bound to cleaved primary-site DNA and Mg2+ and bound to secondary-site DNA with either Mg2+ or Ca2+ are presented. All three structures show a conformation of enzyme and DNA similar to the previously determined dimeric structure of SgrAI bound to uncleaved primary-site DNA and Ca2+ [Dunten et al. (2008 ▶), Nucleic Acids Res. 36, 5405–5416], with the exception of the cleaved bond and a slight shifting of the DNA in the SgrAI/cleaved primary-site DNA/Mg2+ structure. In addition, a new metal ion binding site is located in one of the two active sites in this structure, which is consistent with proposals for the existence of a metal-ion site near the 3′-O leaving group.
1. Introduction
Type II restriction endonucleases are bacterial enzymes that are thought to protect their host from phage infection by cleaving phage DNA once injected into the cell and prior to its replication (Pingoud et al., 2005 ▶). SgrAI is a type II restriction endonuclease from Streptomyces griseus that cleaves duplex DNA at CR|CCGGYG sequences (where R = A or G, Y = C or T and | indicates the site of cleavage), which are known as cognate or primary sites (Tautz et al., 1990 ▶). Interestingly, plasmid assays revealed that SgrAI will also cleave the sequences CR|CCGGY(A,C,T) and CRCCGGGG, which are known as secondary sites, but only appreciably in plasmids containing primary-site sequences (Bitinaite & Schildkraut, 2002 ▶; Hingorani-Varma & Bitinaite, 2003 ▶). Secondary sites are distinct from star sites, which are cleaved under special reaction conditions such as high enzyme concentrations or the presence of organic solvents or Mn2+ and are discriminated against under optimal enzyme conditions by 2–4 orders of magnitude (Lesser et al., 1990 ▶; Thielking et al., 1990 ▶; Alves et al., 1995 ▶; Engler et al., 1997 ▶, 2001 ▶). Early biochemical assays indicated that the cleavage of both primary and secondary sites by SgrAI could be stimulated by the addition of oligonucleotides containing the precleaved primary-site DNA sequence (Bitinaite & Schildkraut, 2002 ▶; Hingorani-Varma & Bitinaite, 2003 ▶). This self-activation with expansion of sequence specificity has not been detected before in type II restriction endonucleases (or any nuclease for that matter).
We have previously shown that SgrAI oligomerizes when bound to primary-site DNA and that the oligomers of DNA-bound dimers known as HMWS (high-molecular-weight species) can be quite large (Park, Stiteler et al., 2010 ▶). We proposed that the HMWS are the activated form of the enzyme or are at least necessary for obtaining the activated conformation (Park, Stiteler et al., 2010 ▶), which may be composed of run-on oligomers involving two interaction surfaces (Park, Joshi et al., 2010 ▶). Under conditions where SgrAI remains dimeric, it binds primary-site and secondary-site DNA with nanomolar affinity and cleaves primary-site DNA with a low rate constant of 0.094 ± 0.015 min−1. Dimeric SgrAI also binds and cleaves secondary-site DNA with an only slightly reduced rate constant of 0.020 ± 0.006 min−1. However, only a very small percentage of the secondary-site DNA is actually cleaved in reactions, despite 100% predicted binding. Activation of the cleavage of both primary-site and secondary-site DNA sequences occurs with increasing concentrations of enzyme and primary-site DNA (cleaved or uncleaved; Park, Stiteler et al., 2010 ▶) and the same conditions lead to oligomerization of DNA-bound SgrAI dimers into HMWS. The activation of primary-site DNA cleavage involves a very large (>200-fold) increase in the rate constant to 22 ± 7 min−1. That of secondary-site DNA involves a more modest (two to threefold) increase to 0.05 ± 0.01 min−1, but with an increase in the total amount of DNA cleaved (Park, Stiteler et al., 2010 ▶). The activation of DNA cleavage by SgrAI, particularly the cleavage of secondary-site sequences, could be potentially harmful to the host harboring the enzyme. We have suggested that the oligomerization of activated SgrAI may be a mechanism of sequestering potentially harmful SgrAI enzymes away from the host genomic DNA (Park, Stiteler et al., 2010 ▶).
Here, we describe three new crystal structures that help to clarify aspects of the mechanism of self-activation of SgrAI. The structures with secondary-site DNA, with either Ca2+ or Mg2+, show the DNA to be uncleaved, with both the enzyme and DNA in the same conformation as determined previously for dimeric SgrAI bound to uncleaved primary-site DNA (Dunten et al., 2008 ▶). Hence, the designation of this conformation as the low-activity form is confirmed, as secondary-site DNA cannot stimulate SgrAI activity on its own (Park, Stiteler et al., 2010 ▶). We also describe the structure of SgrAI bound to primary-site DNA cocrystallized in the presence of Mg2+, in which the DNA has been cleaved by the enzyme during or after crystallization. The enzyme is dimeric in the crystal structure, possessing a conformation identical to that seen previously for SgrAI bound to uncleaved primary-site DNA (Dunten et al., 2008 ▶). This suggests that cleavage of primary-site DNA is not sufficient to induce the activated conformation or for oligomerization into HMWS. Finally, a third divalent cation-binding site is identified in this structure, which is consistent with previous predictions (Dunten et al., 2008 ▶).
2. Experimental
2.1. Protein purification
Wild-type SgrAI was prepared as described by Dunten et al. (2008 ▶). Briefly, SgrAI was expressed in Escherichia coli strain ER2566 in the presence of the MspI methyltransferase and purified using FPLC chromatography (GE Healthcare Biosciences) using the following chromatographic resins: Heparin FF Sepharose (Pharmacia), SP FF Sepharose (GE Healthcare Biosciences), Q FF Sepharose (GE Healthcare Biosciences) and Heparin FF Sepharose again (GE Healthcare Biosciences). The SgrAI enzyme was dialyzed into storage buffer (20 mM Tris acetate pH 8.0, 50 mM potassium acetate, 0.1 mM EDTA, 1 mM DTT, 50% glycerol), flash-frozen in liquid nitrogen, aliquoted into single-use aliquots and stored at 193 K.
2.2. DNA preparation
The oligonucleotide used for crystallization was made synthetically and purified using C18 reverse-phase HPLC (Aggarwal, 1990 ▶). The concentration was measured spectrophotometrically with an extinction coefficient calculated from standard values for the nucleotides (Fasman, 1975 ▶). The oligonucleotide containing the primary site is self-complementary, with the sequence 5′-AAGTCCACCGGTGGACTT (SgrAI recognition sequence in bold). The oligonucleotides used for the secondary site were 5′-AGTCCACCGGGGGACT-3′ and 5′-AGTCCCCCGGTGGACT-3′ and equimolar quantities were mixed before annealing. Annealing was performed by heating to 363 K for 10 min at a concentration of 1 mM, followed by slow cooling to 277 K over 4–5 h in a thermocycler. The DNA was stored at 253 K until needed.
2.3. Crystallization, data collection, structure solution, refinement and analysis
Crystals were prepared from SgrAI and DNA using 1.5–3.0 µl protein–DNA mixture and 1.0–1.5 µl precipitating solution (25–21% PEG 4K, 0.1 M HEPES buffer pH 7.5, 0.15–0.20 M NaCl with 0.05 M CaCl2 or MgCl2) per drop; the drops were placed over 1 ml precipitating solution. The concentration of SgrAI varied between 10 and 30 mg ml−1 and it was mixed with DNA to give a 1:2 molar ratio of SgrAI dimer:DNA duplex. Crystals appeared overnight and grew for one week at 290 K. The crystals were then exchanged into cryoprotection solution (25% PEG 4K, 0.1 M HEPES buffer pH 7.5, 0.3 M NaCl and 30% glycerol) and flash-frozen in liquid nitrogen. X-ray diffraction data were measured using synchrotron radiation on Stanford Synchrotron Light Source (SSRL) BL9-2 or BL7-1. Data collection was performed while maintaining the crystal at 100 K. Image processing and data reduction were performed with HKL-2000 (HKL Research Inc.) for SgrAI with secondary-site DNA or XDS (Kabsch, 2010 ▶) for SgrAI with cleaved primary-site DNA. The structures were solved by molecular replacement using Phaser (Storoni et al., 2004 ▶; Read, 2001 ▶) for the structures with secondary-site DNA or MOLREP (Vagin & Teplyakov, 2010 ▶) for the structure with cleaved primary-site DNA and were refined using CNS (Brünger et al., 1998 ▶), PHENIX (Adams et al., 2002 ▶), REFMAC (Murshudov et al., 1999 ▶) and the model-building programs XtalView (McRee, 1999 ▶) and Coot (Emsley & Cowtan, 2004 ▶). R.m.s.d.s between structures were determined using LSQKAB (Kabsch, 1976 ▶) from the CCP4 suite (Collaborative Computational Project, Number 4, 1994 ▶) and the Cα atoms of residues 2–339 of each relevant subunit or all atoms of DNA as indicated.
3. Results
3.1. Structure of SgrAI bound to secondary-site DNA and either Ca2+ or Mg2+
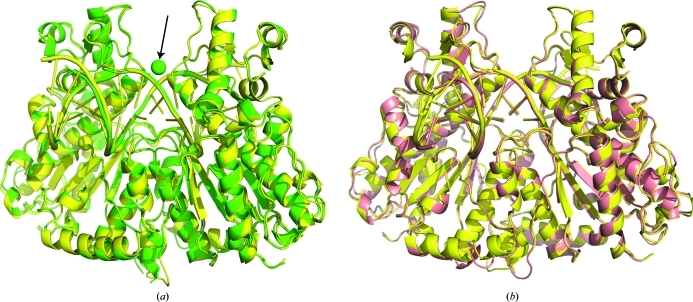
The structure of SgrAI with secondary-site DNA, CACCGGGG/CCCCGGTG, was solved in the presence of Ca2+ and Mg2+ (PDB codes 3n7b and 3n78; Table 1 ▶). The two structures are isomorphous, but in a different cell from previously solved SgrAI–DNA structures (Dunten et al., 2008 ▶; Park, Joshi et al., 2010 ▶), and the asymmetric unit contains one dimer of SgrAI and one duplex of DNA. Analysis of the crystal lattice contacts indicates that the dimers are independent, with contacts between dimers that are more typical of lattice contacts than of oligomers. The conformation of SgrAI is very similar in the two structures as well as in the previously solved structure of SgrAI bound to uncleaved primary-site DNA (Dunten et al., 2008 ▶; Fig. 1 ▶). The r.m.s.d. between the two structures with secondary-site DNA is 0.5 Å when using the whole dimer (residues 2–339) or either monomer. The r.m.s.d. between the structures with secondary-site DNA and that with uncleaved primary-site DNA is 0.6 Å using the whole dimer for both of the secondary-site DNA-bound structures and is 0.4 and 0.6 Å when comparing the crystallographically independent monomers of the structures with Ca2+ and Mg2+, respectively.
Table 1. Diffraction data and structure-refinement statistics.
| Code | S434_16S2_Ca | S431_16S2_Mg | S451_18cog_Mg |
|---|---|---|---|
| PDB code | 3n7b | 3n78 | 3mqy |
| Beamline | SSRL BL9-2 | SSRL BL9-2 | SSRL BL7-1 |
| Processing program(s) | MOSFLM/SCALA | MOSFLM/SCALA | XDS |
| DNA | 16S2 | 16S2 | 18cog |
| Space group | P21212 | P21212 | P21 |
| Unit-cell parameters (Å, °) | a = 108.68, b = 133.66, c = 64.75 | a = 108.79, b = 133.00, c = 64.62 | a = 59.16, b = 119.98, c = 69.86, β = 102.68 |
| Resolution (Å) | 2.65 | 2.95 | 2.00 |
| Total observations | 119948 | 66792 | 268083 |
| Unique observations | 28125 | 19477 | 62914 |
| Completeness (%) | 99.9 (100.0) | 97.3 (96.2) | 98.1 (99.0) |
| 〈I/σ(I)〉 | 5.7 (2.0) | 6.6 (2.0) | 10.2 (2.3) |
| Multiplicity | 4.3 (4.3) | 3.4 (3.3) | 4.3 (4.2) |
| Rmerge† (%) | 11.9 (38.3) | 11.4 (39.2) | 7.8 (40.2) |
| Rcryst‡ (%) | 17.3 (25.6) | 18.9 (23.7) | 19.6 (33.6) |
| Rfree§ (%) | 24.8 (38.5) | 28.2 (36.2) | 24.9 (36.8) |
| Overall B factor (Wilson plot) (Å2) | 32.9 | 37.4 | 35.6 |
| R.m.s.d. bonds (Å) | 0.016 | 0.008 | 0.024 |
| R.m.s.d. angles (°) | 1.63 | 1.35 | 1.97 |
| Asymmetric unit | 1 SgrAI dimer, 1 DNA duplex | 1 SgrAI dimer, 1 DNA duplex | 1 SgrAI dimer, 1 DNA duplex |
| No. of waters | 395 | 80 | 318 |
| No. of divalent cations | 3 Ca2+ | 2 Mg2+ | 5 Mg2+ |
R
merge = 
 , where 〈I(hkl)〉 is the average intensity over symmetry-related and equivalent reflections and I
i(hkl) is the observed intensity for reflection hkl.
R
cryst = 
 , where |F
obs| and |F
calc| are the observed and calculated structure-factor amplitudes for reflection hkl, respectively. The sum is carried out over the 98% of the observed reflections which are used in refinement.
R free refers to the R factor for the test reflection set (2% of the total observed) which was excluded from refinement.
Figure 1.
Cartoon diagram of superposition (using residues 2–339 of each chain) of SgrAI bound to primary-site DNA and Ca2+ (yellow) with (a) SgrAI bound to secondary-site DNA and Ca2+ (green), where spheres indicate metal ions and the arrow indicates the new Ca2+-binding site, and (b) SgrAI bound to secondary-site DNA and Mg2+ (salmon).
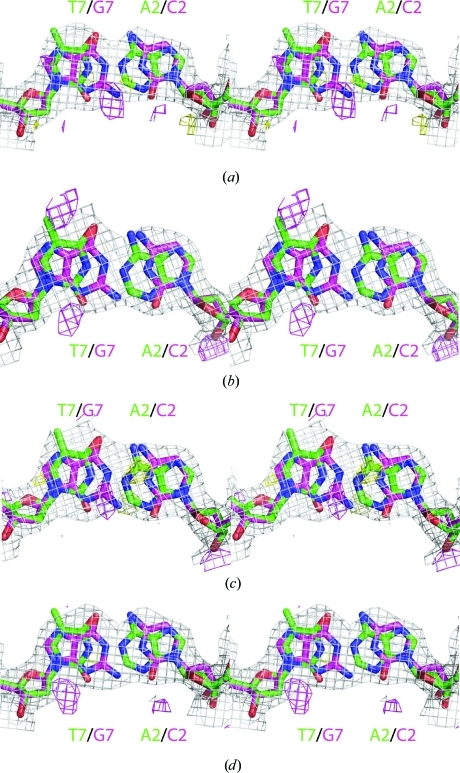
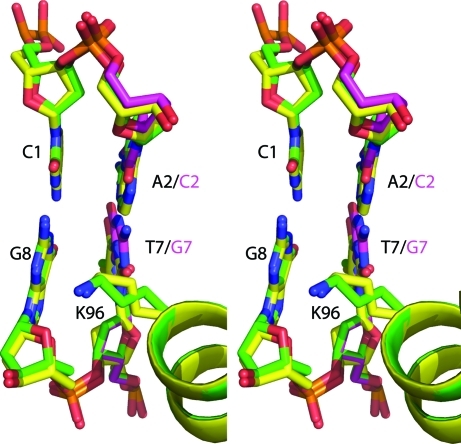
In both structures of SgrAI bound to secondary-site DNA, the electron density is averaged between the two different sequences at the second (A or C) and seventh (G or T) positions of the recognition sequence, indicating that the DNA is oriented in either direction in the crystals of the SgrAI–DNA complexes. Fig. 2 ▶ shows electron-density maps (blue, 2F o − F c at 1σ; magenta, F o − F c at 3σ; Fig. 2 ▶) at the two averaged base pairs when they are modeled as either A/T or G/C with 100% occupancy in simulated-annealing calculations in the structure with Ca2+. In all cases, positive difference electron density (magenta, Fig. 2 ▶) occurs that is suggestive of the base pair other than that used in the refinement. Therefore, a 50% occupancy of each base pair (either A/T or G/C) in both the second and seventh positions of the recognition sequence was used in the final structure refinements. The conformation of the DNA at these base pairs, as well as the rest of the recognition sequence, is very similar to that for the primary site solved previously, with r.m.s.d.s of 0.6 and 0.3 Å for the structures with Ca2+ and Mg2+, respectively, from the uncleaved primary-site DNA (Dunten et al., 2008 ▶). Fig. 3 ▶ shows a superposition around one of the two sites containing the secondary-site specific base pair.
Figure 2.
(a) Stereoview of a simulated-annealing (SA) 2F o − F c electron-density map (1σ, gray) and an SA 1F o − F c electron-density map (3σ, magenta; −3σ, yellow) at the nucleotides chain C residue 12 and chain D residue 7 (nucleotides 7 and 2 of the recognition sequence, respectively) when the sequence Ade and Thy, respectively, is modeled at 100% occupancy in the structure of SgrAI bound to secondary-site DNA and Ca2+. The Cyt/Gua base pair representing the substitution in the secondary sequence is colored magenta, blue, red and orange, and the Ade/Thy base pair representing the primary-site sequence is colored green, blue, red and orange. (b) Stereoview of an SA 2F o − F c electron-density map (1σ, gray) and an SA 1F o − F c map (3σ, magenta; −3σ, yellow) at the nucleotides chain C residue 12 and chain D residue 7 (nucleotides 7 and 2 of the recognition sequence, respectively) when the sequence Cyt and Gua, respectively, is used with 100% occupancy. Colors are as in (a). (c) As in (a), but for the base pair chain C residue 7 and chain D residue 12. (d) As in (b), but for the base pair chain C residue 7 and chain D residue 12.
Figure 3.
Stereo image of superposition of SgrAI bound to uncleaved primary-site DNA and Ca2+ (yellow, red, blue, orange) onto SgrAI bound to secondary-site DNA and Ca2+ (green, pink, blue, red, orange) at Lys96 of subunit A.
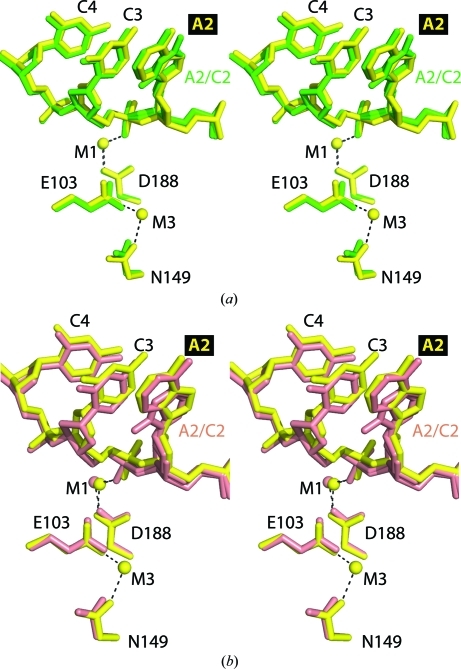
In the structure of SgrAI bound to secondary-site DNA and Ca2+, only one divalent cation is found in each active site at the M1 position (green, Fig. 4 ▶ a). In contrast, both the M1 and M3 positions are occupied by Ca2+ in the structure with uncleaved primary-site DNA and Ca2+ (yellow, Fig. 4 ▶ a; Dunten et al., 2008 ▶). A third Ca2+-binding site is seen in the structure with secondary-site DNA and Ca2+ (arrow, Fig. 1 ▶ a), which bridges Asp90 from each subunit and spans the top of the DNA-binding site. This Ca2+-binding site was not seen in the previous structure with Ca2+ and uncleaved primary-site DNA (Dunten et al., 2008 ▶) and may have resulted from the higher concentration of Ca2+ used in the cocrystallization with secondary-site DNA (50 mM versus 10 mM).
Figure 4.
Stereo images of active-site superpositions of structures with secondary-site DNA. (a) Superpositions of active site A of SgrAI bound to uncleaved primary-site DNA and Ca2+ (yellow) and bound to secondary-site DNA and Ca2+ (green) using the Cα atoms of residues 149, 188 and 103. Dashes indicate ligations to the metal ions. (b) As in (a) but with SgrAI bound to secondary-site DNA and Mg2+ (salmon).
The relatively low resolution (2.95 Å) of the Mg2+-bound structure made unequivocal identification of Mg2+-binding sites difficult, yet one Mg2+ was easily modeled at the M1 site (salmon, Fig. 4 ▶ b). Therefore, the M3 site as seen in the Ca2+-bound (yellow, Fig. 4 ▶ b) and Mn2+-bound structures with uncleaved primary-site DNA (Dunten et al., 2008 ▶) (and Mg2+, see below) does not appear to be occupied in these structures with secondary-site DNA. However, no structural explanation for the absence of binding at the M3 site is readily apparent.
3.2. Structure of SgrAI bound to primary-site DNA and Mg2+
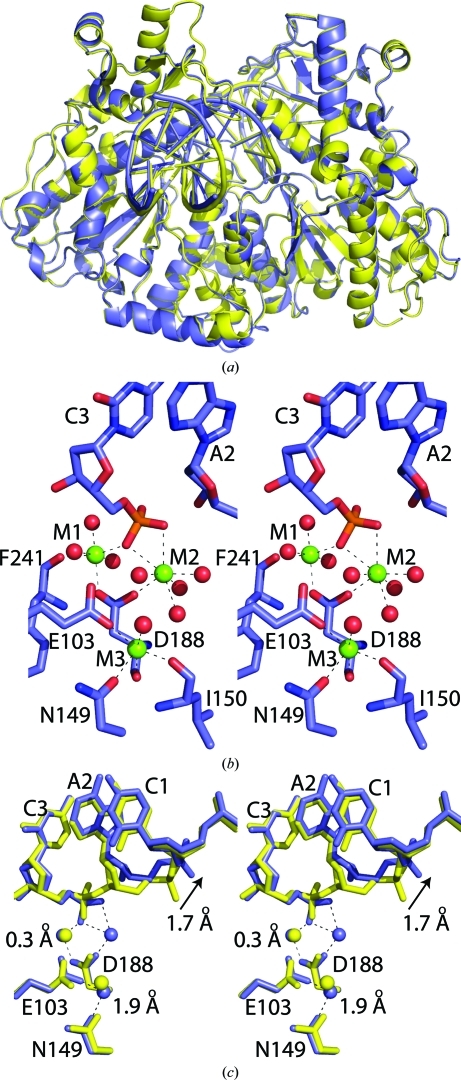
The structure of SgrAI bound to an 18 bp DNA containing the primary site (18-1; the same DNA as used in the structure with uncleaved primary-site DNA; Dunten et al., 2008 ▶) cocrystallized in the presence of Mg2+ has been solved to 2.2 Å resolution (Table 1 ▶) and deposited in the PDB with code 3mqy. The asymmetric unit contains one dimer of SgrAI bound to one duplex of DNA in a unit cell related to, but only half as large as, that of the previously solved structure with the same DNA but with Ca2+ instead of Mg2+ (PDB code 3dvo; Dunten et al., 2008 ▶). The overall conformation of the enzyme is very similar to that bound to uncleaved primary-site DNA (Fig. 5 ▶ a), with r.m.s.d.s of 0.55 Å using the whole dimer and of 0.38 and 0.63 Å using the individual subunits. The electron density indicates that both DNA strands are cleaved and several Mg2+ ions are found in the two independent active sites. Two Mg2+ ions are found in the active site of subunit B in the same positions as found for Ca2+ and Mn2+ ions when SgrAI is bound to uncleaved DNA (M1 and M3; Dunten et al., 2008 ▶); however, three Mg2+ ions are found in the active site of subunit A (M1, M2 and M3; Fig. 5 ▶ b). Two align with the sites found in active site B, but the third is closer to the DNA, binding at the leaving group in a site predicted by the two-metal-ion mechanism (the M2 site; Beese & Steitz, 1991 ▶).
Figure 5.
Superposition of SgrAI bound to uncleaved primary-site DNA and Ca2+ (Dunten et al., 2008 ▶; PDB code 1dvo; yellow) onto cleaved primary-site DNA and Mg2+ (blue) using Cα atoms of residues 2–339 of each chain. (a) Cartoon diagram of an entire dimer bound to one duplex of DNA. (b) Stereo image of active site A of SgrAI/cleaved primary-site DNA/Mg2+, showing the three Mg2+ ions (M1, M2 and M3). Dashes indicate distances between Mg2+ and potential oxygen ligands of less than 2.8 Å. (c) Stereo image of subunit A active sites, showing the distances between Mg2+ and Ca2+ positions in sites M1 and M3.
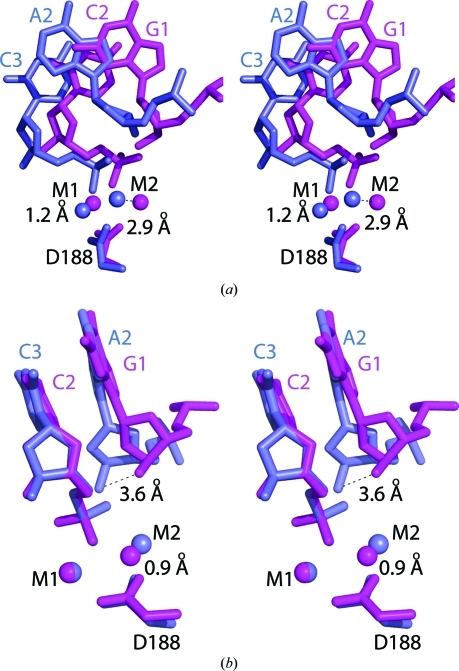
A shift in the DNA 5′ to the cleavage site occurs such that the O3′ atom moves 3.0 Å and the next phosphate is 1.7 Å from its position in the uncleaved structure (Fig. 5 ▶ c). The r.m.s.d. of the entire 8 bp recognition sequence from that of the uncleaved primary site is 0.60 Å and superposition of the nucleotides 3′ to the cleavage shows that those 5′ to the cleavage have shifted by 0.85 Å (Fig. 5 ▶ c). The common active-site metal ion-binding sites are in very similar positions to those characterized previously (Dunten et al., 2008 ▶), with distances of 0.3 and 1.9 Å between M1 and M3 after superposition using the Cα atoms of residues 149, 103 and 188 (blue, Fig. 5 ▶ c). Comparison of the M1 and M2 Mg2+ sites with the two sites of NgoMIV gives distances of 1.2 and 2.9 Å between the M1 and M2 sites, respectively, when the Cα atoms of residues 149, 103 and 188 of SgrAI (blue, Fig. 6 ▶ a) are superimposed onto residues 96, 70 and 140 of NgoMIV (magenta, Fig. 6 ▶ a) and of 0.1 and 0.9 Å between the M1 and M2 sites, respectively, when the cleaved phosphates are superimposed (Fig. 6 ▶ b). The nucleotide 5′ to the cleavage site is offset from that of NgoMIV in this superposition such that the O3′ atoms at the cleavage sites in the two structures are 3.6 Å apart (Fig. 6 ▶ b).
Figure 6.
Superpositions of SgrAI bound to cleaved primary-site DNA and Mg2+ (blue) and NgoMIV bound to cleaved cognate DNA and Mg2+ (magenta). (a) Stereo image of the active sites of subunits A superimposed using the Cα atoms of residues 149, 103 and 188 of SgrAI and 96, 70 and 140 of chain A of NgoMIV, showing the displacements of M1 and M2. (b) Stereo image of the superposition using atoms of the phosphate at the cleaved phosphodiester bond, showing that the positions of M1 and M2 match much more closely but the 5′ nucleotide is shifted such that the O3′ is 3.6 Å away.
4. Discussion
We have solved three new structures of SgrAI bound to DNA and Ca2+ or Mg2+ which add to our understanding of the mechanism of SgrAI self-activation. Firstly, two isomorphous structures of SgrAI bound to a secondary-site DNA containing a noncanonical G·C base pair in one of the two Y·R base-pair positions of the recognition sequence CR|CCGGYG (with 5′-CA|CCGGGG-3′ on the top strand and 3′-GT|GGCCCC-5′ on the bottom) have been determined. The crystals were prepared with either Ca2+ or Mg2+. The two structures are very similar, within coordinate error, to each other as well as to the previously solved structure of SgrAI bound to a primary-site DNA and Ca2+ (Dunten et al., 2008 ▶), possessing no large conformational changes, with the exception of the absence of divalent cation binding in the M3 metal ion-binding site. Only the M1 site is occupied in the structures with secondary-site DNA and Mg2+ or Ca2+, as was found in the structures of the endonucleases HincII (Etzkorn & Horton, 2004a ▶) and BglI (Newman et al., 1998 ▶) bound to their cognate DNA sequences and Ca2+ (Newman et al., 1998 ▶). The asymmetric unit of the structures of SgrAI with secondary-site DNA contains a dimer of SgrAI bound to a full duplex of DNA, but the asymmetric sequence of the DNA appears to be positioned in both directions in the many copies of this complex in the crystal. Therefore, the electron density is averaged at the site of the substitution and refinement was performed with 50% occupancy of each sequence (GC and TA). Analysis of the residues at and around this position indicates no differences in the conformation of the two sequences (green and pink, Fig. 3 ▶) nor any significant differences relative to the structure of SgrAI bound to primary-site DNA (yellow, Fig. 3 ▶). Lys96, which has been postulated to function in indirect readout of the degenerate base pair at the second and seventh base pair of the recognition sequence, is similarly positioned in the structures and the unstacking of G8 from the base at position 7 is also preserved (Fig. 3 ▶).
The common enzyme conformation of SgrAI bound to uncleaved primary-site (Dunten et al., 2008 ▶) and secondary-site DNA (current work) supports the proposal that these structures are in the low-activity conformation (Dunten et al., 2008 ▶), since secondary-site DNA alone is incapable of activating SgrAI (Park, Stiteler et al., 2010 ▶). The common conformation is consistent with the similar DNA-binding affinities (0.6 and 2.6 nM for 18 bp DNA containing primary-site and secondary-site sequences, respectively; Park, Stiteler et al., 2010 ▶) and similar basal unstimulated DNA-cleavage rate constants (0.09 and 0.02 min−1 for primary-site and secondary-site DNA, respectively; Park, Stiteler et al., 2010 ▶). However, in the absence of stimulation only a small fraction of the secondary-site DNA is cleaved (10%) and stimulation appears to occur by increasing not so much the rate of cleavage (which is stimulated only two to threefold for secondary-site DNA to 0.05 min−1, while it is stimulated >200-fold for primary-site DNA to 22 min−1), but the fraction of the DNA that is cleaved (Park, Stiteler et al., 2010 ▶). Therefore, secondary-site DNA is never cleaved as quickly as primary-site DNA under stimulating conditions, suggesting that the secondary site prevents the enzyme from attaining the fully activated conformation.
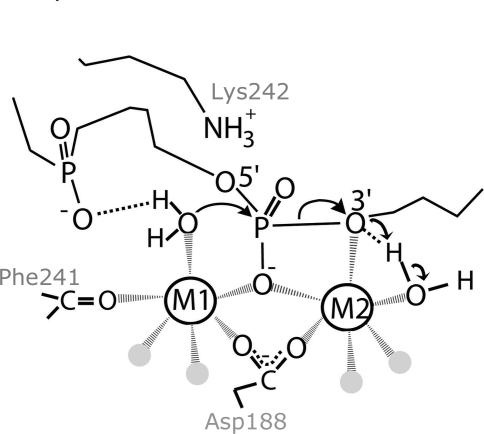
The structure of SgrAI bound to cleaved primary-site DNA and Mg2+ shows a similar conformation to the structures with uncleaved secondary-site and uncleaved primary-site DNA (Fig. 5 ▶ a), with differences in conformation only at the cleaved phosphate and the nucleotides immediately 5′ to the cleavage site (Fig. 5 ▶ c). The low activity of SgrAI under conditions of low enzyme concentration has been interpreted as slow DNA cleavage by the SgrAI dimer (Daniels et al., 2003 ▶; Park, Stiteler et al., 2010 ▶). The current structure supports this interpretation in that DNA has been cleaved by the enzyme in the crystallization experiment and no indication of any other form beyond dimeric is found. It is possible that the activated form of the enzyme was populated at some point prior to crystallization but did not prevent the capture of a large fraction of the SgrAI–DNA complexes in this low-activity dimeric form. Only two Mg2+ ions are located in active site B; however, the postulated (Dunten et al., 2008 ▶) third Mg2+-binding site at the M2 site is also occupied in active site A (Fig. 5 ▶ b). This Mg2+ binding site was predicted based on analysis of other nucleases, including the closely related NgoMIV (Deibert et al., 1999 ▶; magenta, Fig. 6 ▶), and is important in the two-metal-ion mechanism model thought to be operative in this and many other divalent cation-dependent nucleases (Horton & Perona, 2002 ▶; Dupureur, 2008 ▶; Etzkorn & Horton, 2004b ▶; Fig. 7 ▶). The high resolution of the structure with cleaved primary-site DNA and Mg2+ (2.20 Å) allows the unambiguous identification of the Mg2+ ions through their short ligation distances to O atoms (relative to those of water) and their octahedral ligation geometry (as opposed to tetrahedral for water) (Fig. 5 ▶ b). All three sites are occupied in this structure with similar temperature factors and therefore partial occupancy of M2 and M3 is not indicated, although still possible. Three metal-ion sites were also located in EcoRV, although they were not observed to be simultaneously occupied in any one structure, and a moving metal-ion mechanism has been proposed in which an ion occupying a distal site moves more proximal to the DNA (Horton & Perona, 2004 ▶). Such a mechanism is also possible in SgrAI as a mechanism of activation of DNA cleavage by the destabilization of Mg2+ binding to M3 in favor of M2. However, the current structure is thought to be representative of the low-activity conformation and therefore the absence of Mg2+ binding at M2 in one of the two active sites in the asymmetric unit is consistent with this proposal involving weak Mg2+ binding at M2 in the low-activity conformation. Interestingly, a global analysis of DNA cleavage by the type II restriction endonuclease PvuII indicated that cleavage with only a single metal ion per active site is ∼100-fold slower than that with two metal ions (Xie et al., 2008 ▶). PvuII has only two active-site metal-ion binding sites, corresponding to sites M1 and M2 of SgrAI (Horton & Cheng, 2000 ▶). We have found that the single-turnover DNA-cleavage rate constant of SgrAI for primary-site DNA in the unstimulated form is ∼200-fold lower than that in the stimulated form. The similarity in degree of activation of SgrAI to that of PvuII is further support for the idea that DNA cleavage by SgrAI in the unstimulated (i.e. low-activity) form results from a mechanism that utilizes only a single Mg2+ ion (at M1), while that by the stimulated form results from the utilization of Mg2+ ions at both M1 and M2. The M3 site may be present to decrease Mg2+ binding at M2 and/or as a reserve for Mg2+ when activation (in which the Mg2+ affinity of the M2 site is increased) occurs.
Figure 7.
The two-metal-ion mechanism for DNA cleavage by the low-activity conformation of SgrAI. Water molecules that are not directly involved in the reaction are shown as gray spheres.
The structure with cleaved primary-site DNA shows that the cleaved primary site is not sufficient to shift the conformation of SgrAI into the activated conformation, since the conformation of SgrAI bound to cleaved primary-site DNA is the same as that with uncleaved primary-site DNA (Dunten et al., 2008 ▶) and with secondary-site DNA (current work), assigned as the low-activity conformation. This conclusion is consistent with biochemical data that showed that for stimulation to occur at 310 K the DNA requires sufficient flanking base pairs (Park, Stiteler et al., 2010 ▶) that are absent from the DNA used in these crystal structures. The DNA used in the crystal structures (18 bp) fails to stimulate SgrAI in DNA-cleavage assays performed at 310 K, but does stimulate DNA cleavage at 277 K (Park, Stiteler et al., 2010 ▶), where oligomers (HMWS) of the DNA-bound SgrAI dimer are also observed (Park, Stiteler et al., 2010 ▶). The HMWS have been proposed to be the activated form of the enzyme (Park, Stiteler et al., 2010 ▶). The temperature of crystallization, 290 K, may be too high to stabilize the oligomeric form of SgrAI with this DNA, resulting in the capture of the low-activity dimeric form. The factors that favor the activated form, which is presumably the HMWS, await future structural characterization.
Supplementary Material
PDB reference: SgrAI, 3n7b
PDB reference: 3n78
PDB reference: 3mqy
Acknowledgments
This work was supported by NIH grant 5R01GM066805 (to NCH). Portions of this research were carried out at the Stanford Synchrotron Radiation Laboratory, a national user facility operated by Stanford University on behalf of the US Department of Energy, Office of Basic Energy Sciences. The SSRL Structural Molecular Biology Program is supported by the Department of Energy, Office of Biological and Environmental Research and by the National Institutes of Health, National Center for Research Resources, Biomedical Technology Program and the National Institute of General Medical Sciences.
References
- Adams, P. D., Grosse-Kunstleve, R. W., Hung, L.-W., Ioerger, T. R., McCoy, A. J., Moriarty, N. W., Read, R. J., Sacchettini, J. C., Sauter, N. K. & Terwilliger, T. C. (2002). Acta Cryst. D58, 1948–1954. [DOI] [PubMed]
- Aggarwal, A. K. (1990). Methods, 1, 83–90. [DOI] [PubMed]
- Alves, J., Selent, U. & Wolfes, H. (1995). Biochemistry, 34, 11191–11197. [DOI] [PubMed]
- Beese, L. S. & Steitz, T. A. (1991). EMBO J. 10, 25–33. [DOI] [PMC free article] [PubMed]
- Bitinaite, J. & Schildkraut, I. (2002). Proc. Natl Acad. Sci. USA, 99, 1164–1169. [DOI] [PMC free article] [PubMed]
- Brünger, A. T., Adams, P. D., Clore, G. M., DeLano, W. L., Gros, P., Grosse-Kunstleve, R. W., Jiang, J.-S., Kuszewski, J., Nilges, M., Pannu, N. S., Read, R. J., Rice, L. M., Simonson, T. & Warren, G. L. (1998). Acta Cryst. D54, 905–921. [DOI] [PubMed]
- Collaborative Computational Project, Number 4 (1994). Acta Cryst. D50, 760–763.
- Daniels, L. E., Wood, K. M., Scott, D. J. & Halford, S. E. (2003). J. Mol. Biol. 327, 579–591. [DOI] [PubMed]
- Deibert, M., Grazulis, S., Janulaitis, A., Siksnys, V. & Huber, R. (1999). EMBO J. 18, 5805–5816. [DOI] [PMC free article] [PubMed]
- Dunten, P. W., Little, E. J., Gregory, M. T., Manohar, V. M., Dalton, M., Hough, D., Bitinaite, J. & Horton, N. C. (2008). Nucleic Acids Res. 36, 5405–5416. [DOI] [PMC free article] [PubMed]
- Dupureur, C. (2008). Curr. Chem. Biol. 2, 159–173.
- Emsley, P. & Cowtan, K. (2004). Acta Cryst. D60, 2126–2132. [DOI] [PubMed]
- Engler, L. E., Sapienza, P., Dorner, L. F., Kucera, R., Schildkraut, I. & Jen-Jacobson, L. (2001). J. Mol. Biol. 307, 619–636. [DOI] [PubMed]
- Engler, L. E., Welch, K. K. & Jen-Jacobson, L. (1997). J. Mol. Biol. 269, 82–101. [DOI] [PubMed]
- Etzkorn, C. & Horton, N. C. (2004a). Biochemistry, 43, 13256–13270. [DOI] [PubMed]
- Etzkorn, C. & Horton, N. C. (2004b). J. Mol. Biol. 343, 833–849. [DOI] [PubMed]
- Fasman, G. D. (1975). CRC Handbook of Biochemistry and Molecular Biology, 3rd ed. Cleveland: CRC Press.
- Hingorani-Varma, K. & Bitinaite, J. (2003). J. Biol. Chem. 278, 40392–40399. [DOI] [PubMed]
- Horton, J. R. & Cheng, X. (2000). J. Mol. Biol. 300, 1049–1056. [DOI] [PubMed]
- Horton, N. C. & Perona, J. J. (2002). Nature Struct. Biol. 9, 42–47. [DOI] [PubMed]
- Horton, N. C. & Perona, J. J. (2004). Biochemistry, 43, 6841–6857. [DOI] [PubMed]
- Kabsch, W. (1976). Acta Cryst. A32, 922–923.
- Kabsch, W. (2010). Acta Cryst. D66, 125–132. [DOI] [PMC free article] [PubMed]
- Lesser, D. R., Kurpiewski, M. R. & Jen-Jacobson, L. (1990). Science, 250, 776–786. [DOI] [PubMed]
- McRee, D. E. (1999). J. Struct. Biol. 125, 156–165. [DOI] [PubMed]
- Murshudov, G. N., Vagin, A. A., Lebedev, A., Wilson, K. S. & Dodson, E. J. (1999). Acta Cryst. D55, 247–255. [DOI] [PubMed]
- Newman, M., Lunnen, K., Wilson, G., Greci, J., Schildkraut, I. & Phillips, S. E. V. (1998). EMBO J. 17, 5466–5476. [DOI] [PMC free article] [PubMed]
- Park, C. K., Joshi, H., Agrawal, A., Ghare, M. I., Little, E. J., Dunten, P. W., Bitinaite, J. & Horton, N. C. (2010). In the press. [DOI] [PMC free article] [PubMed]
- Park, C. K., Stiteler, A., Shah, S., Ghare, M. I., Bitinaite, J. & Horton, N. C. (2010). Biochemistry, 49, 8818–8830. [DOI] [PMC free article] [PubMed]
- Pingoud, A., Fuxreiter, M., Pingoud, V. & Wende, W. (2005). Cell. Mol. Life Sci. 62, 685–707. [DOI] [PubMed]
- Read, R. J. (2001). Acta Cryst. D57, 1373–1382. [DOI] [PubMed]
- Storoni, L. C., McCoy, A. J. & Read, R. J. (2004). Acta Cryst. D60, 432–438. [DOI] [PubMed]
- Tautz, N., Kaluza, K., Frey, B., Jarsch, M., Schmitz, G. G. & Kessler, C. (1990). Nucleic Acids Res. 18, 3087. [DOI] [PMC free article] [PubMed]
- Thielking, V., Alves, J., Fliess, A., Maass, G. & Pingoud, A. (1990). Biochemistry, 29, 4682–4691. [DOI] [PubMed]
- Vagin, A. & Teplyakov, A. (2010). Acta Cryst. D66, 22–25. [DOI] [PubMed]
- Xie, F., Qureshi, S. H., Papadakos, G. A. & Dupureur, C. M. (2008). Biochemistry, 47, 12540–12550. [DOI] [PMC free article] [PubMed]
Associated Data
This section collects any data citations, data availability statements, or supplementary materials included in this article.
Supplementary Materials
PDB reference: SgrAI, 3n7b
PDB reference: 3n78
PDB reference: 3mqy


