Abstract
Purpose: One issue with amplitude binning list-mode studies in SPECT for respiratory motion correction is that variation in the patient’s respiratory pattern will result in binned motion states with little or no counts at various projection angles. The reduced counts result in limited-angle reconstruction artifacts which can impact the accuracy of the necessary motion estimation needed to correct the images. In this work, the authors investigate a method to overcome the effect of limited-angle reconstruction artifacts in SPECT when estimating respiratory motion.
Methods: In the first pass of the reconstruction method, only the projection angles with significant counts in common between the binned respiratory states are used in order to better estimate the motion between them. After motion estimation, the estimates are used to correct for motion within iterative reconstruction using all of the acquired projection data.
Results: Using simulated SPECT studies based on the NCAT phantom, the authors demonstrate the problem caused by having data available for only a limited number of angles when estimating motion and the utility of the proposed method in diminishing this error. For NCAT data sets with a clinically appropriate level of Poisson noise, the average registration error for motion with the proposed method was always less with the use of their algorithm, the reduction being statistically significant (p<0.05) in the majority of cases. The authors illustrate the ability of their method to correct the degradations caused by respiratory motion in short-axis slices and polar maps of the NCAT phantom for cases with 1 and 2 cm amplitudes of respiratory motion. In four cardiac-perfusion patients acquired on the same day, the authors demonstrate the large variability of the number of counts in the amplitude-binned projections. Finally, the authors demonstrate a visual improvement in the slices and polar maps of patient studies with the algorithm for respiratory motion correction.
Conclusions: The authors’ method shows promise in reducing errors in respiratory motion estimation despite the presence of limited-angle reconstruction effects due to irregularity in respiration. Improvements in image quality were observed in both simulated and clinical studies.
Keywords: irregular breathing, cardiac SPECT, motion correction
INTRODUCTION
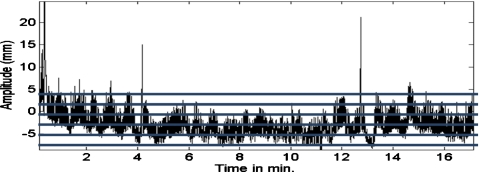
Respiratory motion combined with the “upward creep” of the heart can result in up to 10–20 mm displacement of the heart during imaging. Such motion affects the perceived regional localization in the myocardial walls, thereby impacting the diagnostic accuracy of cardiac PET or SPECT perfusion images. Several groups have investigated respiratory motion estimation and compensation in PET and SPECT.1, 2, 3, 4, 5, 6 Motion estimation can be done by binning data acquired in list-mode into projections of different respiratory states using an external device which tracks a signal related to respiratory volume. The binned projection data corresponding to each state are then reconstructed. One of the states is chosen as a reference and 3D registration is used to estimate the motion needed to align the heart in the other states to this reference state. Binning can be based on the relative position within the respiratory cycle, which is called phase binning, or it can be based on the magnitude of the signal from the external device tracking respiration, which is called amplitude binning. Due to the significant variability in respiratory pattern seen clinically as illustrated in Fig. 1, amplitude binning of the list-mode data has been determined to be more accurate than phase binning and thus, in general, it is favored.7
Figure 1.
Plot of amplitude signal from a pneumatic bellows wrapped around the abdomen of a patient undergoing cardiac SPECT imaging. Horizontal lines are overlaid on the graph to illustrate five intervals used for amplitude binning. Note that in an actual clinical application, nine intervals would be used and the events whose respiratory signal was beyond that of the top and bottom intervals would be folded in with counts from those intervals.
In PET where all projection angles can be acquired simultaneously, all the angles will be present in the list-mode data used to reconstruct each respiratory state. Also with PET, a nonuniform binning interval or a combination of intervals can be used to assure roughly uniform count statistics within each reconstructed state.3 Given this, the slices for each respiratory motion state are reconstructed using a similar set of projection angles and with similar counting statistics. Thus, PET motion estimation is not handicapped by variation in counts or projections angles present between the motion states. However, in cardiac SPECT, only two projection angles are typically acquired at any time. Thus, in SPECT, when the respiratory motion of the patient is irregular, many projection angles will potentially contribute little or no counts to the reconstruction of slices for a given respiratory state. The result will be limited-angle reconstruction artifacts in the reconstructed slices of that state. We will demonstrate in this work that such artifacts limit the accuracy of motion estimation between the slices of this state and the reference state, thus impacting respiratory motion compensation. One could alleviate some of these problems by adapting the size of the intervals used in amplitude binning to be sure that all or most projection angles are present; however, this will greatly limit the extent of respiratory motion which can be estimated and corrected.
Section 2 details our algorithm for overcoming the problem of estimating and correcting respiratory motion in cardiac SPECT with amplitude binning when respiration is irregular. The estimation of motion is done by preprocessing the projections to bring the reconstructed slices structurally closer before registering them for motion estimation. Once the motion across the respiratory states has been estimated, we reconstruct using the estimated motion in existing motion-correction iterative-reconstruction methods.8, 9, 10 In this last step, all the raw acquired counts are utilized in reconstruction. Section 3 details the materials, methods, and data analysis used to investigate our algorithm. This includes both our studies with the NURBS-based cardiac-torso (NCAT) phantom, where we can know the truth, and actual clinical studies, where we illustrate the problem we are proposing to address and utility of our algorithm at solving it. Section 4 provides the results of this investigation. In Section 4 we discuss our results and in Sec. 5 we provide our conclusions.
ALGORITHM FOR RESPIRATORY MOTION ESTIMATION AND CORRECTION
Our goal is to reduce the effects of irregular counts within the projections of respiratory-gated motion states using amplitude -binning. Reducing these effects will greatly improve the estimation of motion between the bins, leading to better correction of the data and improved image reconstruction. This is achieved by the following methods.
Determination of projections to be used in motion estimation and their normalization
We start by comparing the duration of acquisition for each angle of each state to the duration assuming the ideal case of even temporal sampling which we call teven. This teven is determined as
| (1) |
If the acquisition time of a projection is less than a threshold fraction of teven determined experimentally herein as discussed in Sec. 3E, we reject this projection from inclusion when reconstructing the slices to estimate the respiratory motion of this state. If the acquisition time of a projection is equal to or more than the determined threshold fraction of teven, we normalize the projection to bring count levels (up or down as appropriate) to correspond to having been acquired by an acquisition time equal to teven. The normalization is performed by multiplying by a scale factor determined as
| (2) |
where tactual is the actual duration of acquisition for the individual respiratory binned projection. This corrects the counts such that they approximate the number that would have been acquired in each binned projection if all had been acquired for the same amount of time. Such a normalization was also used by Kovalski, et al.4 in their respiratory motion-correction methodology. One could also envision the scale factor as having been divided into the denominator of the maximum likelihood expectation maximization (MLEM) reconstruction update equation to scale the projected values of the current voxel estimates as having been acquired during the teven time interval to that of tactual. The normalization changes the noise in the projections so as to no longer be Poisson; however, normalization is done only when estimating the motion. As we show in our results, our intensity-based registration method is robust to the ensuing differences in noise characteristics across bins.
Matching of projection angles used in reconstruction between reference and test states
By rejecting projections with low counts, there will likely be some angles in test states which are not present in the reference state or vice versa. This will contribute to structural dissimilarity in the reconstructed slices, potentially leading to registration errors when estimating motion. Our approach for overcoming this difficulty is to retain only projections for an angle when both projections for the two states, between which motion is being estimated, are present for that angle. Thus, if limited-angle effects are present in the slices reconstructed from one state, they are introduced in the same way in the other state. After this step, it is expected that the primary difference between the two states is the motion and not the structural dissimilarity due to a different number of angles being used in reconstruction. This point is illustrated in Fig. 2, which shows coronal slices reconstructed from Monte Carlo simulations of the NCAT phantom.11 Figure 2a shows end-inspiration coronal slice reconstructed from the NCAT simulation with two angles retained per SPECT camera head. Figure 2b shows midinspiration coronal slice (reference state) reconstructed using all 60 simulated projection angles. Note the striking difference in the appearance of the slices reconstructed from all [Fig. 2b] versus a limited number of projection angles [Fig. 2a]. Figure 2c shows the midinspiration coronal slice this time reconstructed with two angles retained per head as per Fig. 2a. Note that Fig. 2c is structurally closer to Fig. 2a than Fig. 2b was, thus enabling better registration.
Figure 2.
(a) End-inspiration coronal slice reconstructed from the NCAT simulation with two angles retained per SPECT camera head. (b) Midinspiration coronal slice reconstructed using all 60 simulated projection angles. Note that the heart is segmented in (b) as it would be for the reference slices to focus motion estimation on the heart region during registration. (c) Midinspiration coronal slice reconstructed with two angles retained per head as per (a). Note that (c) is structurally closer to (a) than (b) is, thus enabling better registration.
In extreme cases where no or too few angles are common between a test state and the reference state, the test state would be registered to an intermediary respiratory state whose motion has been estimated relative to the reference state.
Registration of reference and test state slices to estimate motion
The MLEM reconstruction method was used to reconstruct 3D data sets from the preprocessed projections. Reconstruction included compensation for attenuation, scatter, and spatial resolution.12 Attenuation correction was performed by accounting for attenuation in both the projection and backprojection steps of the MLEM reconstruction. For simulations, the attenuation correction used attenuation maps averaged over the motion bins. For clinical studies, the attenuation map for each case was derived from sequential transmission imaging.13 Transmission imaging was performed during natural patient breathing. Thus, these attenuation maps include the average respiratory motion that occurred during the period of transmission imaging. Scatter correction was by the triple energy window (TEW) method14 using a simulated or acquired scatter window. The counts in the scatter window were low-pass filtered to suppress noise15 and scaled as per the algorithm. They were then added to the estimated projections in the denominator as opposed to being subtracted from the actual projection data in the numerator. This avoided negative values in the MLEM reconstruction.15 Spatial resolution correction was included as it has been shown to improve the detection of coronary artery disease12 and to improve the effectiveness of respiratory motion correction.16 This correction was accomplished by modeling the distance-dependent spatial resolution of the SPECT cameras, in the projection and backprojection steps of MLEM, as a 2D Gaussian whose full-width-at-half-maximum varies with distance in accordance to measured values.12 The number of iterations used for reconstruction was determined empirically using the NCAT phantom (as detailed in Sec. 3C). The spatial resolution correction resulted in sufficient reduction in noise levels such that no postreconstruction smoothing was necessary.
Prior to registration, we segmented an ellipsoidal volume-of-interest around the heart in the reference data set as illustrated in Fig. 2. By doing this, the motion estimated is that of the heart and not that of extracardiac sources of activity, such as the liver, which can have different respiratory motion than the heart.17, 21
An intensity-based registration was used to estimate the motion necessary to align the heart across the motion states. The registration used as its criterion the minimization of the sum-squared-difference (SSD)17, 18, 19, 20 between the reference and the test motion states. The SSD is defined as
| (3) |
where I1(x,y,z) are the intensities in the heart volume of the reconstructed reference data set, I2(x,y,z) are the intensities for the test state which is to be registered to the reference, and T is the transformation being estimated. T can be, in general, a 12-degree-of-freedom (DOF) affine transformation with three scales, three shears, three rotational, and three translational components.18 In studies of patients imaged by MRI and CT, superior∕inferior (SI) translation has been determined to be the dominant motion of the heart with respiration.17, 18 Translational motion in the anterior∕posterior (AP) direction was found to be close to a factor of 3 less than that in the SI direction. Medial∕lateral translation and rotations about any of these axes were typically of even less significance, as were changes in scale and shear. Thus we considered only the translational and rotational motion components of the heart (6-DOF) when estimating respiratory motion between states for both simulated NCAT and clinical studies. The optimizer used to minimize the SSD metric was gradient descent.18 We calculated the gradients analytically for efficiency.
Final MLEM reconstruction using the estimated motions
Motion compensation is performed in a second pass through a MLEM reconstruction method where we use the original (not normalized or processed) projections for each state and their motion estimates obtained as detailed in Sec. 2C. The motion compensation technique is that described by Feng et al.9 Briefly, for all the motion states besides the reference state, the current estimate of the object volume is repositioned from the reference state to that of the motion state. The estimated projections plus the scatter estimate are then compared to the actual projections, the results backprojected and realigned with the reference state. Trilinear interpolation was used for the realignment.10 The reconstruction was performed using the MLEM method and included attenuation correction, scatter correction, and resolution compensation as per Sec. 2C. The sole difference from the estimation stage reconstruction was that now, 40 iterations of MLEM were used as the number at which the visual appearance of the slices stabilized prior to additional iterations exacerbating the noise level. Also, no added postreconstruction filtering was performed so as to better enable the visualization of the impact of respiratory motion correction in the slices and polar maps.
NCAT PHANTOM AND PATIENT STUDIES
Simulation of cardiac SPECT imaging with the NCAT phantom
To investigate our methodology under controlled conditions, we conducted studies using simulations of Tc-99m sestamibi cardiac-perfusion SPECT imaging. The source and attenuation distributions were created using the NCAT phantom.11 Respiratory motion of the heart is typically significantly less in extent than that of the diaphragm.17, 21 Thus, the NCAT phantom we used was specifically modified to allow differences in the extent of respiratory motion of the heart and other structures around it, such as the liver. The relative concentration of activity in the liver, gall bladder, kidneys, and spleen were one-half that of the heart. The background was 1∕10 that of the heart. Distributions for a total of 36 respiratory states were created, equally subdividing a 2 cm extent of motion of the heart in the SI direction and 6 mm in the AP direction. This range of motion was selected to match the maximal range of motion typically seen during imaging,17, 18 allowing for additional motion due to upward creep.22 We also simulated a second set of data sets with 1 cm extent of motion of the heart in the SI direction and 3 mm in the AP direction. This is the range typically seen for patients in the absence of significant upward creep.
For each of these two motion extents of the NCAT, three cardiac configurations were created. For configuration I we used the standard angulation of the heart in the NCAT (i.e., −90°, −20°, and −50° rotations about x, y, and z axes) with a uniform distribution of activity within the myocardial walls. In configuration II, this was modified by the inclusion of a large perfusion defect in the basal region of the inferior-lateral wall. The angular extent of the defect around the left ventricular wall was 60° and it extended 60 mm in the long-axis direction. The addition of the perfusion defect was to allow us to investigate the impact of respiratory motion and our correction algorithm on the visibility of defects. In configuration III of the NCAT phantom, we changed the orientation of the heart to be perpendicular to the axial axis of the body (i. e., rotations of −90°, 0°, and 0° about x, y, and z axes). This positioning of the heart provides maximal sensitivity to blurring of the anterior and inferior walls of the heart with SI (axial) motion and thus provides an excellent test case for correction of respiratory motion.
We used the SIMIND Monte Carlo software23 to simulate a typical two-headed SPECT acquisition and generated projections for all the 36 respiratory states for each of the NCAT source and attenuation map combinations created. Each of the two heads of the SPECT system was simulated as acquiring 30 evenly spaced projections while rotating 90°, for a total of 60 projections over 180°. The projection size was 128×128 with a pixel dimension of 4.67 mm. Imaging was simulated as acquisition by low-energy-high-resolution (LEHR) parallel collimators whose parameters matched those of the collimators used in our clinic. Acquisition was simulated as occurring for a 15% photopeak window centered on the photon emission energy of Tc-99m of 140 keV. An 8% scatter window centered at 123 keV was also created for use in TEW scatter correction.14, 15 Projection images contained both the primary and scattered photons that were recorded within the windows. Approximately 433×106 photons per projection per respiratory state were simulated, yielding low-noise projection images in comparison with clinical studies.
Formation of projection sets with clinically relevant noise and differences in projection number between test and reference projection states
Since dividing the counts from a SPECT cardiac acquisition into 36 respiratory motion states would result in very noisy individual states, the 36 low-noise projection sets were combined into groups of four to create sets with nine motion states. Noise was added to the projections for each state such that total counts in the nine motion states was 7.5×10⁶, matching that of the average counts determined in a series of ten clinical acquisitions performed in our clinic. Note that collapsing the 36 states to 9 resulted in each of these 9 states actually being a combination of counts from the structures of the NCAT in four slightly different spatial distributions. This approximately simulates the clinical case, where continuous variation in motion is being sampled into nine motion bins. The expected motion was recalculated for the nine states taking into account this quantization. For the extreme states relative to the center state, the expected motions were now ±9.1 mm for the SI direction and ±2.7 mm for the AP direction.
We used these noisy projections to form sets where the number of projections in the reference and test states was increasingly different. The reference state was taken as the center state (state 5) and the test state was taken as the state with the deepest SI motion (state 9). The missing projection angles were grouped together instead of randomly distributed. This is because we have noted that missing chunks of angles cause bigger problems than angles missing at random. Also, as seen in Fig. 1, time varying trends in respiration can occur gradually leading to chunks of angles being missing. Due to the simultaneity of the acquisition of the two camera heads, if angles are missing from one head, the corresponding angles were simulated as missing from the other. The number of angles retained (NAR) per head for state 9 varied from 30 to 2 in steps of 2 at the start of acquisition, in the middle of acquisition, or at the end of acquisition for each head. We considered only the case when the counts were evenly divided between the nine respiratory motion states at a given angle so that states 5 and 9 each contained 1∕9 the counts acquired at the angle. Therefore, when using these simulated sets, usage of a threshold to reject angles is not needed nor is count normalization as the scaling factor would be 1.0. The creation and analysis of sets with uneven counts in states is detailed in Secs. 3E, 3F, where we investigate specific examples of respiratory irregularity.
Determination of the number of MLEM iterations to use with reconstruction when estimating motion
We used the projection data sets of Sec. 3B for determination of the number of iterations of MLEM to use when estimating motion. Details of the reconstruction were given in Sec. 2C. Our criterion for selection of an iteration number was minimization of the average registration error. The average registration error was calculated based on the vector displacements in mm between the expected locations of voxel centers as the result of the motion used in simulation and the locations of the voxels with application of the estimated 6-DOF motion. This vector displacement is averaged over all voxels in a 50×50×50 region centered on the heart to yield the average registration error. Calculated in this way, the average registration error combined the error in location of all the voxels in the heart region into a single measure due to all 6-DOF of motion estimated. We averaged this metric for all 15 NARs, for all three configurations of the NCAT, and for having the angles missing be from the start, middle, and end of acquisition. The number of MLEM iterations with the minimum combined average registration error was used thereafter whenever reconstructing slices for motion estimation.
Comparison of average registration errors as determined with and without use of our algorithm (for data sets in Section III.C)
The noisy projections for respiratory states 5 (reference) and 9 (test) of Sec. 3B were used in this study along with the number of iterations of MLEM as determined in Sec. 3C. We first determined the magnitude of the problem encountered when the number of projections used in reconstruction was less in the test state than in the reference state. This was accomplished by calculating the average registration error as a function of NAR, with the test state having the angles missing from the start, middle, or end of the acquisition, and the reference state with all the angles present, for each NCAT configuration. The utility of our algorithm for reducing this problem was then investigated by determining the registration error for the same NAR, but now our algorithm was used to match angles present in the reference state to that in the test state.
Determination of threshold for rejection of angles and test of motion correction in NCAT simulations
To determine the threshold for rejection of projection angles from being included in reconstruction when estimating motion and to test the impact of our proposed methodology, we used simulated NCAT images with known truth as to motion and clinically realistic irregularities in respiration. These studies were based on four patient list-mode SPECT studies acquired as detailed in Sec. 3G. From these clinical acquisitions, we obtained the number of 100 ms time intervals at each projection angle whose signal from the bellows wrapped about the patient’s abdomen fell within each of the nine amplitude-binned motion states into which the respiratory signal was divided. The relative number of time intervals for each respiratory state was then used to scale the NCAT projection counts unevenly, such that the total counts at each angle remains the same, and total counts across all the bins and the angles was 7.5×10⁶. One minor difference from the patient data was that the profiles were applied to acquisition of 60 projections over 180° and not an acquisition of 68 projections over 204°, as per the patient studies. We used the relative timing information from the first 30 angles acquired by each of the two camera heads. In this way we created NCAT studies for both the 1 and 2 cm maximum-amplitude cardiac-motion projection sets, which mimicked the respiratory pattern of each of the four patients. Thus we had available eight studies with irregular breathing, four of which would have cardiac motion of maximally 2 cm in SI and 6 mm in AP and four with 1 cm in SI and 3 mm in AP.
We applied our respiratory motion-correction algorithm to the 2 cm motion case sets and estimated the motion between each test state and the reference state for rejection thresholds, varying from 0.0 to 0.9 times the teven value of Eq. 1. Note that since some states did actually have zero counts at projection angles (even the reference state for patients 3 and 4), then even when the threshold was 0.0, there were angles rejected from inclusion when estimating motion in some cases. We then calculated the average registration error as previously defined for the extreme test motion states (1, 2, 8, and 9) relative to the reference state for the four “simulated-patient” NCAT studies for the three configurations. The threshold chosen for application in all further investigations herein was that at which the registration error averaged over all the studies was the lowest.
With the threshold so determined, we investigated the difference in registration error made by application of our correction algorithm for each of the “simulated-patient” NCAT studies for both the 1 and 2 cm motion amplitudes. This was done by determining the average registration error for all eight motion states relative to the reference state with the application of our algorithm (to preprocess the projections prior to reconstruction and motion estimation) and without our algorithm (no preprocessing prior to reconstruction and motion estimation) and comparing the results. The paired t-test was used to check for statistically significant differences between the two sets of registration errors.
Simulation and Analysis of a case of significant respiratory drift
We have observed that some patients have a drift in their tracked respiratory signal data. We simulated a case of significant drift with 14 of the 30 projections intact for each head for each motion state. The block of 14 projections started with the first 14 projections being intact for the first respiratory state and moved to starting two projections later for the next motion state and so on, as we progressed incrementally through the motion states. We simulated this for both the 1 and 2 cm motion amplitude cases. We applied our motion estimation algorithm using the rejection threshold as determined in the last section and calculated the average registration errors.
To investigate the visual impact on reconstructed slices using our algorithm relative to that done without, the motion estimated with our algorithm was used in the postestimation pass through reconstruction to estimate the final slices as discussed in Sec. 2D. Short-axis slices were then created from the transverse slices with and without motion correction. The orientation of the short-axis slices were independently optimized for each of the uncorrected and corrected cases. From the short-axis slices, polar maps24 were obtained by standard methods to allow an overall visual assessment of the impact of correction.
List-mode acquisition of clinical studies with a signal related to respiration
We acquired list-mode SPECT studies in four patients to investigate application of our algorithm to clinical studies. Clinical acquisition is detailed in this section. Processing of this data is presented in the next.
The software was provided by Philips Medical Systems (Cleveland, OH) to enable list-mode acquisition on our triple-head IRIX SPECT system. The possible events listed in the list-mode file are counts, time stamps, and gantry angles (for tomographic acquisition). Optionally, external analog and digital events can be interspersed within the list. The data are stored in the list-mode file sequentially in order of occurrence. For each count, the information stored is: Camera head detecting the photon, count location in a 2048×2048 matrix, and photon energy. A time stamp is written every 10 ms. This duration defines the temporal resolution for all events. Only the step-and-shoot gantry rotation mode is available with list-mode acquisition. Thus data is not acquired during rotation.
A nonmetallic pneumatic bellows was obtained from Lafayette Instruments Co. (Lafayette, IN) and wrapped around the patient abdomens. The bellows was connected to a pressure transducer, also from Lafayette Instruments Co. The transducer was attached to a laptop through a National Instruments Co. DAQCard-6062E acquisition card (Austin, TX). Variations in pressure due to stretching and compression of the bellows with respiration resulted in a variation in the recorded voltage from the pressure transducer. This was the respiratory signal used to amplitude bin the list-mode counts as a function of respiration.
The LABVIEW programming environment (National Instruments Co., Austin, TX) was used to create a graphical user interface (GUI) for recording the respiratory signal at 10 Hz, i.e., one measurement from the bellows every 100 ms.25 In addition, the LABVIEW GUI triggered the start of the SPECT acquisition and sent a synchronization signal consisting of a repeating pattern of +3 and −3 V levels with a period of 8 s to an analog input on the SPECT system for recording in the list-mode file. By knowing the time at which the synchronization signal was sent relative to the recording of the respiratory signal, a temporal matching was established between the respiratory signal recorded by the laptop and the emission events recorded in the list-mode file on the SPECT system.
Under Institutional Review Board approval and with informed consent, four patients undergoing 99mTc sestamibi cardiac-perfusion imaging on a selected day agreed to participate in this study. A bellows was placed around the abdomen at the umbilicus level. The placement and adjustment of the bellows required approximately 1 min to accomplish, was well tolerated by the patients, and was the sole modification to the standard imaging protocol as far as the patient was concerned.
The cardiac-stress list-mode acquisitions were performed on our IRIX gamma camera using LEHR collimators approximately 60 min following injection of 925–1110 MBq (25–30 mCi) of 99mTc-sestamibi. The acquisition duration was 19.8 s per projection. Sixty-eight projections were acquired with the two heads 102° apart. The first camera head started at 123° (approximately right anterior oblique in terms of patients) relative to 0° being the posterior direction. Step-and-shoot body-contouring gantry motion was used and the acquisition time was approximately 15 min depending on orbit definition. Events were recorded within a symmetric energy window centered on 140.5 keV with a width of 15%. A scatter window was also acquired which was centered at 120 keV with a 5% width. Sequential transmission imaging using the scanning 133Ba point sources of the Beacon system13 (Philips Medical Systems, Cleveland, OH) was utilized for the estimation of attenuation maps.
Amplitude binning and application of respiratory motion correction in clinical studies
We developed software to bin the 2048×2048 list-mode data into a set of 128×128 frames of 100 ms each for each projection angle at a pixel size of 4.67 mm. With an acquisition duration of 19.8 s per projection, this resulted in 198 projections of 100 ms being created for each projection angle. The 100 ms duration was chosen to match the frequency of acquisition of the respiratory signal. The respiratory signal data were thresholded to remove infrequent extreme values. This was done by dividing the respiratory signal range into 100 bins between the signal maximum and minimum values. The number of 100 ms time intervals for the entire acquisition with their signal value within each of these bins was then determined, as was the maximum number of intervals within any of the bins. A search was then conducted from bin 100 downward to find the first bin, which contained 10% or more of the maximum number of intervals per bin. All time intervals with a signal value above this level had their value truncated to this level. A similar process was used to truncate signal values at the low end of the range. The value of 10% was selected empirically based on visualizing the impact of this process on plots of the respiratory signal versus time for a number of patient acquisitions. The goal was to determine a value which clipped the infrequent spikes such as those seen in Fig. 1 near the start of acquisition, 4 min past the start, and between 12 and 13 min past the start of acquisition. The range of the remaining values was divided into nine uniform size intervals or states between the maximum (corresponding to the maximum inspiratory volume) and minimum (corresponding to the maximum expiratory volume). The choice of nine states was also empirical. Using fewer than nine would have increased the coarseness of binning and more than nine would have decreased the signal to noise ratio in the slices. For each projection angle, the 100 ms projections whose respiratory state fell in the same interval were summed to produce nine projections for that angle, one for each of nine intervals of the amplitude of respiratory motion. The variability in acquisition time for a given motion state with projection angle was analyzed to access the extent of the potential problem with angular representation in the projection sets of motions states.
The counts in the projection bins were thresholded and normalized as described in Secs. 2A, 2B and the motion between the states estimated as previously described in Sec. 2C. After motion estimation, the projections without normalization or thresholding for each state were used along with the motion estimates in iterative reconstruction to correct for motion as previously described in Sec. 2D. Short-axis slices with and without respiratory motion correction were compared visually as an index of the extent in change resulting from motion correction. The orientation of the short-axis slices were independently optimized for each of the uncorrected and corrected cases. From the short-axis slices, polar maps23 were obtained by standard methods to allow an overall visual assessment of the impact of correction.
RESULTS
Number of iterations to use when reconstructing slices for motion estimation
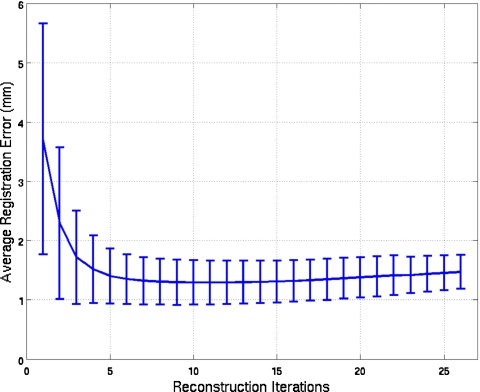
As described in Sec. 3C, we used simulated NCAT studies with a clinically relevant noise level to estimate the number of MLEM iterations to use when reconstructing the slices to estimate motion. Plotted as a function of number of iterations in Fig. 3 is the average registration error over the 3 NCAT configurations when the NAR goes from 30 to 2 for the first, mid, and end sections. The standard deviations at each iteration are plotted as error bars. Based on these results, we selected 11 iterations (where the error was the minimum) as the number to be used in our algorithm when applied to noisy projections, both simulated and clinical. From the figure, we observe that the standard deviations tend to diminish as the number of iterations increases.
Figure 3.
Average registration error and its standard deviation plotted versus the number of iterations for the three NCAT configurations used in our simulation study. For each configuration, the NAR per head goes from 30 to 2 for the first, mid, and end sections of the simulated SPECT acquisition.
Accuracy of motion estimation in the presence of Poisson noise in the NCAT simulations
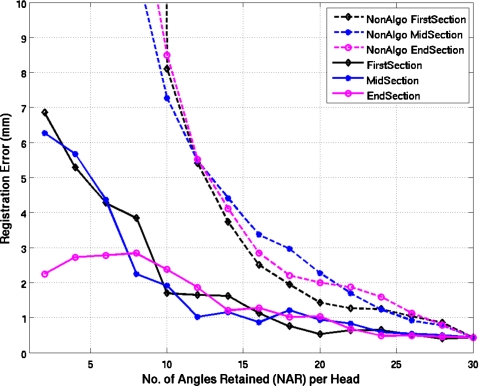
Figure 4 shows results for the estimation of the respiratory motion between the reference state 5 in the center of the range of amplitude states and the extreme state 9 for the first configuration of the NCAT phantom when clinically relevant Poisson noise is present in the simulated slices. The error in the registration results are given with and without the use of our algorithm. The error for the cases when our algorithm was not used quickly diverges from those when it was used with differences seen even when relatively few angles are missing. Even with the use of our algorithm, a trend toward increasing error is seen when NAR is less than 10. The results for NCAT configurations II and III were similar.
Figure 4.
Average registration errors (average over voxels) plotted as a function of the number of angles retained in test state nine for the first configuration (config I) of the NCAT phantom with default angulation of the heart and clinically relevant noise levels in the projections. Errors are plotted for when all angles are retained in reference state 5 (dashed lines), which is the standard methodology and when, as per our algorithm, only the angles in common between the two states are retained (solid lines). The two estimation methodologies are plotted for the NAR going from 30 to 2 in steps of 2 at the start, middle, or the end of acquisition for each head.
Determination of the threshold for rejection of projection angles
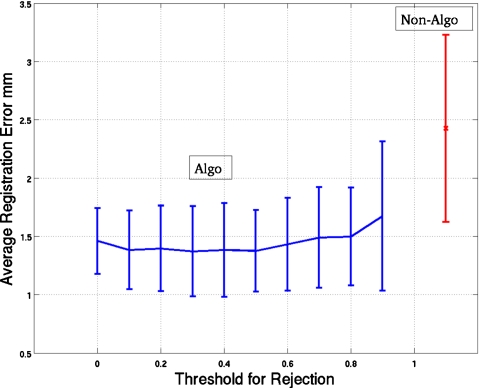
Figure 5 shows the average registration error plotted as a function of the threshold used to determine the inclusion of projection angles in reconstructing the slices for motion estimation. We used two extreme bins on each side of the reference bin (i.e., bins 1 and 2 and 8 and 9) to calculate the mean error, which was then averaged over the extreme four simulated respiratory patterns based on actual patient studies (Sec. 3E) for the three NCAT configurations with 2 cm maximal SI motion and 6 mm AP motion of the heart. Also plotted as error bars is the standard deviation of the mean-registration error (mean over bins) for each threshold value. The standard deviation is calculated over the four patientlike simulations for the three configurations, thus representing the variation across patientlike studies. We see that a wide range of thresholds maybe chosen for use in our algorithm. We selected the value for which the average error was minimum, namely, 0.3. This threshold was used throughout the rest of our investigations. By the paired t-test, the only statistical difference at p<0.05 in the average registration errors between 0.3 and the rest of the thresholds was for a threshold of 0.9. Thus our choice is arbitrary, but the nonsignificant variation over a large range of thresholds indicates our algorithm is not very sensitive to this parameter and hence is robust. Also plotted in Fig. 5 are the average registration error and its standard deviation for the case of not using the thresholding and scaling of our algorithm. By the paired t-test there was a statistically significant difference (p>0.05) between using our algorithm (with a threshold of 0.3) and not using our algorithm (that is not using any preprocessing step before reconstruction and motion estimation). This difference in registration error between using and not using our algorithm is investigated in more detail in Sec. 4D.
Figure 5.
Mean-registration error over four extreme bins (namely, bins 1, 2, 8, and 9) averaged for the four simulated patients for three NCAT configurations with the 2 cm motion in SI and 6 mm motion in the AP direction. Error is plotted as a function of the threshold (0.0–0.9) used to reject projections used in reconstructing the data sets used to perform the registration. The bars at each point are the standard deviations (of the mean errors over bins) over the four simulated patients and the three configurations. Also plotted are the average error and its SD for the case of not using our algorithm.
Comparison of average registration error for five simulated respiratory patterns
Table 1 shows the average registration errors for the NCAT simulated studies for four respiratory patterns based on actual patient studies described in Sec. 3E and the case we created for significant respiratory drift described in Sec. 3E for both 1 and 2 cm maximal heart SI motion. Comparison is made with and without the use of our algorithm when estimating motion. To clarify again, the “without” was where no preprocessing was done on the projections before estimating motion and the “with” was where the preprocessing including scaling and rejection of angles based on using a threshold of 0.3 before motion estimation. Note that the average error was the combined value for all eight nonreference respiratory motion states as estimated relative to the reference state. Thus it includes states near the reference state where there is little error and most projection angles are not rejected by application of our thresholding, as well as the extreme states where we expect larger mismatch with the reference state and a greater need for thresholding. Notice that even for this combined measure, our algorithm always results in a smaller error and the averages were lower by more than 2 mm in some cases for the respiratory profiles based on the patient studies. For the case of the respiratory profile with significant drift, the application of our algorithm results in a smaller error by as much as 5 mm. The differences in estimation error were statistically significant by the paired t-test at p<0.05 for more than one-half of the studies based on patientlike respiratory patterns and all of the studies for the case of significant respiratory drift.
Table 1.
Registration errors (mm) averaged over the eight test states for five different time profiles for respiration for two of the NCAT phantom configurations with two extents of motions. Compared are average errors and standard deviations (in brackets) without and with using our algorithm when estimating motion. The average and std are over the eight test states. The * indicate where a statistical difference was observed at p<0.05 by the paired t-test. The threshold factor used was 0.3.
| Configuration and magnitude SI motion | Time profile of patient 1 without∕with (mm) | Time profile of patient 2 without∕with (mm) | Time profile of patient 3 without∕with (mm) | Time profile of patient 4 without∕with (mm) | Time profile of drift case without∕with (mm) |
|---|---|---|---|---|---|
| Config II, 2 cm | 1.28 (0.78)∕0.89 (0.34) | 1.63 (0.85)∕1.18 (0.34) | 1.47 (0.71)∕1.05 (0.45) | 2.72 (1.95)∕0.68 (0.28)* | 6.43 (5.01)∕0.76 (0.49)* |
| Config III, 2 cm | 1.81 (0.92)∕1.26 (0.59)* | 1.80 (0.71)∕1.35 (0.80) | 2.54 (0.65)∕1.16 (0.46)* | 2.53 (1.41)∕1.68 (0.59) | 6.34 (5.26)∕1.05 (0.48)* |
| Config II, 1 cm | 1.2 (0.95)∕0.77 (0.28) | 2.05 (0.83)∕1.03 (0.19)* | 1.68 (0.64)∕0.87 (0.30)* | 3.21 (2.35)∕1.05 (0.24)* | 6.58 (5.24)∕0.66 (0.27)* |
| Config III, 1 cm | 1.30 (1.12)∕0.89 (0.47) | 1.60 (0.68)∕0.93 (0.42)* | 1.59 (0.70)∕0.92 (0.40)* | 1.91 (1.20)∕0.94 (0.41)* | 5.80 (4.45)∕0.65 (0.28)* |
Example short-axis slices and polar maps for the NCAT simulation with significant drift
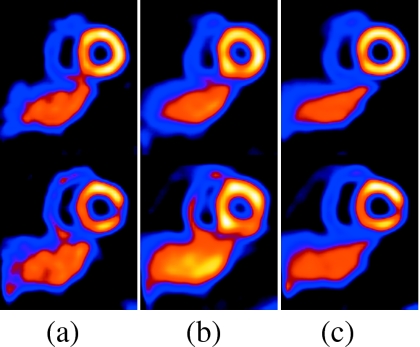
Figure 6 shows two selected short-axis slices for the NCAT simulations of configuration II (standard NCAT heart angulation and a perfusion defect in the basal inferior-lateral wall) with a 2 cm maximal SI respiratory motion of the heart for the case of significant respiratory drift. The reference slices (shown at the left) are reconstructions of simulations using all 7.5×10⁶ counts in the middle state. They serve as the standard against which the following slices can be compared to judge the impact of respiration. In the slices reconstructed without motion correction, a perfusion defect can be seen to appear in the inferior-lateral wall for the top short-axis slice and a significant distortion can be seen to appear in the known defect in the bottom slice. The slices reconstructed using our motion-correction algorithm, however, closely approximate the reference slices.
Figure 6.
The top and bottom rows show two short-axis slices for NCAT config II with 2 cm motion including drift. Slices in column (a) are reference, (b) are with motion but no correction, and (c) are with motion correction. In the top row, notice the reduction in the respiratory-motion-induced artifactual cooling of the heart after motion correction. In the bottom row, notice the reduction of the artifactual appearance, clearer visibility of lesion, better separation from the liver, and thinner appearance of the heart wall with correction. We did not use any postreconstruction smoothing so as to more clearly present the impact of respiratory motion and its correction on the images.
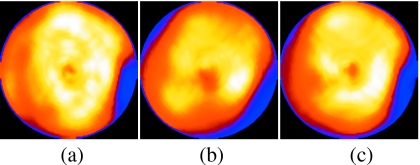
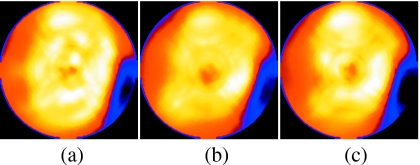
Shown in Fig. 7 are the left ventricular polar maps for the case in Fig. 6. Again the reference map is on the left, followed by the map for respiratory motion present but not corrected, and finally the map for respiratory motion present and corrected by our algorithm. Notice the blurring of the inferior-lateral wall lesion and the suggestion of increased cooling in the anterior and inferior walls in the map from the slices without motion correction. Also note that with respiratory motion correction, the map is largely returned to the appearance of the map from the reference slices. Figure 7 thus further illustrates the effects of respiratory motion on reconstructed images (2 cm motion) and demonstrates the success of our algorithm in correcting for these effects.
Figure 7.
Polar maps from the NCAT simulation with 2 cm motion including drift. Shown are the maps obtained from the three cases: (a) Reference, (b) no motion correction, and (c) with motion correction. Notice the distortion of the lesion in the lateral wall (right side of the polar map) and artifactual decreased uptake in the inferior wall without motion correction. With motion correction, the inferior wall artifact is reduced and the appearance of the lesion is closer to that of the reference.
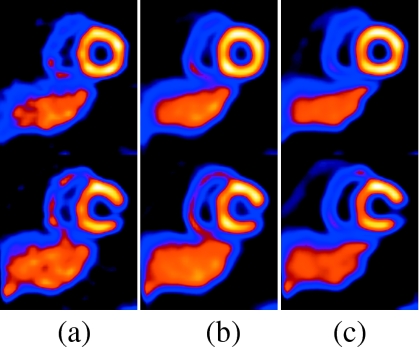
Figure 8 shows two selected short-axis slices for the same NCAT configuration as Fig. 6, except with a 1 cm maximal SI respiratory motion of the heart. Again, the reference slices are reconstructions of simulations using all 7.5×10⁶ counts in the middle state and are shown leftmost. Slices containing uncorrected motion are shown in the center and motion corrected slices are shown at the right. Not unexpectedly, the impact of motion correction is less significant for the 1 cm motion, but we still see the slices to be closer to the reference after correction than without correction.
Figure 8.
The top and bottom rows show two short-axis slices for NCAT config II with 1 cm motion including drift. Slices in column (a) are reference, (b) are with motion but no correction, and (c) are with motion correction. In the top row, notice that after correction, the lateral wall lesion is closer to the reference than without motion correction. In the bottom row, notice the slightly thinner heart wall with correction. We did not use any postreconstruction smoothing so as to clearly demonstrate the impact of the motion and its correction.
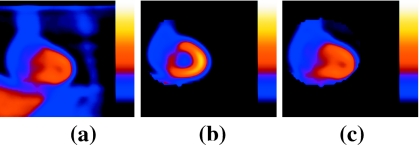
The polar maps for the 1 cm case are shown in Fig. 9. The reference map is on the left, followed by the map for respiratory motion present but not corrected, and finally the map for respiratory motion present and corrected by our algorithm. While the impact of the correction is not as significant as with 2 cm motion, there are some differences. For example, a better agreement can be seen in the size and shape of the inferior-lateral wall defect as well as a decrease in the artifactual cooling in the apical region.
Figure 9.
Polar maps from the NCAT simulation with 1 cm motion including drift. Shown are the same three cases: (a) Reference, (b) no motion correction, and (c) with motion correction. The map obtained with motion correction can be seen to better approximate that of the reference.
Illustration of the irregularity in respiration as seen clinically
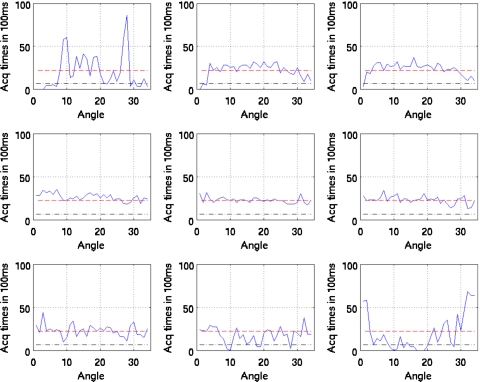
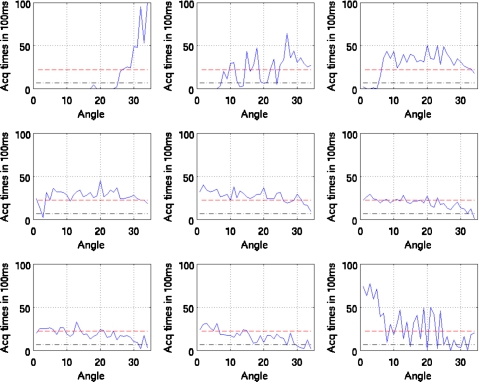
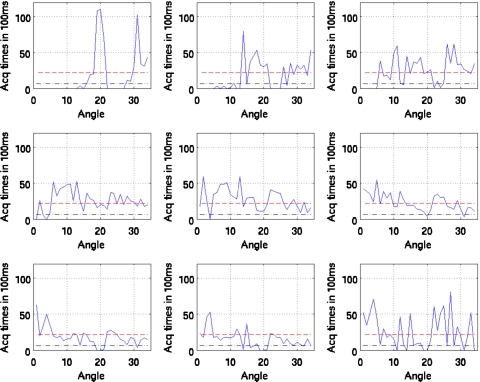
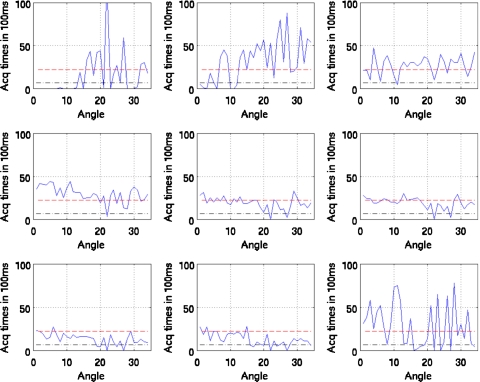
Figures 10111213 show the duration of SPECT acquisition in units of 100 ms for each of the nine amplitude-binned motion states plotted as a function of projection-angle number. Note that in each plot, the duration of acquisition is shown for only the first 34 angles acquired. With dual-headed acquisition, the second set of 34 angles is paired in acquisition with the first. Thus they are redundant and not shown
Figure 10.
Duration of SPECT acquisition in units of 100 ms for each of the nine amplitude-binned motion states plotted as a function of projection angle for patient 1. The dashed line shows the idealized case of all the respiratory motion states having evenly distributed time durations for the given angle (i.e., teven). The dotted and dashed lines show the threshold of 0.3 times teven used to reject inclusion of projections within reconstruction when estimating motion. Notice that states 1, 2, 3, 8, and 9 would have missing projection angles when estimating motion.
Figure 11.
Duration of SPECT acquisition in units of 100 ms for each of the nine amplitude-binned motion states plotted as a function of projection angle for patient 2. The dashed line shows the idealized case of all the respiratory motion states having evenly distributed time durations for the given angle (i.e., teven). The dotted and dashed lines show the threshold of 0.3 times teven used herein to reject inclusion of projections within reconstruction when estimating motion. Notice that all (nonreference) states would have missing projection angles when estimating motion.
Figure 12.
Duration of SPECT acquisition in units of 100 ms for each of the nine amplitude-binned motion states plotted as a function of projection angle for patient 3. The dashed line shows the idealized case of all the respiratory motion states having evenly distributed time durations for the given angle (i.e., teven). The dotted and dashed lines show the threshold of 0.3 times teven used herein to reject inclusion of projections within reconstruction when estimating motion. Notice that all states (even 5) would have missing projection angles when estimating motion.
Figure 13.
Duration of SPECT acquisition in units of 100 ms for each of the nine amplitude-binned motion states plotted as a function of projection angle for patient 4. The dashed line shows the idealized case of all the respiratory motion states having evenly distributed time durations for the given angle (i.e., teven). The dotted and dashed lines show the threshold of 0.3 times teven used herein to reject inclusion of projections within reconstruction when estimating motion. Notice that all states (even 5) would have missing projection angles when estimating motion.
Also note that all four patients show significant variation. The horizontal dashed line in each case shows the duration if the breathing was perfectly regular throughout the acquisition period. As detailed in Sec. 2, if the duration of acquisition falls below the threshold value (0.3 times the dashed line level), then that angle is not used in reconstruction to estimate the motion of the given state relative to the reference state. This level is shown in the figures.
Extent of respiratory motion in the clinical studies and the impact of its correction
We used 6-DOF registration for these patient studies to estimate the motion between a given state and the reference state which was selected as state 5. However, mainly SI translation was found to be significant. The approximate motions for the four patients were determined by taking the average vector displacement of voxels in a 50×50×50 region due to the difference of the motions estimated for states 1 9. This was determined to be 0.80 cm for patient 1, 0.91 cm for patient 2, 0.68 cm for patient 3, and 0.98 cm for patient 4.
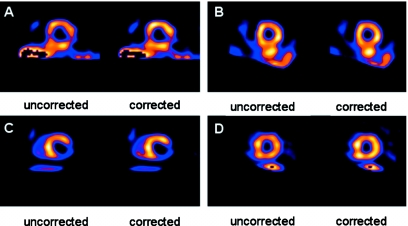
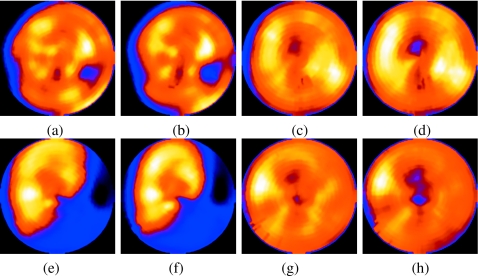
The motion estimation results were used within reconstruction to correct for respiratory motion. The degree of improvement in these patient images depended on a variety of factors such as extent of motion, the relative number of counts in the states with highest motion, and the orientation of the heart with respect to the direction of motion. In general, the change in the appearance of the slices for these four patients was modest as has been observed by others4 and expected by the above extent of the observed motion in comparison with the 12–15 mm FWHM system resolution for SPECT imaging in the heart region of the slices. To help visualize the changes, our reconstruction included the modeling of system spatial resolution,18 as well as attenuation and scatter compensation and we did not perform postreconstruction low-pass filtering. Thus for the four patients shown in Fig. 14, the differences with correction are more apparent then they would have been otherwise. For patient 1, we observed clearer liver-heart separation and better contrast of the lateral wall defect with correction. For patient 2, there is slightly better separation between the heart and the subdiaphragm activity. For patient 3, there is better uniformity of the anterior wall with correction. For patient 4, there is slightly better uniformity of uptake in the anterior and inferior walls and better separation from the subdiaphragmatic activity with correction. Figure 15 shows polar maps before and after correction for the four patients. Notice that for all four patients the significant features seen without correction are generally visualized better with correction, as one might expect with removal of a source of smoothing.
Figure 14.
Short-axis slices for the four SPECT 99mTc-sestamibi patients acquired on the same day. Patients 1–4 are shown without and with motion correction in (a)–(d), respectively. In patient 1, notice the slightly better separation from subdiaphragmatic activity, contrast of the lateral wall perfusion defect, and uniformity of anterior and inferior walls with correction. In patient 2, notice the slightly better separation from the subdiaphragmatic activity. For patient 3, there was a better uniformity of apparent uptake in the anterior wall with correction. In patient 4, there was a slightly better uniformity of uptake in the LV walls and separation from the subdiaphragmatic uptake with correction.
Figure 15.
Polar maps from short-axis slices of the same patients as in Fig. 14 without and with motion correction. Patient 1 is (a) and (b), patient 2 is (c) and (d), patient 3 is (e) and (f), and patient 4 is (g) and (h). Notice for all four patients that, generally, the significant features seen without correction are still visible with correction, but seen with higher contrast as one would expect with decreasing a source of smoothing (respiratory motion).
DISCUSSION
Our algorithm for motion estimation in the presence of irregular respiratory motion shows promising results. For the noisy NCAT simulations, the average registration error increased much more rapidly as the NAR decreased without use of our algorithm than with it as shown in Fig. 4. For the noisy NCAT simulations reported in Table 1, the average registration error with use of our algorithm was always less (statistically so in the majority of cases) when estimating the motion than when the motion was estimated without our preprocessing of the projections. The reconstructions with motion compensation for the NCAT simulation with 2 cm drift showed the inferior-lateral wall defect, separation of the heart from the liver, and heart wall thickness in better agreement with the reference slices. The improvement was less for the case of 1 cm drift, but definite differences were still noted. For the clinical data sets, we observed irregularity of breathing for all four patients. This is expected due to the long duration of the SPECT scans. Better separation between the heart and subdiaphragmatic activity, uniformity of the anterior and∕or inferior walls, and visualization of defects were noted in the slices of the four patients with motion correction. Higher contrast for structures in the polar maps was also generally seen with motion correction. It should be noted that the changes seen in these clinical studies are subjective as the truth for the regional wall agent localization is unknown. With these encouraging results, a comprehensive clinical investigation of our algorithm is indicated to determine its clinical utility in terms of improving the diagnostic accuracy of cardiac-perfusion imaging with SPECT for coronary artery disease.
These studies have concentrated on respiratory motion correction for the heart. From MRI studies in free-breathing volunteers, it is known that the motion of the heart is significantly less than that of the diaphragm.21 Thus, motion correction might be expected to result in even greater benefit for structures in the chest and abdomen than the heart. However, it is likely that nonrigid as opposed to rigid-body motion correction will be needed to correct multiple structures.5 Since the liver and other subdiaphragmatic structures do not move rigidly with the heart, it also may be that a nonrigid correction could further enhance the separation of the heart from such structures. The NCAT phantom used in this investigation was specifically altered so that the motion of the liver was nonrigid with that of the heart. Our limited simulation and clinical studies have not shown any significant artifacts in the heart we could ascribe to nonrigid liver motion. However, given the large variation in patient anatomy and physiology this issue warrants further investigation.
CONCLUSIONS
We presented a strategy to do postreconstruction estimation of respiratory motion for SPECT in the presence of limited-angle effects due to irregularity in respiration. The need for this correction was demonstrated in simulation using the NCAT phantom. We also showed the extent of irregularity of breathing in four SPECT patient studies. Improvements in image quality consistent with diminishing the degradations caused by respiratory motion were observed in both simulation and the clinical studies.
ACKNOWLEDGMENTS
This work was supported by the National Institute of Biomedical Imaging and Bioengineering Grant Nos. R01 EB001457 and R01 EB002798 and a grant from Philips Medical Systems. The contents are solely the responsibility of the authors and do not necessarily represent the official views of the National Institutes of Health or Philips Medical Systems. Part of this work was presented at the 2008 IEEE NSS-MIC conference and published in the proceedings26 and the clinical material was presented at the SNM Annual Meeting in 2010. The authors thank the reviewers and associate editor for their significant help in improving this manuscript.
References
- Klein G. J., Reutter R. W., and Huesman R. H., “Four-dimensional affine registration models for respiratory-gated PET,” IEEE Trans. Nucl. Sci. 48, 756–760 (2001). 10.1109/23.940159 [DOI] [Google Scholar]
- Livieratos L., Stegger L., Bloomfield P. M., Schafers K., Bailey D. L., and Camici P. G., “Rigid-body transformation of list-mode projection data for respiratory motion correction in cardiac PET,” Phys. Med. Biol. 50(14), 3313–3322 (2005). 10.1088/0031-9155/50/14/008 [DOI] [PubMed] [Google Scholar]
- Livieratos L., Rajappan K., Stegger L., Schafers K., Bailey D. L., and Camici P. G., “Respiratory gating of cardiac PET data in list-mode acquisition,” Eur. J. Nucl. Med. Mol. Imaging 33, 584–588 (2006). 10.1007/s00259-005-0031-0 [DOI] [PubMed] [Google Scholar]
- Kovalski G., Israel O., Keidar Z., Frenkel A., Sachs J., and Azhari H., “Correction of heart motion due to respiration in clinical myocardial perfusion SPECT scans using respiratory gating,” J. Nucl. Med. 48(4), 630–636 (2007). 10.2967/jnumed.106.037390 [DOI] [PubMed] [Google Scholar]
- Lamare F., Ledesma Carbayo M. J., Cresson T., Kontaxakis G., Santos A., Le Rest C. C., Reader A. J., and Visvikis D., “List-mode-based reconstruction for respiratory motion correction in PET using non-rigid body transformations,” Phys. Med. Biol. 52(17), 5187–5204 (2007). 10.1088/0031-9155/52/17/006 [DOI] [PubMed] [Google Scholar]
- Bruyant P. P., Feng B., Pretorius P. H., Dahlberg S. T., and King M. A., “Compensation of respiratory motion in cardiac SPECT with list-mode acquisition and an external respiration-tracking device,” J. Nucl. Cardiol. 11, S34–S34 (2004). 10.1016/j.nuclcard.2004.06.111 [DOI] [Google Scholar]
- Lu W., Parikh P. J., Hubenschmidt J. P., Bradley J. D., and Low D. A., “A comparison between amplitude sorting and phase-angle sorting using external respiratory measurement for 4D CT,” Med. Phys. 33, 2964–2974 (2006). 10.1118/1.2219772 [DOI] [PubMed] [Google Scholar]
- Li T., Thorndyke B., Schreibmann E., Yang Y., and Xing L., “A model-based image reconstruction for four-dimensional SPECT,” Med. Phys. 33(5), 1288–1298 (2006). 10.1118/1.2192581 [DOI] [PubMed] [Google Scholar]
- Feng B., Gifford H. C., Beach R. D., Boening G., Gennert M. A., and King M. A., “Use of three-dimensional Gaussian interpolation in the projector∕backprojector pair of iterative reconstruction for compensation of known rigid-body motion in SPECT,” IEEE Trans. Med. Imaging 25, 838–844 (2006). 10.1109/TMI.2006.871397 [DOI] [PMC free article] [PubMed] [Google Scholar]
- Dey J. and King M. A., “Theoretical and numerical study of MLEM and OSEM reconstruction algorithms for motion correction in emission tomography,” IEEE Trans. Nucl. Sci. 56, 2739–2749 (2009). 10.1109/TNS.2009.2021765 [DOI] [PMC free article] [PubMed] [Google Scholar]
- Segars W. P., Lalush D. S., and Tsui B. M. W., “A realistic spline-based dynamic heart phantom,” IEEE Trans. Nucl. Sci. 46(3), 503–506 (1999). 10.1109/23.775570 [DOI] [Google Scholar]
- Narayanan M. V., King M. A., Pretorius P. H., Dahlberg S. T., Spencer F., Simon E., and Ewald E., Healy E., MacNaught K., and Leppo J. A., “Human observer ROC evaluation of attenuation, scatter and resolution compensation strategies for Tc-99m myocardial perfusion imaging,” J. Nucl. Med. 44, 1725–1734 (2003). [PubMed] [Google Scholar]
- Gagnon D., Tung C. H., Zeng G. L., and Hawkins W., “Design and early testing of a new medium-energy transmission device for attenuation correction in SPECT and PET,” in Conference Record of the 1999 IEEE Nuclear Science Symposium, Seattle, WA, 24–30 October 1999. (unpublished).
- Ogawa K., Ichihara T., and Kubo A., “Accurate scatter correction in single photon emission CT,” Ann. Nucl. Med. 7, 145–150 (1994). [Google Scholar]
- King M. A. et al. , “An investigation of the filtering of TEW scatter estimates used to compensate for scatter with ordered subset reconstructions,” IEEE Trans. Nucl. Sci. 44, 1140–1145 (1997). 10.1109/23.596978 [DOI] [Google Scholar]
- Kovalski G., Keidar Z., Frenkel A., Isreal O., and Azhari H., “Correction for respiration artefacts in myocardial perfusion SPECT is more effective when reconstructions supporting collimator detector response compensation are applied,” J. Nucl. Cardiol. 16, 949–955 (2009). 10.1007/s12350-009-9148-z [DOI] [PubMed] [Google Scholar]
- McLeish K., Hill D. L. G., Atkinson D., Blackall J. M., and Razavi R., “A study of the motion and deformation of the heart due to respiration,” IEEE Trans. Med. Imaging 21(9), 1142–1150 (2002). 10.1109/TMI.2002.804427 [DOI] [PubMed] [Google Scholar]
- Dey J., Pan T., Choi D. J., Robotis D., Smyczynski M. S., Pretorius P. H., and King M. A., “Estimation of cardiac respiratory-motion by semi-automatic segmentation and registration of non-contrast-enhanced 4D-CT cardiac datasets,” IEEE Trans. Nucl. Sci. 56(6), 3662–3671 (2009). 10.1109/TNS.2009.2031642 [DOI] [PMC free article] [PubMed] [Google Scholar]
- Hutton B. F., Braun M., Thurfjell L., and Lau D. Y. H., “Image registration: An essential tool for nuclear medicine,” Eur. J. Nucl. Med. 29, 559–577 (2002). 10.1007/s00259-001-0700-6 [DOI] [PubMed] [Google Scholar]
- Thevenaz P., Ruttimann U. E., and Unser M., “A pyramid approach to subpixel registration based in intensity,” IEEE Trans. Image Process. 7(1) 27–41 (1998). 10.1109/83.650848 [DOI] [PubMed] [Google Scholar]
- Nehrke K., Bornert P., Manke D., and Bock J., “Free-breathing cardiac MR imaging: Study of implications of respiratory motion-initial results,” Radiology 220, 810–815 (2001). 10.1148/radiol.2203010132 [DOI] [PubMed] [Google Scholar]
- Friedman J. et al. , “‘Upward creep’ of the heart: A frequent source of false-positive reversible defects during thallium-201 stress-redistribution SPECT,” J. Nucl. Med. 30(10), 1718–1722 (1989). [PubMed] [Google Scholar]
- Ljungberg M. and Strand S. E., “A Monte Carlo program simulating scintillation camera imaging,” Comput. Methods Programs Biomed. 29, 257–272 (1989). 10.1016/0169-2607(89)90111-9 [DOI] [PubMed] [Google Scholar]
- Van Train K. F. et al. , “Quantification of rotational thallium-201 myocardial tomography,” J. Nucl. Med. 34, 1494–1502 (1993). [PubMed] [Google Scholar]
- Bruyant P. P. et al. , “A robust visual tracking system for patient motion detection in SPECT: Hardware solutions,” IEEE Trans. Nucl. Sci. 52, 1288–1294 (2005). 10.1109/TNS.2005.858208 [DOI] [PMC free article] [PubMed] [Google Scholar]
- Dey J., Segars W. P., Pretorius P. H., and King M. A., “Estimation and correction of irregular respiratory motion of the heart in SPECT in presence of partial angle effects due to amplitude binning in SPECT,” in Proceedings of the 2008 IEEE NSS-MIC, Dresden, Germany, pp. 3656–3662, 21–25 October 2008.


