Abstract
Background
The present study investigated whether changes in gene expression in the right ventricle following pulmonary hypertension can be attributed to hypoxia or pressure loading.
Methodology/Principal Findings
To distinguish hypoxia from pressure-induced alterations, a group of rats underwent banding of the pulmonary trunk (PTB), sham operation, or the rats were exposed to normoxia or chronic, hypobaric hypoxia. Pressure measurements were performed and the right ventricle was analyzed by Affymetrix GeneChip, and selected genes were confirmed by quantitative PCR and immunoblotting. Right ventricular systolic blood pressure and right ventricle to body weight ratio were elevated in the PTB and the hypoxic rats. Expression of the same 172 genes was altered in the chronic hypoxic and PTB rats. Thus, gene expression of enzymes participating in fatty acid oxidation and the glycerol channel were downregulated. mRNA expression of aquaporin 7 was downregulated, but this was not the case for the protein expression. In contrast, monoamine oxidase A and tissue transglutaminase were upregulated both at gene and protein levels. 11 genes (e.g. insulin-like growth factor binding protein) were upregulated in the PTB experiment and downregulated in the hypoxic experiment, and 3 genes (e.g. c-kit tyrosine kinase) were downregulated in the PTB and upregulated in the hypoxic experiment.
Conclusion/Significance
Pressure load of the right ventricle induces a marked shift in the gene expression, which in case of the metabolic genes appears compensated at the protein level, while both expression of genes and proteins of importance for myocardial function and remodelling are altered by the increased pressure load of the right ventricle. These findings imply that treatment of pulmonary hypertension should also aim at reducing right ventricular pressure.
Introduction
Pulmonary arterial hypertension is a heterogeneous group of disorders characterized by increased pulmonary artery pressure and resistance as a result of pulmonary vascular remodeling, active vasoconstriction, and in-situ thrombosis. The increased pressure load results in right ventricular hypertrophy representing an initial stage which can progress to failure and death [1]. The current treatments with prostaglandin (PGI2) analogues (e.g. epoprostenol), endothelin receptor antagonists (e.g. bosentan), and phosphodiesterase 5 inhibitors (e.g. sildenafil) have markedly improved the prognosis of the disease [2]. Direct inotropic effects of epoprostenol on the right ventricle was described [3], [4] and that bosentan reduces cardiac fibrosis and hypertrophy [5]. However, these treatments are mainly vasodilatory and antiproliferative, and hence targeting the vasculature rather than the right ventricle in pulmonary hypertension.
Parameters of right ventricular function such as cardiac index and mean right atrial pressure are the most important determinants of survival in pulmonary arterial hypertension [1]. Multiple signal transduction pathways are known to be involved in the remodeling of the heart [6]. Although it is a matter of debate which mechanisms are important for transition to failure and hypertrophy, failure of the left ventricle are characterized to varying degrees by changes in extracellular matrix composition, energy metabolism, contraction, adrenergic signaling, and calcium handling [7]. In the right ventricle from chronic hypoxic rats gene expression studies have suggested a switch of metabolic genes suggesting that the hypertrophic right ventricle changes from fatty acid to glucose oxidation [8], and a recent microarray study of the right ventricle from rats with monocrotaline-induced pulmonary hypertension suggested that pro-apoptotic pathways and intracellular calcium handling enzymes play a role for development of failure [9]–[11] while growth genes such as mitogen activated protein kinase (MAPK) are pivotal in compensated hypertrophy [9]. However, in contrast to the thick-walled left ventricle, the right ventricle has a concave thin wall opposite to the convex interventricular septum, and the anatomic response to pressure overload of the right ventricle is different from the left ventricle [1], hence suggesting that other signaling pathways may play a role for development of right ventricular hypertrophy in response to pressure load.
Global gene analysis has been employed to map the expression profile of cardiac hypertrophy in man [12] and in the lungs and peripheral blood cells from patients with severe pulmonary arterial hypertension [13], [14] as well as in lungs of mice with hypoxic pulmonary hypertension [15]. These types of global gene analyses are believed to be of significant value both for understanding and predicting disease processes also in pulmonary hypertension [16].
The present study investigated the changes in global gene expression by gene chip analysis during the development of right ventricular hypertrophy induced by chronic hypoxic pulmonary hypertension in rats. Most of the regulated genes in the hypoxic model were expected to be associated to the adaptive response to sustain right ventricular output, but some may be exclusively associated to hypoxia. Therefore, gene expression changes were also analyzed in rats undergoing pulmonary trunk banding (PTB), another animal model for pressure loading of the right ventricle. The alterations in expression of a subset of genes were confirmed by quantitative realtime polymerase chain reaction (qPCR), immunoblotting, and immunohistochemistry.
Methods
Ethics Statement
All animal procedures followed the revised NIH publication no. 86–23, entitled: “Principle of laboratory animal care”, and were performed according to the Danish legislation with permission (no. 2006/561–1160) from the Animal Surveillance Committee, The Danish Ministery of Justice.
Animal models of right ventricular hypertrophy
48 male Wistar rats (10 weeks, weight approximately 290 grams) were divided into two groups of 24 animals. Each group was divided into subgroups of six animals. Four subgroups were maintained at hypobaric, hypoxic pressure. Four subgroups were maintained at normobaric, normoxic pressure and served as controls (Table 1). The hypoxic group was placed in a hypobaric chamber, where the ambient pressure was continuously held at 500 mbar which was equivalent to rats breathing 10% oxygen at standard pressure. The temperature in the chamber was maintained at 21–22°C and the chamber was ventilated with air at approximately 45 l min−1 through an inlet valve with the aid of a vacuum pump. The four subgroups were maintained in these hypoxic, hypobaric conditions for 1, 2, 3 or 4 weeks and studied immediately after removal from the chamber. The hypoxic chamber was opened once a week for approximately 30–40 minutes for cleaning and supplying purposes. Age-matched controls were maintained in similar but normoxic, normobaric chambers. All animals were provided with chow and water ad libitum.
Table 1. Experimental design.
| Animal groups | Week 1 | Week 2 | Week 3 | Week 4 | Total | GeneChip |
| Intervention (hypoxia) | 6 | 6 | 6 | 6 | 24 | 16* |
| Control (normoxia) | 6 | 6 | 6 | 6 | 24 | 12* |
*Three animals from each control and four animals from each hypoxic subgroup were used for GeneChip analysis. Four animals from each group either pulmonary trunk banded (PTB) or sham at week 5 were used for GeneChip analysis.
For the PTB experiment, 46 male Wistar rats were divided into two groups. One group underwent PTB operation, and the other group underwent sham operation. Sham operated animals underwent the same procedure as PTB rats except for banding of the pulmonary trunk. Animals were subdivided into 4 groups and examined 2, 3, 5 and 6 weeks after the operation. 4 Sham and 4 PTB animals were randomly selected for gene chip analysis (Table 1). The animal model for pressure loading of the right ventricle using PTB has been described in detail in a previous publication [17].
In the experiment with chronic hypoxic rats, body weight (BW) and systemic systolic blood pressure (SSBP) of the animals were measured on the day of sacrifice. SSBP was measured using the tail cuff method with a plethysmograph (Digital Pressure Meter LE 5000 with tail cuff). Before measurements, rats were preheated for 20 minutes at 35°C in their cages. Rats were then placed in a heated Plexiglas tube (35°C). In each rat, three subsequent measurements within a difference of 5 mmHg were made, and the mean values were used. For measurement of right ventricular systolic pressure (RVSBP), rats were fully anaesthetized with an intraperitoneal injection of Midazolam 0.825 ml/kg, Fentanyl 0.825 ml/kg and sterilized water 0.825 ml/kg. For maintenance, intraperitoneal injection of 100 µL Fentanyl was given every 30 minutes. The external jugular vein was isolated by blunt dissection and ligated (using Seralon® 3/0 – Serag Wiessner). A small hole was cut in the vein and through this a catheter (30 cm. Tygon micropore, OD: 0.76 mm, ID: 0.25 mm, Norton performance plastics, OH, USA) slightly bended in one end, was inserted and led into the right ventricle through the right atrium (marks on the catheter at four to five cm indicates this location). The pressure profile was simultaneously registered via a pressure transducer (MLT0699 Disposable BP Transducer, ADInstruments, CO, USA), an amplifier (ML118G Quad Bridge Amp, ADInstruments) and through a signal box (PowerLab 4/20, ADInstruments) registered on a computer (software: Chart v5.0, ADInstruments). Once the catheter was in place, the pressure was left to stabilize over a period of approximately 5 to 10 minutes. The rats were sacrificed by decapitation. The hematocrit was measured post mortem by centrifuging the blood (Micro-Hematocrit Centrifuge, model MB, 11,700 RPM, 13,700 × g, International Equipment Company, MA, USA) for 10 minutes.
In the PTB experiment, invasive pressure measurements were performed as previously described [17].
Assessment of right ventricular hypertrophy
Immediately after the rat was decapitated, the heart was removed and placed in diethylpyrocarbonate (DEPC) treated water. For gene expression analysis a piece offour times four mm of the free wall of the right ventricle was cut out, and placed in RNAlater (Ambion Inc., TX, U.S.A.). The atria of the heart were removed and the right ventricle separated from the left ventricle and septum. Right ventricle (including the piece cut out for gene expression analysis) and left ventricle was weighed separately. Right ventricular weight to body weight ratio (RV/BW) and the entire heart weight to body weight (HW/BW) were calculated.
Morphometric measurements
Tissue from the right ventricle was stained with reticulin that is useful to outline the architecture. The myocardial cell was considered to represent a near cylinder with a nucleus placed in the centre of the cell. Measurements were restricted to the nuclear areas. The smallest diameter was chosen as the one representing the actual diameter. The measurements were done on as many cells as possible in a field of vision. Only cells represented by a nucleus were measured. The fields of vision were randomly picked.
Gene chip analysis
The gene expression profiles was obtained by the use of Affymetrix GeneChips (GeneChip® Rat Genome 230 2.0 Array, Affymetrix Inc., CA, U.S.A.). Protocols for the analysis of Affymetrix GeneChips and the evaluation of the sensitivity and quantitative aspects of the method have been previously described [18]. The raw data files are available in European Molecular Biology Laboratory, European Bioinformatic Institute, Microarray Informatics, (http://www.ebi.ac.uk/miamexpress). 293 genes were chosen for analysis in the hypoxic and PTB experiment (see details in the statistical analysis section).
qPCR analysis
In the present project we used an Applied Biosystems 7000 Real-Time PCR System (Applied Biosystems, CA, U.S.A.) and probes composed of LNA™ molecules (Exiqon, Denmark). LNA (Locked Nucleic Acid) is a bicyclic nucleic acid where a ribonucleoside is linked between the 2′-oxygen and the 4′-carbon atoms with a methylene unit (CH2). As with the DNA probes each of the 90 LNA probes in the ProbeLibrary™ kit is labeled with fluorescein (reporter) and a non-fluorescent quencher.
Primers (forward and reverse) and probes used were: adrenergic receptor, alpha 1B (α1B-AR): 5′-cgtatccttgggtgccagt-3′, 5′-cacggccggtaggtgtaa-3′, probe #22; aquaporin 7: 5′-tccccggttcttc-actttc-3′, 5′-acccaccaccagttgttcc-3′, probe #15; triadin 1: 5′-gtggactacaaaaacttttcagca-3′, 5′-cagcatcgttcactagttttagagg-3′, probe #20; CD151 antigen: 5′-acggaacctgttacgcttgt-3′, 5′-cagca-atgatctccagaagga-3′, probe #5; tissue transglutaminase (tTG): 5′-agctggagagcaacaagagc-3′, 5′-gcctggtcatccaggactc-3′, probe #9; transforming growth factor, beta 1 (TGF-β1): 5′-cctgcc-cctacatttgga-3′, 5′-tggttgtagagggcaaggac-3′, probe #73; Ubiquitin C: 5′-caggacaaggagggcatc-3′, 5′-gccatcttccagctgctt-3′, probe #90; myosin regulatory light chain: 5′-cttcgcttgcttcgatgag-3′,5′-gtgagcagctccctcaggt-3′ , probe #31; clathrin, light polypeptide (Lcb): 5′-tggagagaggagc-agaagaaa-3′, 5′-cactcctgttcggtcacctt-3′, probe #89; Similar to C11orf17 protein: 5′-ctcagactc-ggggcacag-3′, 5′-atgcttcctggaccaacaga-3′, probe #40.
Immunoblotting
Frozen samples of the right ventricle from chronic hypoxic and normoxic rats were homogenized, extracted in 300 µl lysis buffer (20 mM Tris-HCl, 5 mM EGTA, 150 mM NaCl, 20 mM glycerolphosphate, 10 mM NaF, 1% Triton X-100, 0.1% tween-20, 0.02 mM ortho-vanadate, 40 nM PMSF, PIM) and centrifuged at 3000 rpm at 4°C for 15 minutes. The supernatant was removed and protein concentration was measured by double determination of the samples against a standard curve with known concentration of albumin using Bio-Rad Protein Assay (Bio-Rad Laboratories, CA, USA). Protein lysate was mixed with sample buffer (350 mM Tris-HCl, 10% dithiothreitolsodium-laurylsulfate, 30% glycerol, 0.123% bromphenol blue). Samples, containing equal amounts of protein, and Protein Stain marker (Bio-Rad Laboratories) were loaded to the gel (Criterion XT Bis-Tris gel 4–12%, Bio-Rad Laboratories) and separation was carried out in the Criterion Electrophoresis System (Bio-Rad Laboratories) using XT-MOPS as a running buffer. The proteins were transferred from the gel to a polyvinylidine difluoride membrane for 1 hour at 100 V. The membrane was blocked in 5% milk for 2 hours at 20°C and afterwards incubated with primary antibody diluted in 5% milk over night at 4°C. The membrane was washed four times in TBS-T (stock: 10 mM tris/base, 2M NaCl, 1 mM EDTA 0.1% tween-20–200 ml stock, 1800 ml MQ-water, pH adjusted to 7.5) and then incubated in secondary antibody for 2 hours at 20°C. Then again washed four times in TBS-T and finally the blots were detected by enhanced chemiluminiscence system (ECL Plus Western Blotting Detection System, GE Healthcare UK Ltd., UK). Differences in protein abundance were determined by densitometry (Image Quant TL; Amersham Biosciences, UK). The known amount of loaded protein was used as loading control.
Antibodies
Primary antibodies used were: anti-acetyl-Coenzyme A acyltransferase 2 (ACAA2) (cat.nr. 11111-1-AP, Ptg.Lab, IL, USA), anti-hydroxyacyl-Coenzyme A dehydrogenase/3-ketoacyl-Coenzyme A thiolase/enoyl-Coenzyme A hydratase (trifunctional protein), alpha subunit (HADHA) (cat.nr. 10758-1-AP, Ptg.Lab, IL, USA), anti-aquaporin 7 (cat.nr. AB3076, Chemicon International, MA, USA), anti-monoamine oxidase A (MAOA) (cat.nr. 10359-1-AP, Ptg.Lab, IL, USA), anti-tissue transglutaminase (tTG) (TGase II Ab-2 (TG-100), Thermo Scientific, CA, USA), anti-endothelin receptor B (ETB) (cat.nr. ab1921, Abcam, UK).
Secondary antibodies used were: horse radish peroxidase (HRP) conjugated goat anti-rabbit IgG (Santa-Cruz biotechnology, CA, USA), HRP conjugated goat anti-mouse IgG (Zymed, CA, USA), HRP conjugated rabbit anti-chicken (ab6753, Abcam).
Immunohistochemistry
Pieces from the right ventricle from normoxic and hypoxic rats were stored in formalin 4% until they were embedded into paraffin. Slices of approximately 3 µm were made from each piece. Removing paraffin from the slices was done by washing in different solutions each for 5 minutes following the schedule: 2 x xylene (Xylene – mixture of isomers (AppliChem, Germany)), 2×99% ethanol, 96% ethanol, 50% ethanol and water. The slices were incubated in 3% H2O2 for 10 minutes and afterwards washed 2×5 minutes in Coon's buffer (Na2H2PO4 (2H2O), NaH2PO4 (H2O), NaCl – ad. 10,000 ml H2O). Slices were then pretreated with either citrat buffer (10 mM (Tri-sodiumcitrate dihydrat 5 mM, dinatriumhydrogencitrat 5 mM, pH adjusted to 6.0)) or TEG buffer (Tris 10 mM, EGTA 0.5 mM, pH adjusted to 9.0) for 2×5 minutes in microwave at 650 W and afterwards washed in Coon's buffer. 10% bovine serum in solution of 1% bovine serum albumin dissolved in Coon's Buffer (BSA1%) was added to avoid unspecific binding of the antibodies. The serum was removed and the primary antibody, the same as used for immunoblotting, diluted in BSA1% was added and incubating over night at 4°C in a moisture chamber.
The slices were washed in Coon's buffer and then incubating with secondary antibody (Bionylated Link - Universal LSAB™2 Kit/HRP, Rabbit/Mouse, Dako, CA, USA) for 20 minutes at 20°C in a moisture chamber. Again washing with Coon's buffer and incubation with streptavidin (Streptavidin, Dako) for 20 minutes at 20°C in a moisture chamber. After washing with Coon's buffer DAB (DAB Chromogen (tablets dissolved in Coon's buffer), Dako) was added and incubating for 5 minutes. Slices were incubated with Mayer's hematoxylin for 1 minute, washed in H2O and incubating for 5 minutes in each solution: 50% ethanol, 96% ethanol and 99% ethanol. Negative controls were made exactly indentical but without incubation with primary antibody.
Statistical analysis
The data obtained in the hypoxic experiment was firstly filtered to include probe sets with at least one present call in all 28 chips and secondly logarithmic transformed. A t-test for difference between the hypoxic and the normoxic groups, that adds the effects from the four time points (allowing for different general levels at the four time points) was calculated. The corresponding P-value from the appropiate t-distribution was calculated for each gene.
The calculated P-values were used to rank the genes within each test. To estimate how many of the called genes that were falsely positively called, we estimated a false discovery rate (FDR), avoiding the assumptions of the data being independent and normally distributed. The FDR was calculated by comparing the original data to a reference distribution based on permutated data. Permutation consists in permutating group labels while keeping the size of the two groups. In this experiment we generated alternative arrangements by exchanging two individuals between the control and the intervention group for each of the four time points. For the whole experiment, there were a total of 104.976 different permutations. 500 randomly picked permutations were chosen, and for each of the 500 permutated experiments a tsum perm. test was calculated, and the corresponding P-values were found. FDR was found by calculating the ratio between the median number of genes based on the permutated datasets with P<0.0001 and the number of genes based on the original dataset with P<0.0001.
In the PTB experiment, the genes that were found to be significantly differentially expressed in the hypoxic experiment, were selected in the gene expression dataset belonging to the PTB experiment, and differences between the two groups were analysed using Student's t test.
Results from immunoblotting, qPCR, morphometric and hemodynamic measurements from both the PTB and hypoxic experiment were analyzed separately by using two-way analysis of variance (ANOVA) comparing hypoxia or PTB to time. In case of significance a Bonferroni post hoc test was made. Statistical calculations were made by using GraphPad Prism version 4.03 (GraphPad Software Inc, San Diego, CA, USA).
All over, P-values of less than 0.05 were considered significant.
Results
Functional Data
Hematocrit, SSBP, BW and HW/BW are listed in Table 2. The hematocrit was 39% in the normoxic group. Hypoxia increased the hematocrit to 50–54%. SSBP was unaltered by hypoxia. The normoxic animals gained weight during the four weeks, while the hypoxic rats had a significant lower body weight after four weeks of experiment. HW/BW in the hypoxic group showed a significant increase at week two, three and four.
Table 2. Parameters describing the pulmonary and systemic impact of hypoxia.
| Week 1 | Week 2 | Week 3 | Week 4 | |
| Hematocrit (%) | ||||
| Normoxia | 38.7±0.9 | 39.0±2.6 | 39.0±1.5 | 39.0±1.4 |
| Hypoxia | 50.2±1.3* | 54.3±1.7* | 51.5±1.9* | 51.8±1.5* |
| SSBP (mmHg) | ||||
| Normoxia | 131.3±2.2 | 127.8±2.4 | 124.7±4.9 | 124.7±2.3 |
| Hypoxia | 128.7±2.8 | 124.3±2.8 | 129.5±2.5 | 122.2±3.6 |
| Body weight (gram) | ||||
| Normoxia | 331±12 | 342±11 | 334±12 | 364±10 |
| Hypoxia | 298±11 | 300±11 | 342±10 | 310±19* |
| HW/BW (%) | ||||
| Normoxia | 0.27±0.005 | 0.26±0.009 | 0.25±0.009 | 0.24±0.007 |
| Hypoxia | 0.29±0.004 | 0.31±0.008* | 0.33±0.014* | 0.32±0.010* |
SSBP: Systemic systolic blood pressure; HW/BW: Heart weight to body weight ratio.
n = 6 in both groups at all time points. Values are means ± SE. *P<0.05 vs. normoxia at same time point.
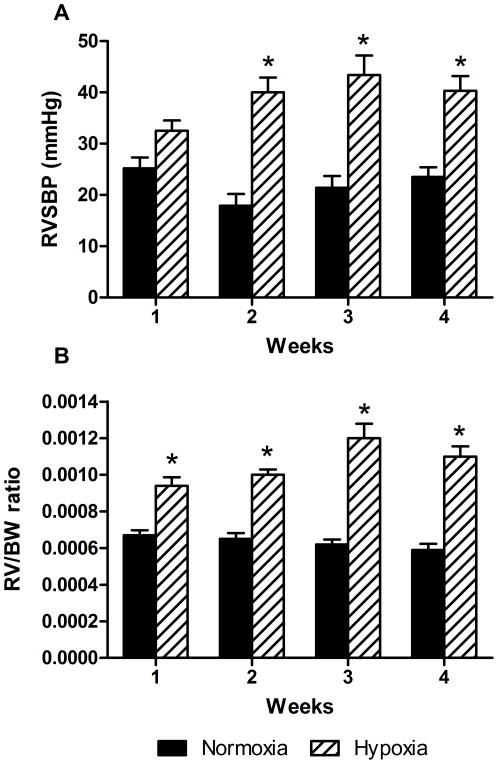
RVSBP was constant in the normoxic group (18–25 mmHg) but raised by hypoxia from 32 mmHg at week one to 40–43 mmHg at week two, three and four (Figure 1A). RV/BW was almost unaltered in the normoxic group, while in the hypoxic group RV/BW was increasing during the four weeks (Figure 1B). There was a strong positive correlation between RVSBP and RV/BW in the hypoxic experiment (n = 48, R2 = 0.66, P<0.0001).
Figure 1. Right ventricular systolic blood pressure (RVSBP) and right ventricular hypertrophy in hypoxic experiment.
A: changes in RVSBP in the normoxic and hypoxic groups at the four time points. RVSBP was constant in the normoxic group and significantly increased in the hypoxic groups after 2 weeks. B: temporal change in right ventricular hypertrophy in the hypoxic experiment assessed by right ventricular weight relative to body weight ratio (RV/BW) shows significant increase due to hypoxia. n = 6 in both groups at all time points. Values are means ± SE. *P<0.05 vs. normoxia at same time point.
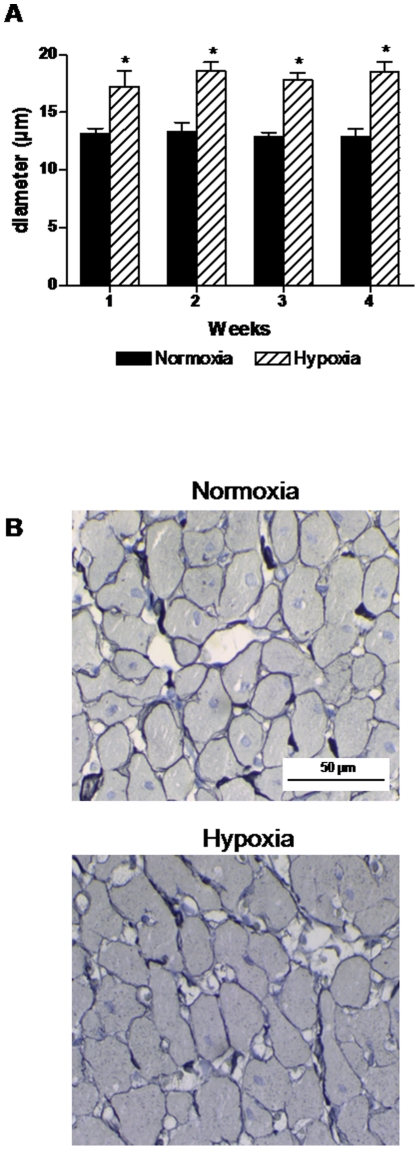
The diameter of the cardiomyocytes increased significantly (31 to 64%) in the hypoxic group but within each group there was no significant difference between the four different time points (Figure 2A). Staining with reticulin did not reveal any other differences between hypoxic and normoxic rats (Figure 2B).
Figure 2. Morphometric measurements of the right ventricle.
A: cardiomyocyte diameter was significantly increased by hypoxia compared to normoxic controls. B: examples of staining with reticulin in right ventricle samples from normoxic and hypoxic rats. n = 5–6 in both groups at all time points. Values are means ± SE. *P<0.05 vs. normoxia at same time point.
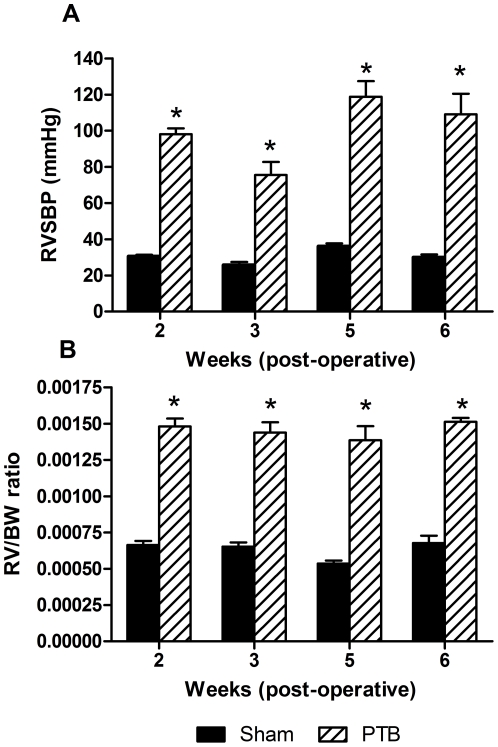
In the PTB experiment, RVSBP was approximately constant in the sham group (26 to 38 mmHg). RVSBP was significantly raised in the PTB group at all time points (76 to 118 mmHg) (Figure 3A). Temporal change in right ventricular hypertrophy was assessed by RV/BW ratio. The degree of right ventricular hypertrophy in the PTB group was increased significantly at all time points compared to the sham group (Figure 3B). There was a strong correlation between RVSBP and RV/BW (n = 46, R2 = 0.76, P<0.0001).
Figure 3. RVSBP and RV/BW in the pulmonary trunk banding (PTB) experiment.
A: RVSBP was significantly increased due to PTB compared to sham operated animals. B: temporal change in right ventricular hypertrophy in the PTB experiment assessed by RV/BW and compared to the sham group shows a significant increasing effect of PTB. n = 4–7 in both groups at all time points. Values are means ± SE. *P<0.05 vs. sham at same time point.
Gene expression data
Table 3 contains results for 49 genes from gene chip analysis for genes up- or down-regulated with a fold change greater than two.
Table 3. Changes in gene expression by gene chip analysis – hypoxia compared to normoxia.
| Public ID | Encoded protein | Fold changesa |
| NM_012612 | natriuretic peptide precursor type A | +50.13 |
| NM_019296 | cell division cycle 2 homolog A (S. pombe) | +6.21 |
| NM_031131 | transforming growth factor, beta 2 | +5.60 |
| NM_012843 | Epithelial membrane protein 1 | +5.25 |
| AI145313 | thymus cell antigen 1, theta | +4.64 |
| AB026903 | decay-accelerating factor | +2.31 |
| D00688 | monoamine oxidase A | +3.44 |
| BI298356 | four and a half LIM domains 1 | +3.07 |
| M14400 | creatine kinase, brain | +2.95 |
| AF413212 | guanine nucleotide binding protein, alpha o | +2.91 |
| NM_019212 | actin alpha 1 | +2.85 |
| NM_012886 | tissue inhibitor of metalloproteinase 3 | +2.72 |
| NM_031545 | natriuretic peptide precursor type B | +2.68 |
| L09752 | cyclin D2 | +2.52 |
| AA851939 | FXYD domain-containing ion transport regulator 6 | +2.50 |
| U54791 | Chemokine receptor (LCR1) | +2.47 |
| AA945643 | Chitinase 3-like 1 (cartilage glycoprotein-39) | +2.38 |
| AF095585 | enigma (LIM domain protein) | +2.38 |
| Z78279 | collagen, type 1, alpha 1 | +2.37 |
| AI227742 | Bcl-2-related ovarian killer protein | +2.29 |
| NM_019237 | procollagen C-proteinase enhancer protein | +2.25 |
| BM389019 | fibrillin-1 | +2.23 |
| X57764 | endothelin receptor B | +2.23 |
| AW143798 | cyclin D1 | +2.21 |
| AF072892 | chondroitin sulphate proteoglycan 2 (versican) | +2.16 |
| NM_019341 | Regulator of G-protein signaling 5 | +2.16 |
| NM_134452 | collagen, type V, alpha 1 | +2.11 |
| AB026665 | peptide/histidine transporter PHT2 | +2.11 |
| NM_019386 | tissue transglutaminase | +2.08 |
| AW253722 | RAB13 | +2.01 |
| AI009597 | FXYD domain-containing ion transport regulator 3 | −8.67 |
| NM_031543 | cytochrome P450, subfamily 2E, polypeptide 1 | −5.60 |
| AF385402 | Potassium channel, subfamily K, member 2 | −4.15 |
| AI535411 | myosin heavy chain, polypeptide 7 | −3.63 |
| AJ243304 | triadin 1 | −3.04 |
| NM_019157 | Aquaporin 7 | −2.82 |
| BE103537 | tropomyosin 1, alpha | −2.81 |
| U31554 | limbic system-associated membrane protein | −2.76 |
| AI137995 | sodium channel, voltage-gated, type IV, beta | −2.50 |
| NM_012505 | ATPase, Na+K+ transporting, alpha 2 | −2.37 |
| NM_080399 | Smhs1 protein | −2.18 |
| NM_057197 | 2,4-dienoyl CoA reductase 1, mitochondrial | −2.14 |
| NM_030865 | Myocilin | −2.14 |
| AF322216 | immunoglobulin superfamily, member 1 | −2.14 |
| NM_017079 | CD1d1 antigen | −2.13 |
| NM_012793 | guanidinoacetate methyltransferase | −2.08 |
| AA899304 | acetyl-coenzyme A acetyltransferase 1 | −2.05 |
| AW528891 | potassium voltage gated channel, Shal-related family, m… | −2.03 |
| NM_016991 | adrenergic receptor, alpha 1B | −2.03 |
Values are the average of a four-way analysis as described in Methods. Only genes with fold changes larger than 2 are included in this table.
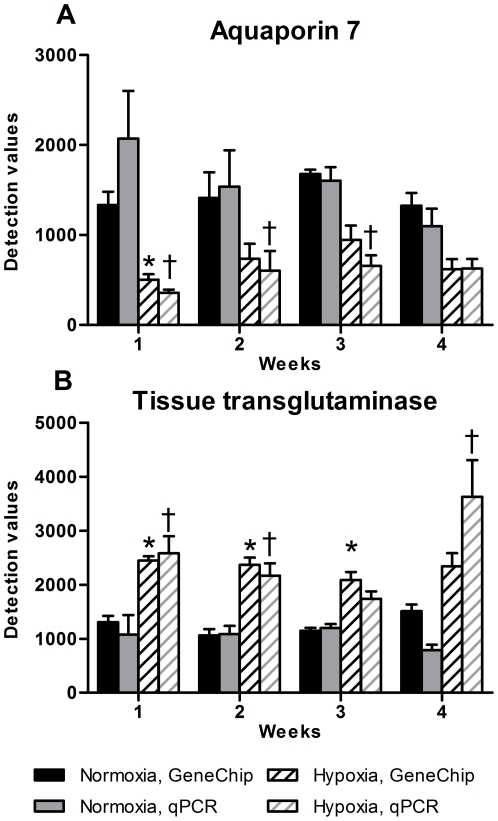
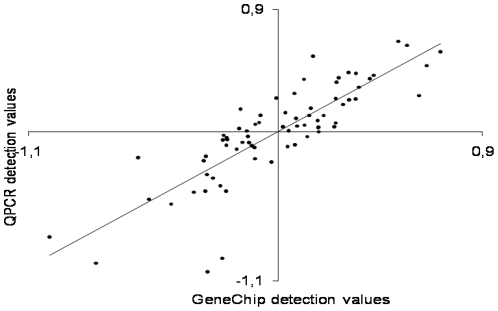
The validation of the gene expression profiles was done by qPCR. We chose four upregulated (CD 151 antigen, tTG, TGF-β1 and Similar to C11orf17 protein), three downregulated (α1B-AR, aquaporin 7, and triadin 1) and two genes without change (myosin regulatory light chain and clathrin – light polypeptide). Ubiquitin C was used for normalization. The qPCR results were in accordance with the gene chip data (Figure 4A,B), exemplified by aquaporin 7 and tTG. The correlation between the gene chip and qPCR results was tested by comparing 3 up-regulated, 4 down-regulated and 2 genes with no change in expression according to the gene chip tsum analysis. There is a strong positive correlation between gene chip detection (normalized to 0) values and the qPCR detection values (normalized to 0) and in the hypoxic experiment (n = 72, R2 = 0.70) (Figure 5).
Figure 4. qPCR analysis of aquaporin7 and tissue transglutaminase.
A: gene expression of the aquaporin 7 mRNA by use of gene chip and qPCR shows a decrease in gene expression according to hypoxia. B: gene expression of tissue transglutaminase mRNA by use of gene chip and qPCR shows the opposite impact of hypoxia by increasing gene expression. n = 6 in both groups at all time points.
Figure 5. Correlation of the gene chip and qPCR gene expression results.
The correlation is tested by comparing three upregulated, four downregulated and two not regulated genes (according to the gene chip, tsum analysis). There was found significant correlation between qPCR and gene chip analysis. Values are means ± SE. *P<0.05 vs. normoxia, gene chip at same time point, †P<0.05 vs. normoxia, qPCR at same time point.
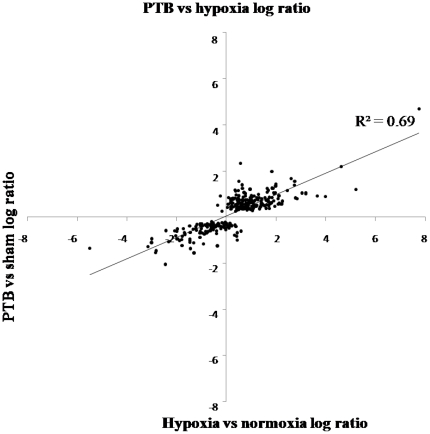
The signal log ratio estimates the magnitude and direction of change of a transcript when two arrays are compared (experiment versus control). Signal log ratios from the hypoxic and the PTB experiments were plotted for 288 genes (5 genes were excluded of the original 293 genes tested because they showed absent calls in the PTB experiment). 266 were regulated in the same direction or were unchanged in the two experiments (Wilcoxon signed rank test: P<2.2×10⁻¹⁶). Of these genes, 172 were non-expressed sequence tags (non-EST) involved in apoptosis, inflammation, heart function, and growth and the remaining 94 were EST. Of the 22 genes regulated differently, 11 were up-regulated and 5 unaltered in the PTB experiment but down-regulated in the hypoxic experiment, 3 were down-regulated in PTB and up-regulated in hypoxia and 3 were EST (Table 4). There is a strong positive correlation between the log ratios of gene expression in the hypoxic and the PTB experiment (R2 = 0.69, P<0.05, n = 288) (Figure 6). Limiting the analysis to genes where the fold change is larger than 2 yielded an even stronger correlation (R2 = 0.84, P<0.05, n = 125) of gene expression in the hypoxic and PTB experiment.
Table 4. Differentially regulated genes in the right ventricle of pulmonary trunk banded (PTB) rats versus chronic hypoxic rats.
| Public ID | Encoded protein | Fold change | |
| PTB | Hypoxia | ||
| NM_024400 | A disintegrin and metalloproteinase with thrombospondin motifs 1 (ADAMTS-1) | 0.60 | −0.61 |
| BG671506 | avian sarcoma virus CT10 (v-crk) oncogene homolog | 0.38 | −0.41 |
| AI454911 | endothelial monocyte activating polypeptide 2 | 0.15 | −0.28 |
| BF282186 | eukaryotic initiation factor 5 (eIF-5) | 0.35 | −0.35 |
| AI713966 | insulin-like growth factor binding protein 3 | 0.41 | −0.84 |
| NM_012588 | insulin-like growth factor binding protein 3 | 0.33 | −0.78 |
| NM_053713 | Kruppel-like factor 4 (gut) | 0.48 | −0.68 |
| AA818911 | mob protein | 0.21 | −0.39 |
| AI409862 | protein phosphatase 1, catalytic subunit, beta isoform | 0.22 | −0.37 |
| NM_033096 | protein phosphatase 1B, magnesium dependent, beta isoform | 0.12 | −0.36 |
| AY043246 | regulator of G-protein signaling protein 2 | 0.44 | −0.99 |
| AI454052 | c-kit receptor tyrosine kinase | −0.24 | 0.91 |
| AW914928 | DEAD (aspartate-glutamate-alanine-aspartate) box polypeptide 25 | −0.36 | 0.51 |
| BI275583 | lectin, galactoside-binding, soluble, 2 (galectin 2) | −0.17 | 0.15 |
In addition 4 genes (LYRIC, glioma tumor suppressor candidate region gene 2, splicing factor (arginine/serine-rich 5), transducer of ERBB2 1, and TRAP-complex gamma subunit) were unaltered in PTB, but down-regulated in hypoxia, but with fold changes less than 0.5.
Figure 6. Log ratio of gene chip data obtained in the right ventricle of chronic hypoxic compared to normoxic rats versus pulmonary trunk banded (PTB) compared to sham-operated rats.
There was found a positive correlation between regulation of the genes in the two experiments with a significant correlation coefficient R2 = 0.69 (P<0.05, n = 288).
Immunoblotting
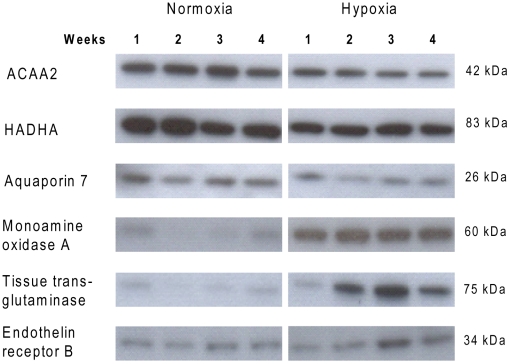
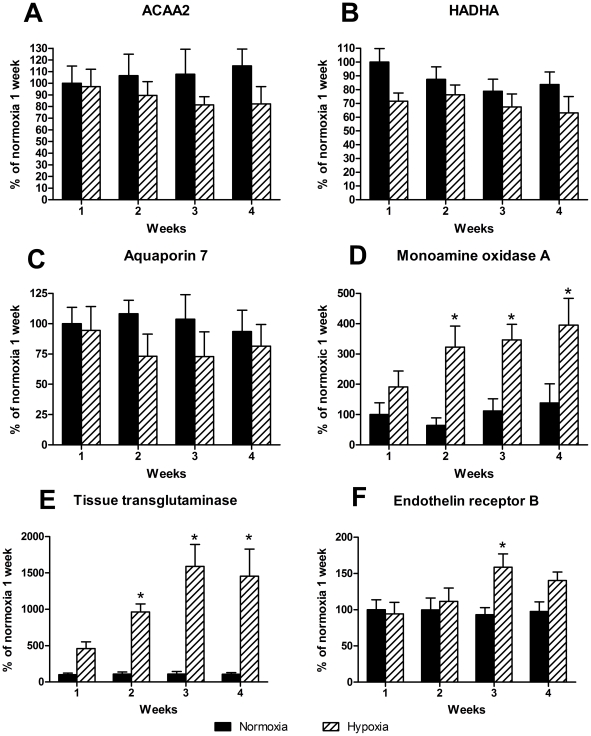
Figure 7 shows the representative immunoblots. Six proteins were chosen for immunoblotting based on the gene chip that showed three genes were downregulated (ACAA2, HADHA and aquaporin 7) and three were upregulated (tTG, MAOA and ETB). By use of antibodies against these proteins we showed that some of the changes found on gene levels are also reflected at protein level. ACAA2, HADHA and aquaporin 7 were not significantly downregulated, but the tendency is clear (Figure 8A–C). MAOA and tTG were significantly upregulated in hypoxic rats after 2, 3 or 4 weeks when compared to normoxic controls (Figure 8D–E). Finally, ETB was only significantly upregulated after 3 weeks of hypoxia (Figure 8F).
Figure 7. Representative immunoblots for proteins measured in the right ventricle from normoxic and hypoxic rats.
ACAA2: acetyl-Coenzyme A acyltransferase 2, HADHA: hydroxyacyl-Coenzyme A dehydrogenase/3-ketoacyl-Coenzyme A thiolase/enoyl-Coenzyme A hydratase (trifunctional protein), alpha subunit.
Figure 8. Immunoblottings of right ventricle samples from normoxic and hypoxic rats.
Proteins participating in metabolism A: ACAA2, B: HADHA and C: aquaporin 7 show tendency to downregulation by hypoxia. D: monoamine oxidase A, E: tissue transglutaminase and F: endothelin receptor B were all upregulated by hypoxia. ACAA2: acetyl-Coenzyme A acyltransferase 2, HADHA: hydroxyacyl-Coenzyme A dehydrogenase/3-ketoacyl-Coenzyme A thiolase/enoyl-Coenzyme A hydratase (trifunctional protein), alpha subunit. Values are means ± SE and are calculated as percent of normoxia 1 week. n = 6 in both groups at all time points. *P<0.05 vs. normoxia at same time point.
Immunohistochemistry
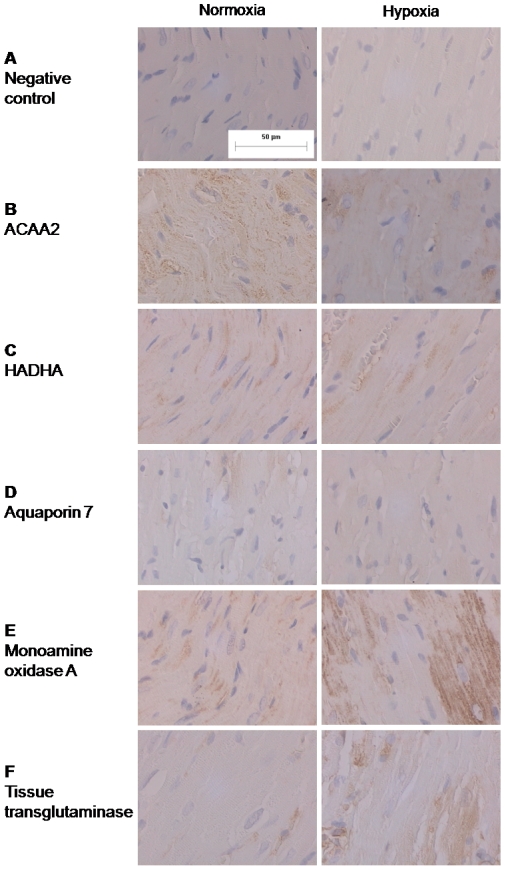
By incubating slides from the right ventricle from hypoxic and normoxic rats with antibodies used for immunoblotting we were able to evaluate the localization of the proteins. Controls were made without primary antibody incubation (Figure 9A). For the proteins participating in beta-oxidation, ACAA2 and HADHA, the localization is intracellular in the cardiomyocyte (Figure 9B–C). Aquaporin 7 was also located in the cardiomyocyte at the cellular membrane (Figure 9D). MAOA was also upregulated on the immunostainings when compared to normoxic controls and the location is intracellular (Figure 9E). Finally, tTG was also located to the cardiomyocyte mainly in the cytosol (Figure 9F).
Figure 9. Immunostainings of slides from the right ventricle from rats exposed to normoxia or hypoxia for 2 weeks.
A: Negative controls without incubation with the primary antibody. The bar on control picture shows the size reference (50 µm) for all pictures. B: ACAA2 C: HADHA, D: aquaporin 7, E: monoamine oxidase A, F: tissue transglutaminase. All proteins were found to be located to the cardiomyocyte and only aquaporin 7 was thought to be located to the cellular membrane whereas the other proteins is located to the cytosol.
Discussion
The main findings of the present study are addressing gene expression common for the pressure loading of the right ventricle in both chronic hypoxic rats and rats with banding of the pulmonary trunk. The present study revealed alterations in expression of 172 genes involved in apoptosis, inflammation, heart function, and growth. A small subset of differentiated genes in the hypoxia and PTB groups suggests pressure load as the main contributer to development of right ventricular hypertrophy. GeneChip analysis of the right ventricle was confirmed by qPCR for a subgroup of genes and was further substantiated by measuring protein expression showing a marked upregulation of tTG due to right ventricular hypertrophy.
Role of hypoxia versus pressure load in right ventricular hypertrophy in pulmonary hypertension
The hypobaric hypoxia model has been used in several studies for induction of pulmonary hypertension in rats and has shown increase of RVSBP and right ventricular weight [19]. Another approach to induce high RVSBP and to increase right ventricular weight is by PTB [17], [20]. By comparing these two animal models, it is possible to distinguish the isolated effect of respectively pressure load and hypoxia. There was a significant correlation of genes changed in the right ventricle of chronic hypoxic rats with the changes observed in the PTB experiment and this correlation was even stronger when only genes regulated more than two-fold were considered. These findings suggest that pressure load is the main factor altering gene expression in the right ventricle in rats with pulmonary hypertension induced by hypoxia.
Comparing chronic hypoxia and PTB identified a small subgroup of genes changing in opposite directions suggesting that hypoxia alone has an impact on the gene expression in the right ventricle. Thus, c-kit receptor tyrosine kinase and DEAD (asparatate-glutamate-alanine-asparatate) box polypeptide 25 were upregulated in hypoxia and downregulated in the PTB experiments, while insulin-like growth factor binding protein 3 and regulator of G-protein signaling protein 2 were upregulated. Both c-kit receptor tyrosine kinase and insulin-like growth factor binding protein 3 have previously been described to be involved in hypoxia-induced angiogenesis [21], [22], and insulin growth factor 1 stimulation in mouse fibroblasts resulted in upregulation of DEAD [23]. Therefore, hypoxia seems to directly affect gene expression in the right ventricle. However, in all cases the fold changes in gene expression comparing the PTB and hypoxic experiments with regard to differentially expressed genes are small (Table 4), and it cannot be excluded that differences in pressure load comparing chronic hypoxic rats and PTB rats may also contribute to the differential gene regulation.
Previous studies have also provided evidence suggesting that mechanical load of the right ventricle from rats with pulmonary hypertension influences gene expression [11]. Thus, atrial natriuretic peptide expression, probably induced by stretch of the myocardium, was upregulated in the right ventricle from rats with pulmonary hypertension induced by either moncrotaline or hypoxia [8], [9], and in agreement with these findings, both natriuretic peptide precursor type A and B were markedly increased in the present study. Genes involved in cell proliferation, the cyclin family of genes and BCl2, were upregulated in the right ventricle of rats with pulmonary hypertension induced by monocrotaline [9], [10], and the same was the case for cyclin D1 and D2 as well as BCl2 in the present study. In addition, several signaling processes involving fetal gene re-expression, activation of protein translocation, increase in mass, and enlargement of cell size/volume have been identified as markers of hypertrophy as a response to hemodynamic overload [24]. In the present study the diameter of the cardiomyocytes was increased, and alpha-actin expression was upregulated together with four and a half LIM domains 1 (FHL), and enigma (LIM domain protein). FHL is contained in a complex within the cardiomyocyte sacromere and mice lacking FHL displayed a blunted hypertrophic response suggesting FHL1 to mediates hypertrophic biomechanical stress responses in the myocardium [25], while the Enigma protein family are Z-line proteins at the border between two sarcomers [26]. Thus, upregulation of a series of genes in the present study also suggest that mechanical load regulate gene expression and results in right ventricular hypertrophy.
Role of specific signal pathways changed in right ventricular hypertrophy
During development of right ventricular hypertrophy the myocardium changes metabolism to avoid ischemia [27]. Normally the major substrate for heart metabolism is free fatty acids that account for 60–80%. The remaining part comes from metabolism of carbohydrates, but during development of left ventricular hypertrophy and heart failure the ratio alters towards increased carbohydrates as cardiac fuel substrate and augmented mitochondrial respiratory capacity which is considered to play a central role in hypoxia-mediated cardioprotection [27]. A study of gene expression from chronic hypoxic rats showed increased expression of genes associated to glucose metabolism and they also found changes in the left ventricle, which indicates that not only myocardial hypertrophy causes changes, but also chronic hypoxia contributes to altered gene expression [8]. Indeed, in the present study genes encoding for enzymes participating in beta-oxidation of fatty acids (ACAA2 and HADHA) were downregulated in right ventricles from hypoxic rats. The tendency was reflected at protein level, although not significantly and supports that pressure load by itself is able to cause a shift in genes related to myocardial metabolism from free fatty acids to carbohydrates.
Aquaporin 7 is a water and glycerol channel that has been found especially in adipocytes and skeletal muscle cells in the human body. The overall function of aquaporins is to maintain cellular water homeostasis [28], [29]. Studies of aquaporin 7 showed that it is expressed in cardiac tissue from mice, rats and humans [30]. Our results confirmed these findings both by gene chip, qPCR and immunoblotting. Moreover, we found that hypoxia decreases gene expression for aquaporin 7, although this was not confirmed at protein level. Skowronski et al. found that aquaporin 7 is only localized in small vessels in cardiac tissue, and these observations agree with our findings [31]. A downregulation of aquaporin 7 in hypoxic rats may reflect reduced glycerol transport as a consequence of a shift of the metabolism from fatty acids to carbohydrates.
Hypertrophy of the ventricle also leads to remodeling of the ventricular wall and altered expression of structural proteins in the myocardium and in the surrounding tissue. Studies of tTG in left the ventricle show association between the expression of tTG and development of ventricular hypertrophy [32], [33]. The mechanism is primarily through its action as TGase leading to structural changes of actin and myosin, but also more or less through the GTPase activity. tTG is coupled to the α1B-AR as Gα-protein [34]. Overexpression of α1B-AR is known to induce cardiac hypertrophy [35] and studies of the expression of the α1B-AR have shown that it is downregulated on mRNA level in vascular smooth muscle cells from chronic hypoxic animals [36], and that knock-out of the receptor did not alter development of right ventricular hypertrophy and the increase in RVSBP [37]. The conclusion of these studies is that α1B-AR is associated to vascular smooth muscle cell proliferation. Our findings show that the α1B-AR is downregulated in the right ventricle at mRNA level, while the potential coupling protein tTG is markedly upregulated and associated to right ventricular hypertrophy in rats with pulmonary hypertension. The exact role of α1B-AR is still unknown but it seems to play an adaptional role to avoid development of cardiac hypertrophy according to pulmonary hypertension.
Transforming growth factor beta 1 (TGF-β1) is thought to be associated with proliferation of cells during development of hypertrophy and cell division. Studies of rats with pulmonary hypertension and right ventricular hypertrophy induced by monocrotaline showed by qPCR analysis increased levels of TGF-β1 in the right ventricle but not in the left ventricle indicating association to right ventricular hypertrophy [38]. Also immunoblottings of pulmonary arteries from chronic hypoxic rats showed association between TGF-β1 and increased proliferation of vascular smooth muscle cells [39]. These findings indicate that TGF-β1 is associated both to right ventricular hypertrophy and vascular smooth muscle cell proliferation. Our studies support that TGF-β1 appears to play a role in development of right ventricular hypertrophy.
MAOA is an enzyme located to the mitochondria of the cardiomyocytes and metabolizes epinephrine, norepinephrine, and serotonin (5-HT). Studies have shown that 5-HT is associated to ventricular hypertrophy by binding to its receptor 5-HT2B, and that it induces oxidative stress and apoptosis [40]. It has been found that blocking of the 5-HT2B receptor only partly inhibited the effect of 5-HT, and that inhibition of MAOA prevented the hypertrophic effect of 5-HT [41]. Overexpression of the 5-HT2B receptor leads to left ventricular hypertrophy. The localization of MAOA has been found to be intracellular [42], [43]. Our findings indicate an association between right ventricular hypertrophy and the expression of MAOA. Moreover, we evaluated the localization of MAOA and found that it is located to the cardiomyocytes and probably to the mitochondria, which are highly expressed in cardiomyocytes and is the place where catecholamines and 5-HT are metabolized. Reactive oxygen species (ROS), a product from oxidation of 5-HT catalyzed by MAOA, is related to right ventricular hypertrophy and ROS has been found to be located to the mitochondria [44]. This indicates that metabolization of 5-HT and thereby MAOA is located here.
The effects of endothelin are mediated by two distinct receptors termed ETA and ETB, where 90% of endothelin receptors belong to the ETA subtype in cardiomyocytes, and their stimulation has a positive inotropic effect [45]. Cardiac ETB receptors may contribute to clearance of circulating endothelin and together with the ETA to cardiac fibrosis and cardiomyocyte hypertrophy [45], [46]. In the present study only the ETB receptor expression was elevated in the right ventricle as well as expression of several collagens e.g. collagen type 1 alpha 1 and collagen type V alpha 1 (Table 3). The dual ETA/ETB receptor antagonist, bosentan reduces right ventricular hypertrophy in pulmonary hypertension in chronic hypoxic rats [47], but at present it is unclear whether the block of endothelin clearance and pulmonary vascular dilation by ETB receptors outweigh the beneficial effects of blocking both the ETA and ETB receptors in pulmonary hypertension due to hypoxia.
In conclusion, we have found that several genes are altered during development of right ventricular hypertrophy induced by pulmonary hypertension in chronic hypoxic rats. In case of the metabolic genes the effect of high pressure on the right ventricle appears compensated at the protein level, while both expression of genes and proteins of importance for myocardial function and remodelling are altered by the increased pressure load of the right ventricle. These findings imply that treatment of pulmonary hypertension, in addition to reduction of pulmonary vascular resistance, should also aim at reducing right ventricular pressure or by direct effects on the heart limit the organ damaging effects of high pulmonary pressure.
Footnotes
Competing Interests: The authors have declared that no competing interests exist.
Funding: Jonas Baandrup was supported by the Danish Heart Foundation, and Ulf Simonsen was supported by the Danish Lung Foundation and the Danish Research Council. The funders had no role in study design, data collection and analysis, decision to publish, or preparation of the manuscript.
References
- 1.Chin KM, Kim NH, Rubin LJ. The right ventricle in pulmonary hypertension. Coron Artery Dis. 2005;16:13–18. doi: 10.1097/00019501-200502000-00003. [DOI] [PubMed] [Google Scholar]
- 2.Humbert M, Sitbon O, Simonneau G. Treatment of pulmonary arterial hypertension. N Engl J Med. 2004;351:1425–1436. doi: 10.1056/NEJMra040291. [DOI] [PubMed] [Google Scholar]
- 3.Montalescot G, Drobinski G, Meurin P, Maclouf J, Sotirov I, et al. Effects of prostacyclin on the pulmonary vascular tone and cardiac contractility of patients with pulmonary hypertension secondary to end-stage heart failure. Am J Cardiol. 1998;82:749–755. doi: 10.1016/s0002-9149(98)00439-1. [DOI] [PubMed] [Google Scholar]
- 4.Kisch-Wedel H, Kemming G, Meisner F, Flondor M, Kuebler WM, et al. The prostaglandins epoprostenol and iloprost increase left ventricular contractility in vivo. Intensive Care Med. 2003;29:1574–1583. doi: 10.1007/s00134-003-1891-z. [DOI] [PubMed] [Google Scholar]
- 5.Mulder P, Richard V, Derumeaux G, Hogie M, Henry JP, et al. Role of endogenous endothelin in chronic heart failure: effect of long-term treatment with an endothelin antagonist on survival, hemodynamics, and cardiac remodeling. Circulation. 1997;96:1976–1982. doi: 10.1161/01.cir.96.6.1976. [DOI] [PubMed] [Google Scholar]
- 6.Frey N, Olson EN. Cardiac hypertrophy: the good, the bad, and the ugly. Annu Rev Physiol. 2003;65:45–79. doi: 10.1146/annurev.physiol.65.092101.142243. [DOI] [PubMed] [Google Scholar]
- 7.Opie LH, Commerford PJ, Gersh BJ, Pfeffer MA. Controversies in ventricular remodelling. Lancet. 2006;367:356–367. doi: 10.1016/S0140-6736(06)68074-4. [DOI] [PubMed] [Google Scholar]
- 8.Sharma S, Taegtmeyer H, Adrogue J, Razeghi P, Sen S, et al. Dynamic changes of gene expression in hypoxia-induced right ventricular hypertrophy. Am J Physiol Heart Circ Physiol. 2004;286:H1185–H1192. doi: 10.1152/ajpheart.00916.2003. [DOI] [PubMed] [Google Scholar]
- 9.Buermans HP, Redout EM, Schiel AE, Musters RJ, Zuidwijk M, et al. Microarray analysis reveals pivotal divergent mRNA expression profiles early in the development of either compensated ventricular hypertrophy or heart failure. Physiol Genomics. 2005;21:314–323. doi: 10.1152/physiolgenomics.00185.2004. [DOI] [PubMed] [Google Scholar]
- 10.Ecarnot-Laubriet A, Assem M, Poirson-Bichat F, Moisant M, Bernard C, et al. Stage-dependent activation of cell cycle and apoptosis mechanisms in the right ventricle by pressure overload. Biochim Biophys Acta. 2002;1586:233–242. doi: 10.1016/s0925-4439(01)00101-6. [DOI] [PubMed] [Google Scholar]
- 11.Kogler H, Hartmann O, Leineweber K, Nguyen vP, Schott P, et al. Mechanical load-dependent regulation of gene expression in monocrotaline-induced right ventricular hypertrophy in the rat. Circ Res. 2003;93:230–237. doi: 10.1161/01.RES.0000085042.89656.C7. [DOI] [PubMed] [Google Scholar]
- 12.Hwang DM, Dempsey AA, Lee CY, Liew CC. Identification of differentially expressed genes in cardiac hypertrophy by analysis of expressed sequence tags. Genomics. 2000;66:1–14. doi: 10.1006/geno.2000.6171. [DOI] [PubMed] [Google Scholar]
- 13.Geraci MW, Moore M, Gesell T, Yeager ME, Alger L, et al. Gene expression patterns in the lungs of patients with primary pulmonary hypertension: a gene microarray analysis. Circ Res. 2001;88:555–562. doi: 10.1161/01.res.88.6.555. [DOI] [PubMed] [Google Scholar]
- 14.Bull TM, Coldren CD, Moore M, Sotto-Santiago SM, Pham DV, et al. Gene microarray analysis of peripheral blood cells in pulmonary arterial hypertension. Am J Respir Crit Care Med. 2004;170:911–919. doi: 10.1164/rccm.200312-1686OC. [DOI] [PubMed] [Google Scholar]
- 15.Gharib SA, Luchtel DL, Madtes DK, Glenny RW. Global gene annotation analysis and transcriptional profiling identify key biological modules in hypoxic pulmonary hypertension. Physiol Genomics. 2005;22:14–23. doi: 10.1152/physiolgenomics.00265.2004. [DOI] [PubMed] [Google Scholar]
- 16.Bull TM, Coldren CD, Geraci MW, Voelkel NF. Gene expression profiling in pulmonary hypertension. Proc Am Thorac Soc. 2007;4:117–120. doi: 10.1513/pats.200605-128JG. [DOI] [PubMed] [Google Scholar]
- 17.Schou UK, Peters CD, Kim SW, Frøkiær J, Nielsen S. Characterization of a rat model of right-sided heart failure induced by pulmonary trunk banding. J Exp Anim Sci. 2007;43:237–254. [Google Scholar]
- 18.Lipshutz RJ, Fodor SP, Gingeras TR, Lockhart DJ. High density synthetic oligonucleotide arrays. Nat Genet. 1999;21:20–24. doi: 10.1038/4447. [DOI] [PubMed] [Google Scholar]
- 19.Elmedal B, de Dam MY, Mulvany MJ, Simonsen U. The superoxide dismutase mimetic, tempol, blunts right ventricular hypertrophy in chronic hypoxic rats. Br J Pharmacol. 2004;141:105–113. doi: 10.1038/sj.bjp.0705580. [DOI] [PMC free article] [PubMed] [Google Scholar]
- 20.Gaynor SL, Maniar HS, Bloch JB, Steendijk P, Moon MR. Right atrial and ventricular adaptation to chronic right ventricular pressure overload. Circulation. 2005;112:I212–I218. doi: 10.1161/CIRCULATIONAHA.104.517789. [DOI] [PubMed] [Google Scholar]
- 21.Litz J, Krystal GW. Imatinib inhibits c-Kit-induced hypoxia-inducible factor-1alpha activity and vascular endothelial growth factor expression in small cell lung cancer cells. Mol Cancer Ther. 2006;5:1415–1422. doi: 10.1158/1535-7163.MCT-05-0503. 5/6/1415 [pii];10.1158/1535-7163.MCT-05-0503 [doi] [DOI] [PubMed] [Google Scholar]
- 22.Chang KH, Chan-Ling T, McFarland EL, Afzal A, Pan H, et al. IGF binding protein-3 regulates hematopoietic stem cell and endothelial precursor cell function during vascular development. Proc Natl Acad Sci U S A. 2007;104:10595–10600. doi: 10.1073/pnas.0702072104. [DOI] [PMC free article] [PubMed] [Google Scholar]
- 23.Dupont J, Khan J, Qu BH, Metzler P, Helman L, et al. Insulin and IGF-1 induce different patterns of gene expression in mouse fibroblast NIH-3T3 cells: identification by cDNA microarray analysis. Endocrinology. 2001;142:4969–4975. doi: 10.1210/endo.142.11.8476. [DOI] [PubMed] [Google Scholar]
- 24.Molkentin JD, Dorn GW. Cytoplasmic signaling pathways that regulate cardiac hypertrophy. Annu Rev Physiol. 2001;63:391–426. doi: 10.1146/annurev.physiol.63.1.391. [DOI] [PubMed] [Google Scholar]
- 25.Sheikh F, Raskin A, Chu PH, Lange S, Domenighetti AA, et al. An FHL1-containing complex within the cardiomyocyte sarcomere mediates hypertrophic biomechanical stress responses in mice. J Clin Invest. 2008;118:3870–3880. doi: 10.1172/JCI34472. [DOI] [PMC free article] [PubMed] [Google Scholar]
- 26.Cheng H, Kimura K, Peter AK, Cui L, Ouyang K, et al. Loss of enigma homolog protein results in dilated cardiomyopathy. Circ Res. 2010;107:348–356. doi: 10.1161/CIRCRESAHA.110.218735. [DOI] [PMC free article] [PubMed] [Google Scholar]
- 27.Essop MF. Cardiac metabolic adaptations in response to chronic hypoxia. J Physiol. 2007;584:715–726. doi: 10.1113/jphysiol.2007.143511. [DOI] [PMC free article] [PubMed] [Google Scholar]
- 28.Maeda N, Funahashi T, Hibuse T, Nagasawa A, Kishida K, et al. Adaptation to fasting by glycerol transport through aquaporin 7 in adipose tissue. Proc Natl Acad Sci U S A. 2004;101:17801–17806. doi: 10.1073/pnas.0406230101. [DOI] [PMC free article] [PubMed] [Google Scholar]
- 29.Wakayama Y, Inoue M, Kojima H, Jimi T, Shibuya S, et al. Expression and localization of aquaporin 7 in normal skeletal myofiber. Cell Tissue Res. 2004;316:123–129. doi: 10.1007/s00441-004-0857-y. [DOI] [PubMed] [Google Scholar]
- 30.Butler TL, Au CG, Yang B, Egan JR, Tan YM, et al. Cardiac aquaporin expression in humans, rats, and mice. Am J Physiol Heart Circ Physiol. 2006;291:H705–H713. doi: 10.1152/ajpheart.00090.2006. [DOI] [PubMed] [Google Scholar]
- 31.Skowronski MT, Lebeck J, Rojek A, Praetorius J, Fuchtbauer EM, et al. AQP7 is localized in capillaries of adipose tissue, cardiac and striated muscle: implications in glycerol metabolism. Am J Physiol Renal Physiol. 2007;292:F956–F965. doi: 10.1152/ajprenal.00314.2006. [DOI] [PubMed] [Google Scholar]
- 32.Adams JW, Sakata Y, Davis MG, Sah VP, Wang Y, et al. Enhanced Galphaq signaling: a common pathway mediates cardiac hypertrophy and apoptotic heart failure. Proc Natl Acad Sci U S A. 1998;95:10140–10145. doi: 10.1073/pnas.95.17.10140. [DOI] [PMC free article] [PubMed] [Google Scholar]
- 33.Small K, Feng JF, Lorenz J, Donnelly ET, Yu A, et al. Cardiac specific overexpression of transglutaminase II (G(h)) results in a unique hypertrophy phenotype independent of phospholipase C activation. J Biol Chem. 1999;274:21291–21296. doi: 10.1074/jbc.274.30.21291. [DOI] [PubMed] [Google Scholar]
- 34.Chen JS, Mehta K. Tissue transglutaminase: an enzyme with a split personality. Int J Biochem Cell Biol. 1999;31:817–836. doi: 10.1016/s1357-2725(99)00045-x. [DOI] [PubMed] [Google Scholar]
- 35.Milano CA, Dolber PC, Rockman HA, Bond RA, Venable ME, et al. Myocardial expression of a constitutively active alpha 1B-adrenergic receptor in transgenic mice induces cardiac hypertrophy. Proc Natl Acad Sci U S A. 1994;91:10109–10113. doi: 10.1073/pnas.91.21.10109. [DOI] [PMC free article] [PubMed] [Google Scholar]
- 36.Faber JE, Szymeczek CL, Salvi SS, Zhang H. Enhanced alpha1-adrenergic trophic activity in pulmonary artery of hypoxic pulmonary hypertensive rats. Am J Physiol Heart Circ Physiol. 2006;291:H2272–H2281. doi: 10.1152/ajpheart.00404.2006. [DOI] [PubMed] [Google Scholar]
- 37.Faber JE, Szymeczek CL, Cotecchia S, Thomas SA, Tanoue A, et al. Alpha1-adrenoceptor-dependent vascular hypertrophy and remodeling in murine hypoxic pulmonary hypertension. Am J Physiol Heart Circ Physiol. 2007;292:H2316–H2323. doi: 10.1152/ajpheart.00792.2006. [DOI] [PubMed] [Google Scholar]
- 38.Park HK, Park SJ, Kim CS, Paek YW, Lee JU, et al. Enhanced gene expression of renin-angiotensin system, TGF-beta1, endothelin-1 and nitric oxide synthase in right-ventricular hypertrophy. Pharmacol Res. 2001;43:265–273. doi: 10.1006/phrs.2000.0777. [DOI] [PubMed] [Google Scholar]
- 39.Jiang Y, Dai A, Li Q, Hu R. Hypoxia induces transforming growth factor-beta1 gene expression in the pulmonary artery of rats via hypoxia-inducible factor-1alpha. Acta Biochim Biophys Sin. 2007;39:73–80. doi: 10.1111/j.1745-7270.2007.00249.x. [DOI] [PubMed] [Google Scholar]
- 40.Bianchi P, Kunduzova O, Masini E, Cambon C, Bani D, et al. Oxidative stress by monoamine oxidase mediates receptor-independent cardiomyocyte apoptosis by serotonin and postischemic myocardial injury. Circulation. 2005;112:3297–3305. doi: 10.1161/CIRCULATIONAHA.104.528133. [DOI] [PubMed] [Google Scholar]
- 41.Bianchi P, Pimentel DR, Murphy MP, Colucci WS, Parini A. A new hypertrophic mechanism of serotonin in cardiac myocytes: receptor-independent ROS generation. FASEB J. 2005;19:641–643. doi: 10.1096/fj.04-2518fje. [DOI] [PubMed] [Google Scholar]
- 42.Sivasubramaniam SD, Finch CC, Rodriguez MJ, Mahy N, Billett EE. A comparative study of the expression of monoamine oxidase-A and -B mRNA and protein in non-CNS human tissues. Cell Tissue Res. 2003;313:291–300. doi: 10.1007/s00441-003-0765-6. [DOI] [PubMed] [Google Scholar]
- 43.Rodriguez MJ, Saura J, Billett EE, Finch CC, Mahy N. Cellular localization of monoamine oxidase A and B in human tissues outside of the central nervous system. Cell Tissue Res. 2001;304:215–220. doi: 10.1007/s004410100361. [DOI] [PubMed] [Google Scholar]
- 44.Redout EM, Wagner MJ, Zuidwijk MJ, Boer C, Musters RJ, et al. Right-ventricular failure is associated with increased mitochondrial complex II activity and production of reactive oxygen species. Cardiovasc Res. 2007;75:770–781. doi: 10.1016/j.cardiores.2007.05.012. [DOI] [PubMed] [Google Scholar]
- 45.Iglarz M, Clozel M. At the heart of tissue: endothelin system and end-organ damage. Clin Sci (Lond) 2010;119:453–463. doi: 10.1042/CS20100222. [DOI] [PubMed] [Google Scholar]
- 46.Balasubramanian S, Mani SK, Kasiganesan H, Baicu CC, Kuppuswamy D. Hypertrophic stimulation increases beta-actin dynamics in adult feline cardiomyocytes. PLoS One. 2010;5:e11470. doi: 10.1371/journal.pone.0011470. [DOI] [PMC free article] [PubMed] [Google Scholar]
- 47.Chen SJ, Chen YF, Meng QC, Durand J, Dicarlo VS, et al. Endothelin-receptor antagonist bosentan prevents and reverses hypoxic pulmonary hypertension in rats. J Appl Physiol. 1995;79:2122–2131. doi: 10.1152/jappl.1995.79.6.2122. [DOI] [PubMed] [Google Scholar]


