Abstract
In-cell nuclear magnetic resonance spectroscopy is a tool for studying proteins under physiologically relevant conditions. In some instances, however, protein signals from leaked protein are observed in the liquid surrounding the cells. Here, we examine the expression of four proteins in Escherichia coli. We describe the controls that should be used for in-cell NMR experiments, and show that leakage is likely when the protein being studied exceeds approximately 20% of the total cellular protein.
Keywords: in-cell NMR, protein expression, protein leakage
INTRODUCTION
The cellular environment is complex, with macromolecule concentrations as high as 400 g/L.1–3 Most proteins are studied outside cells in dilute solution with macromolecular concentrations of 10 g/L or less. There can be discrepancies when studying proteins in dilute solution compared to the crowded cellular environment.4–11 There is, therefore, a need to study proteins inside living cells.12
15N enrichment and overexpression alone are often insufficient to obtain high quality in-cell NMR spectra of the protein of interest in Escherichia coli. Specifically, the intracellular environment can cause resonances to broaden beyond detectability.10,13 This situation makes it likely that leaked proteins will cause artifacts, which resulted in the corresponding author having to retract two manuscripts.14–16 Specifically, in those studies all the supposed in-cell protein dynamics data were from apocytochrome b5 that had leaked from the cells.
Here, we use E. coli to investigate the connection between protein expression, protein leakage, and in-cell NMR. We studied four proteins, human α-synuclein, E. coli HdeA, barley chymotrypsin inhibitor 2 (CI2), and human ubiquitin. Each protein is expressed in a soluble form (i.e., there is not evidence of inclusion bodies). Transcription of the structural genes was driven by a T7 promoter, controlled by a lac operator.17 α-Synuclein is a 14.4 kDa intrinsically disordered protein that has been observed in both the periplasm and cytoplasm of E. coli.11,18 HdeA, a 11.8 kDa globular dimer, is exclusively periplasmic.19 CI2, a 7.4 kDa globular protein, is normally found in the cytoplasm, but is also observed in the in the periplasm13,20 Ubiquitin is a 8.5 kDa globular protein found in the cytoplasm.20,21
MATERIALS AND METHODS
Culture methods
The pET-21c (+), pT7-7, pET-21 and pET-46 plasmids containing the genes for HdeA,22 α-synuclein, chymotrypsin inhibitor 2 (CI2),8,23 and ubiquitin,24 respectively, were transformed into E. coli Bl-21 (DE3) Gold cells (Strategene). The expression systems were gifts from James Bardwell, Peter Lansbury, Andrew Lee, and Alexander Shekhtman, respectively. Plasmid containing cells for HdeA, α-synuclein and ubiquitin were selected with 0.1 mg/mL ampicillin. Plasmid containing cells for CI2 were selected with 0.06 mg/mL kanamycin. A 5 mL overnight culture was grown from a single colony. The overnight culture was used to inoculate a 100 mL culture of M9 minimal media containing 1 g/L 15NH4Cl.25 The culture was incubated at 37°C in a rotary shaker (225 rpm, New Brunswick Scientific, Model I-26). After reaching an absorbance at 600 nm (A600) of 0.6–0.8, the culture was induced with isopropyl β-D-thiogalactopyranoside (IPTG) to a final concentration of 1 mM. The culture was placed in the rotary shaker (225 rpm) at 37°C. After 1.5 h, a 50 mL aliquot was pelleted using a swinging bucket centrifuge (Sorvall RC-3B, H6000A rotor) at 1600g for 20 min at 4°C. The pellet was resuspended in 1 mL of Phosphate Buffered Saline (PBS, 3.2 mM Na2HPO4·7H2O, 0.5 mM KH2PO4, 1.3 mM KCl, 135 mM NaCl, pH 7.4). The remainder of 100 mL culture incubated with shaking for 3 h before processing as described above.
Immediately after obtaining in-cell NMR spectra, cells were pelleted by centrifugation (Eppendorf model 5418) at 2000g for 10 min at room temperature. The supernatant was removed for NMR experiments. The resulting cell pellet was resuspended in 1 mL lysis buffer (50 mM Tris, 150 mM NaCl, pH 8.0) and sonicated (Branson Ultrasonics, Fischer Scientific) for 1 min with a duty cycle of 4 s on 2 s off. The lysate was harvested by centrifugation (Eppendorf model 5418) at 14,000g for 5 min at room temperature.
Intracellular Protein Concentrations and Location
After 1.5, 2 and 3 h of expression an aliquot was diluted with PBS so that the A600 was 1.0, which equals 6.0 × 10⁸ cells/mL.26 A 1 mL aliquot was removed from the diluted samples and centrifuged (Eppendorf model 5418) at 14,000g for 2 min at room temperature. E. coli Intracellular protein concentrations and locations were determined as described by Slade et al.18 Briefly, cells were subjected to osmotic shock, releasing the contents of the periplasm. The periplasmic and cytoplasmic fractions were then subjected to SDS PAGE. Protein concentrations estimates from SDS PAGE experiments are based on comparisons to the purified proteins.
NMR
Data were acquired at the UNC Biomolecular NMR facility on a Varian Inova 600 MHz spectrometer. The spectra were processed and visualized with NMRpipe and NMRviewJ, respectively.27,28
Samples for in-cell NMR experiments comprised 90:10 (v:v) mixture of resuspended cells: D2O in a standard 5 mm NMR tube. Supernatant and cell lysate samples comprised 90:10 (v:v) mixtures of supernatant: D2O in a standard 5 mm NMR tube. 1H-15N SOFAST HMQC spectra29 were acquired at 37°C with a 5 mm Varian Triax triple resonance probe (1H sweep width: 11990.40 Hz; 15N sweep width: 2100 Hz, 32 transients, 128 increments). Each spectrum required 35 min.
Results
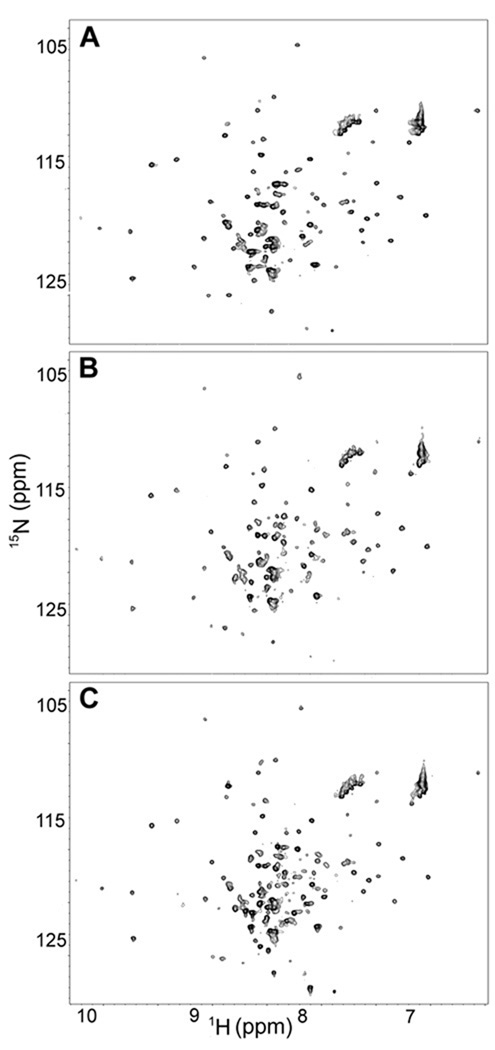
1H-15N SOFAST HMQC spectra of E. coli cell slurries expressing the periplasmic protein HdeA were obtained 3.0 h after inducing with IPTG. Protein resonances from HdeA were visible [Figure 1(A)].30 To check for leakage, the slurry was centrifuged and a spectrum of the supernatant acquired. The supernatant showed a strong protein spectrum [Figure 1(B)], similar to that observed in the lysate [Figure (1C)]. The supernatant spectrum arises from protein that has leaked out of the cells.
Figure 1.
SOFAST 15N – 1H HMQC29 spectra from E. coli expressing HdeA after 3.0 h of induction [A, cell slurry; B, supernatant immediately after acquisition of cell slurry spectrum; C, cell lysate].
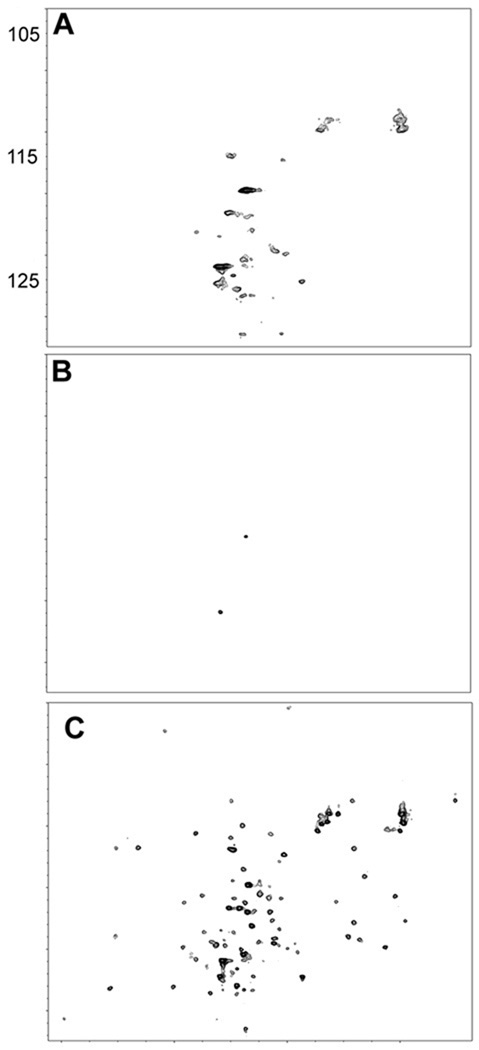
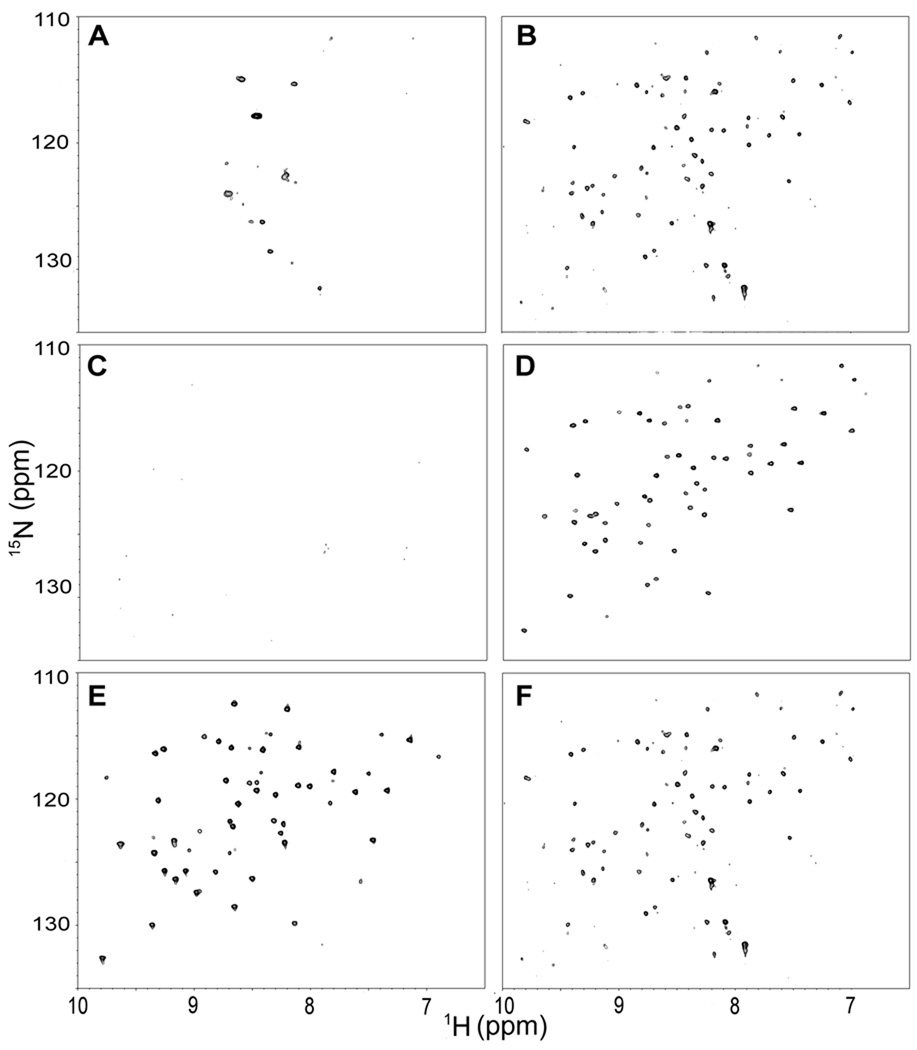
To assess how the expression level contributes to leakage, a spectrum of the cell slurry was acquired at a shorter time after induction, 1.5 h. Crosspeaks characteristic of HdeA were absent [Figure 2(A,B)] but metabolite signals were observed.14 In comparison, the lysate contains resonances typical of HdeA [Figure 2(C)]. For CI2 after 1.5 h of expression, crosspeaks characteristic of the protein31 were absent from spectra of the cell slurry and the cell supernatant [Figure 3(A,C)], but were visible in the spectrum from the lysate [Figure 3(E)]. Spectra collected 3 h post induction show leakage [Figure 3(B,D,F)], in agreement with previous results.13 We also examined α-synuclein and ubiquitin expression systems. Inspection of spectra like those collected in Figures 1 and 2 for these proteins show that they do not leak, in agreement with a previous study. Spectra of cell slurries, supernatants, and lysates for the α-synuclein and ubiquitin expression systems have been published.13 The amounts of all these proteins per cell and their intracellular locations after 1.5 and 3.0 h of expression are given in Table 1.
Figure 2.
Spectra from E. coli expressing HdeA after 1.5 h of induction. The panels are described in the legend to Figure 1.
Figure 3.
Spectra from E. coli expressing CI2 after induction for 1.5 h (left panels) and 3.0 h (right panels) [A–B, cell slurry; C–D, supernatant immediately after acquisition of cell slurry spectra; E–F, cell lysates].
Table I.
Intracellular Concentrationsa
| Protein | Expression Level (fg/cell)b | ||||
|---|---|---|---|---|---|
| After 1.5 h, | leakage | After 3 h, | leakage | Location | |
| HdeA | 45 ±4c, | no | 72 ±7, | yes | Periplasim |
| α-Synuclein | 21 ±7, | no | 41 ±9, | no | Periplasm/Cytoplasm |
| Chymotrypsin Inhibitor 2 | 55 ±7, | no | 100 ±11, | yes | Cytoplasm/Periplasm |
| Ubiquitin | 12 ±4, | no | 32 ±6, | no | Cytoplasm |
Quantified by integrating pixel intensities of bands from Coomassie-stained SDS PAGE and comparing them against standards of the pure proteins.18
Values were obtained from unsaturated cultures, and cannot be used to assess protein yield from saturated cultures.
Standard error, n=4.
Discussion
We compared the locations and concentrations of four proteins in E. coli cells to the observation of leakage. As indicated in Table 1, ubiquitin and HdeA are localized in the cytoplasm and periplasm, respectively,19,21 while CI2 and α-synuclein are localized in both the periplasmic and cytoplasm.13,18 Given the differing locations of the proteins, we chose to present the data in terms of protein mass per cell, which includes both the cytoplasmic and periplasmic volumes. The approximate intracellular concentration of the proteins can be calculated from the values in Table 1, the proteins’ molar masses, and the volume of an E. coli cell (~10−15 L).
For the periplasmic protein HdeA, leaking occurs when its intracellular concentration exceeds ~5 mM, which occurs ~1.5 h post induction. In contrast, the cytoplasmic protein ubiquitin, which does not leak, reaches an intracellular concentration of only ~4 mM after 3.0 h of induction. Unfortunately, we cannot definitely state that cytoplasmically-expressed proteins do not leak because ubiquitin has the lowest expression level of the proteins studied here. For CI2, which is found in both the cytoplasm and periplasm, intracellular concentrations exceeding ~7.5 mM result in leakage. By comparison, intracellular concentrations of α-synuclein, which is found throughout the cell but does not leak, are only ~3.0 mM after 3.0 h of induction. In summary, leakage does not occur for proteins expressed at lower levels. Our conclusion is supported by previous results, which showed that CI2 does not leak when expressed using the less efficient trifluoromethyl-l-phenylalanine system.13
We can estimate the percent mass of our protein in cells by assuming that the total protein concentration in cells remains constant at 400 g/L.2 This assumption is known to be true for the protein FlgM.32 Leakage begins when the overexpressed protein reaches 15–20% of the cellular protein. For CI2, leaking is observed at an intracellular concentration of ~14 mM, which equates to approximately 25% of total cellular protein.
Li et al. estimated that after 3.0 h of expression the amount of CI2 in the supernatant of the cell slurry is only approximately 5–10% of total CI2, yet this leaked protein accounts for 100% of the NMR signal observed in the slurry.13 Data from other in-cell NMR experiments show that 90–95% of the E. coli remain viable.11,14 Taken together, these data suggest that the CI2 found in the supernatant is the product of cell lysis. In addition, leakage of CI2 is concomitant with an increased amount of the protein in the periplasm; an observation consistent with the known non-specific leakage from the periplasm.33
In summary, we showed that overexpression can lead to leakage when the amount of overexpressed protein approaches or exceeds 50 fg/cell. This is an important benchmark for in-cell protein NMR, especially for globular proteins where the leaked protein contributes to 100% of the 1H-15N NMR signal.10,13
Acknowledgements
We thank Lila M. Gierasch and Qinghua Wang for bringing the leakage problem to our attention. We thank Elizabeth Pielak and the Pielak laboratory for helpful comments.
Grant sponsors: NSF: Grant number MCB-051647; NIH: Grant number: DP1OD783.
References
- 1.Zimmerman SB, Trach SO. Estimation of macromolecule concentrations and excluded volume effects for the cytoplasm of Escherichia coli. J Mol Biol. 1991;222:599–620. doi: 10.1016/0022-2836(91)90499-v. [DOI] [PubMed] [Google Scholar]
- 2.Luby-Phelps K. Cytoarchitecture and physical properties of cytoplasm: Volume, viscosity, diffusion, intracellular surface area. Int Rev Cytol. 2000;192:189–221. doi: 10.1016/s0074-7696(08)60527-6. [DOI] [PubMed] [Google Scholar]
- 3.McGuffee SR, Elcock AH. Diffusion, crowding & protein stability in a dynamic molecular model of the bacterial cytoplasm. PLoS Comput Biol. 2010;6:e1000694. doi: 10.1371/journal.pcbi.1000694. [DOI] [PMC free article] [PubMed] [Google Scholar]
- 4.Elcock AH. Models of macromolecular crowding effects and the need for quantitative comparisons with experiment. Current Opinion in Structural Biology. 2010;20:196–206. doi: 10.1016/j.sbi.2010.01.008. [DOI] [PMC free article] [PubMed] [Google Scholar]
- 5.Miklos AC, Li C, Sharaf NG, Pielak GJ. Volume Exclusion and Soft Interaction Effects on Protein Stability under Crowded Conditions. Biochemistry. 2010 doi: 10.1021/bi100727y. in press. [DOI] [PMC free article] [PubMed] [Google Scholar]
- 6.Wang Y, Li C, Pielak GJ. Effects of proteins on protein diffusion. J Am Chem Soc. 2010;132:9392–9397. doi: 10.1021/ja102296k. [DOI] [PMC free article] [PubMed] [Google Scholar]
- 7.Ai X, Zhou Z, Bai Y, Choy WY. 15N NMR spin relaxation dispersion study of the molecular crowding effects on protein folding under native condtions. J Am Chem Soc. 2006;138:3916–3917. doi: 10.1021/ja057832n. [DOI] [PubMed] [Google Scholar]
- 8.Charlton LM, Barnes CO, Li C, Orans J, Young GB, Pielak GJ. Residue-level interrogation of macromolecular crowding effects on protein stability. J Am Chem Soc. 2008;130:6826–6830. doi: 10.1021/ja8005995. [DOI] [PMC free article] [PubMed] [Google Scholar]
- 9.Homouz D, Perham M, Samiotakis A, Cheung MS. Wittung-Stafshede. Crowded cell-like environment induces shape changes in aspherical protein. Proc Natl Acad Sci USA. 2008;105:11754–11759. doi: 10.1073/pnas.0803672105. [DOI] [PMC free article] [PubMed] [Google Scholar]
- 10.Li C, Charlton LM, Lakkavaram A, Seagle C, Wang G, Young GB, MacDonald JM, Pielak GJ. Differential dynamical effects of macromolecular crowding on an intrinsically disordered protein and a globular protein: implications for in-cell NMR spectroscopy. J Am Chem Soc. 2008;130:6310–6311. doi: 10.1021/ja801020z. [DOI] [PMC free article] [PubMed] [Google Scholar]
- 11.McNulty BC, Tripathy A, Young GB, Charlton LC, Orans J, Pielak GJ. Temperature-induced reversible conformational change in the first 100 residues of alpha-synuclein. Protein Sci. 2006;15:602–608. doi: 10.1110/ps.051867106. [DOI] [PMC free article] [PubMed] [Google Scholar]
- 12.Pielak GJ, Li C, Miklos AC, Schlesinger AP, Slade KM, Wang G, Zigoneanu IG. Protein nuclear magnetic resonance under physiological conditions. Biochemistry. 2009;28:226–234. doi: 10.1021/bi8018948. [DOI] [PMC free article] [PubMed] [Google Scholar]
- 13.Li C, Wang Y, Creager-Allen R, Lutz EA, Scronce H, Slade KM, Ruf RAS, Mehl RA, Pielak GJ. Protein :19F NMR in Escherichia coli. J Am Chem Soc. 2009;132:321–327. doi: 10.1021/ja907966n. [DOI] [PMC free article] [PubMed] [Google Scholar]
- 14.Bryant JE, Lecomte JT, Lee AL, Young GB, Pielak GJ. Protein dynamics in living cells. Biochemistry. 2005;44:9275–9279. doi: 10.1021/bi050786j. [DOI] [PubMed] [Google Scholar]
- 15.Bryant JE, Lecomte JTJ, Lee AL, Young GB, Pielak GJ. Cytosol has a small effect on protein backbone dynamics. Biochemistry. 2006;45:10085–10091. doi: 10.1021/bi060547b. [DOI] [PubMed] [Google Scholar]
- 16.Pielak GJ. Retraction: Protein dynamics in living cells and Cytosol has a small effect on protein backbone dynamics. Biochemistry. 2007;46:8206. [Google Scholar]
- 17.Studier FW, Moffatt BA. Use of bacteriophage T7 RNA polymerase to direct selective high-level expression of cloned genes. J Mol Biol. 1986;189:113–130. doi: 10.1016/0022-2836(86)90385-2. [DOI] [PubMed] [Google Scholar]
- 18.Slade KM, Baker R, Chua M, Thompson NL, Pielak GJ. Effects of recombinant protein expression on green fluorescent protein diffusion in Escherichia coli. Biochemistry. 2009;48:5083–5089. doi: 10.1021/bi9004107. [DOI] [PMC free article] [PubMed] [Google Scholar]
- 19.Gajiwala KS, Burley SK. HDEA, a periplasmic protein that supports acid resistance in pathogeneic enteric bacteria. J Mol Biol. 2000;295:605–612. doi: 10.1006/jmbi.1999.3347. [DOI] [PubMed] [Google Scholar]
- 20.Jackson SE, Fersht AR. Folding of chymotrypsin inhibitor 2. 1. Evidence for a two-state transition. Biochemistry. 1991;30:10428–10435. doi: 10.1021/bi00107a010. [DOI] [PubMed] [Google Scholar]
- 21.Hochstrasser M. Origin and function of ubiquitin-like proteins. Nature. 2009;458:422–429. doi: 10.1038/nature07958. [DOI] [PMC free article] [PubMed] [Google Scholar]
- 22.Tapley TL, Körner JL, Barge MT, Hupfeld J, Schauerte JA, Gafni A, Jakob U, Bardwell JCA. Structural plasticity of an acid-activated chaperone allows promiscuous substrate binding. Proc Natl Acad Sci USA. 2009;106:5557–5562. doi: 10.1073/pnas.0811811106. [DOI] [PMC free article] [PubMed] [Google Scholar]
- 23.Li C, Wang Y, Creager-Allen R, Lutz EA, Scronce H, Slade KM, Ruf RAS, Mehl RA, Pielak GJ. Protein 19F NMR in Escherichia coli. J Am Chem Soc. 2010;132:321–327. doi: 10.1021/ja907966n. [DOI] [PMC free article] [PubMed] [Google Scholar]
- 24.Burz DS, Dutta K, Cowburn D, Shekhtman A. Mapping structural interactions using in-cell NMR spectroscopy (STINT-NMR) Nature Methods. 2006;3:91–93. doi: 10.1038/nmeth851. [DOI] [PMC free article] [PubMed] [Google Scholar]
- 25.Serber Z, Ledwidge R, Miller SM, Dötsch V. Evaluation of parameters critical to observing proteins inside living Escherichia coli by in-cell NMR spectroscopy. J Am Chem Soc. 2001;123:8895–8901. doi: 10.1021/ja0112846. [DOI] [PubMed] [Google Scholar]
- 26.Bainer R, Park H, Cluzel P. A high-throughput capillary assay for bacterial chemotaxis. J Microbiol Methods. 2003;55:315–319. doi: 10.1016/s0167-7012(03)00112-x. [DOI] [PubMed] [Google Scholar]
- 27.Delaglio F, Grzesiek S, Vuister GW, Zhu G, Pfeifer J, Bax A. NMRPipe: A multidimensional spectral processing system based on UNIX pipes. Journal of Biomolecular NMR. 1995;6:277–293. doi: 10.1007/BF00197809. [DOI] [PubMed] [Google Scholar]
- 28.Johnson BA, Blevins RA. NMR View: A computer program for the visualization and analysis of NMR data. Journal of Biomolecular NMR. 1994;4:603–614. doi: 10.1007/BF00404272. [DOI] [PubMed] [Google Scholar]
- 29.Schanda P, Brutscher B. Very fast two-dimensional NMR spectroscopy for real-time investigation of dynamic events in proteins on the time scale of seconds. J Am Chem Soc. 2005;127:8014–8015. doi: 10.1021/ja051306e. [DOI] [PubMed] [Google Scholar]
- 30.Hong W, Jiao W, Hu J, Zhang J, Liu C, Fu X, Shen D, Xia B, Chang Z. Periplasmic protein HdeA exhibits chaperone-like activity exclusively within stomach pH range by transfroming into disordered conformatoin. J Biol Chem. 2005;280:27029–27034. doi: 10.1074/jbc.M503934200. [DOI] [PubMed] [Google Scholar]
- 31.Shaw GL, Davis B, Keller J, Fersht AR. Backbone dynamics of chymotrypsin inhibitor 2: effect of breaking the active site bond and its implications for the mechanism of inhibition of serine proteases. Biochemistry. 1995;34:2225–2233. doi: 10.1021/bi00007a017. [DOI] [PubMed] [Google Scholar]
- 32.Dedmon MM, Patel CN, Young GB, Pielak GJ. FlgM gains structure in living cells. Proc Natl Acad Sci USA. 2002;99:12681–12684. doi: 10.1073/pnas.202331299. [DOI] [PMC free article] [PubMed] [Google Scholar]
- 33.Mergulhão FJM, Summers DK, Monteiro GA. Recombinant protein secretion in Escherichia coli. Biotechnology Advances. 2005;23:177–202. doi: 10.1016/j.biotechadv.2004.11.003. [DOI] [PubMed] [Google Scholar]


