Abstract
Rhythms in the α frequency band (8-13 Hz) are a defining feature of the human EEG during relaxed wakefulness and are known to be influenced by the thalamus. In the early stages of sleep and in several neurological and psychiatric conditions α rhythms are replaced by slower activity in the θ (3-7 Hz) band. Of particular interest is how these α and θ rhythms are generated at the cellular level. Recently we identified a subset of thalamocortical (TC) neurons in the lateral geniculate nucleus (LGN) which exhibit rhythmic high-threshold (>-55 mV) bursting at ~2-13 Hz and which are interconnected by gap junctions (GJs). These cells combine to generate a locally synchronized continuum of α and θ oscillations, thus providing direct evidence that the thalamus can act as an independent pacemaker of α and θ rhythms. Interestingly, GJ coupled pairs of TC neurons can exhibit both in-phase and anti-phase synchrony and will often spontaneously alternate between these two states. This dictates that the local field oscillation amplitude is not simply linked to the extent of cell recruitment into a single synchronized neuronal assembly but also to the degree of destructive interference between dynamic, spatially overlapping, competing anti-phase groups of continuously bursting neurons. Thus, the waxing and waning of thalamic α/θ rhythms should not be assumed to reflect a wholesale increase and reduction, respectively, in underlying neuronal synchrony. We argue that these network dynamics might have important consequences for relating changes in the amplitude of EEG α and θ rhythms to the activity of thalamic networks.
Keywords: EEG, mu rhythm, dendrites, metabotropic glutamate receptor, gap junctions
Introduction
The dominant occipital α rhythm was the first EEG phenomenon to be discovered by Hans Berger in the early part of the last century (Berger, 1933; Berger, 1936) and is one of the most prominent oscillatory components of the human EEG (Niedermeyer, 1993b). This rhythm occurs at ~10 Hz (range 8-13 Hz), is most pronounced during relaxed wakefulness and is greatly suppressed by eye opening. The transient replacement of the occipital α rhythm with slower activity in the θ band (3-7 Hz) is a definitive marker for the transition to stage 1 sleep in humans (Niedermeyer, 1993a; De Gennaro et al., 2001). However, the persistent substitution of α activity by θ waves during ongoing wakefulness is a pathological finding and indicative of several neurological and psychiatric conditions ranging from Parkinson’s disease and epilepsy to schizophrenia and depression (Niedermeyer, 1997; Llinás et al., 1999). Although less prominent than the dominant occipital rhythm, analogous α frequency oscillations are also evident in other sensory brain areas (Niedermeyer, 1997; Hughes and Crunelli, 2005). The most notable of these is the Rolandic mu (μ) rhythm that can be observed in the sensorimotor cortex (Jasper and Andrews, 1938). This rhythm is also present during periods of relaxed wakefulness but is diminished by tactile stimuli and motor activity (Pfurtscheller and Neuper, 1994; Pfurtscheller et al., 1997).
Although the rhythms in the α band that characterise relaxed wakefulness (i.e. the occipital α and Rolandic μ rhythms) have often been referred to as ‘idling’ or ‘background’ oscillations (Adrian and Matthews, 1934; Pfurtscheller et al., 1997), an increasing amount of experimental data supports the view that dynamic changes in these activities may underlie and signify a variety of important cognitive functions (Başar et al., 1997a; Başar et al., 1997b; Başar et al., 1999; Klimesch, 1999; Pfurtscheller and Neuper, 1994; Pfurtscheller et al., 1997; Schurmann et al., 2000; Schürmann and Başar, 2001; Kalaycioglu and Nalcaci, 2001; Verstraeten and Cluydts, 2002; Doppelmayr et al., 2005). For this reason, the need to understand the cellular basis of these rhythms becomes paramount because without this information it is impossible to relate the macroscopic electrical changes observed in the EEG to the activity of the underlying neuronal circuits. With regard to this, several human studies have indicated that the thalamus plays a strategic role in generating normal EEG α rhythms. The majority of these studies have employed either functional magnetic resonance (fMRI) or positron emission tomography (PET) imaging to show that variations in EEG α activity are correlated with metabolic changes in the thalamus (Reviewed in Hughes et al., 2005; Goncalves et al., 2006) whilst others have utilised theoretical methods to indicate the presence of specific α rhythm generators at the thalamic level (Isaichev et al., 2001). In the case of pathologically-slowed α activity, it has been directly shown using depth recordings that the thalamus exhibits local rhythmic activity which is coherent with that present in the EEG (Sarnthein et al., 2003; Sarnthein et al., 2005).
Perhaps the strongest evidence of a key role for thalamic circuits in driving EEG α rhythms comes from the study of equivalent activities in animals. For example, in dogs a counterpart of the human occipital α rhythm is clearly evident in the visual cortex when the eyes are closed and occurs synchronously with oscillatory activity in the visual thalamus (i.e. the lateral geniculate nucleus, LGN) (Lopes da Silva et al., 1973, 1980). Moreover, whilst α rhythm episodes in the visual cortex are always accompanied by coherent thalamic activity, thalamic α rhythms can occur in isolation (Lopes da Silva et al., 1973). In the rat, a clear equivalent of the occipital α rhythm does not exist. However, a variety of rat strains exhibit robust μ-like rhythms in sensorimotor cortical areas with several lines of evidence suggesting that these are actively influenced by the thalamus (Reviewed in Hughes and Crunelli, 2005).
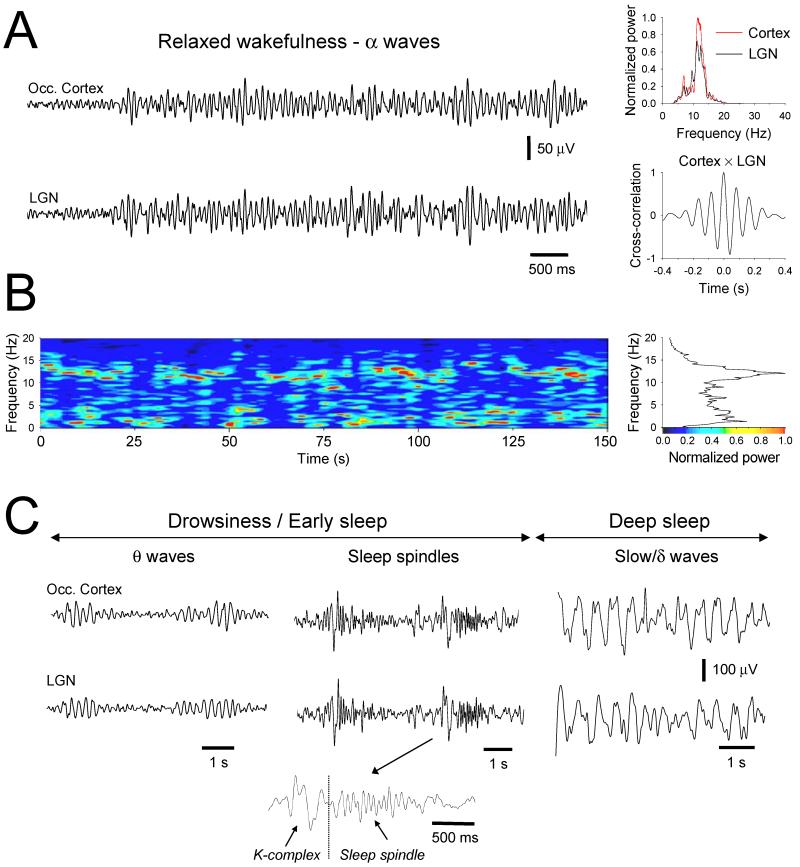
In cats, analogous activities to the occipital α and Rolandic μ rhythms are present in the visual and somatosensory cortices, respectively, during so-called quiet wakefulness (Bouyer et al., 1983; Chatila et al., 1992, 1993; Rougeul-Buser and Buser, 1997). In both cases, these rhythms occur coherently with oscillatory activity in related thalamic territories (Fig. 1A) (Bouyer et al., 1982, 1983; Chatila et al., 1993; Hughes et al. 2004). Indeed, in the case of α rhythms in the cat visual system, thalamic activity occurs in strict simultaneity with cortical rhythms (Chatila et al., 1993). For the cat equivalent of the somatosensory μ rhythm, the support for a thalamic pacemaker is even stronger since, i) thalamic activity commences before and concludes after the start and end of cortical rhythms, and ii) appropriate thalamic lesions eliminate cortical rhythms with no recovery whereas thalamic rhythms persist following destruction of the related cortical area (Bouyer et al., 1983). In similarity with human activities, cortical rhythms in the α band in cats are briefly replaced by θ oscillations during the onset of sleep (Fig. 1B and 1C) (Hughes et al., 2004). These θ rhythms also seem to involve thalamic circuits since they can be readily observed at the thalamic level with both monopolar and bipolar field recordings (P. Buser, personal communication).
Figure 1. Arousal-state related field oscillations in the freely moving cat.
A. Simultaneous extracellular field recordings from the occipital cortex (top) and LGN (bottom) of a cat during relaxed wakefulness with eyes closed displaying coherent α activity at ~12 Hz (see power spectra and cross-correlogram in the top and bottom right plots, respectively). B. Image showing the typical evolution of the power spectrum of an LGN field recording over an extended period of relaxed wakefulness. This primarily comprises oscillatory activity in the α band (8-13 Hz) but this can sometimes be briefly replaced by activity in the θ (2-7 Hz) range (each vertical slice represents a 4 s window which is progressively shifted by 500 ms). The graph on the right gives the normalized sum of the power spectra across the whole period and whilst clearly showing a dominant α band peak it also reveals a substantial concentration of power in the θ range. C. Simultaneous occipital cortex and LGN field recordings of the θ waves described above. Shifts into the θ range always precede the appearance of sleep-related oscillations such as K-complexes, spindles (middle traces) and slow/δ waves (right traces). (Reprinted from Hughes et al., 2004 with permission from Elsevier).
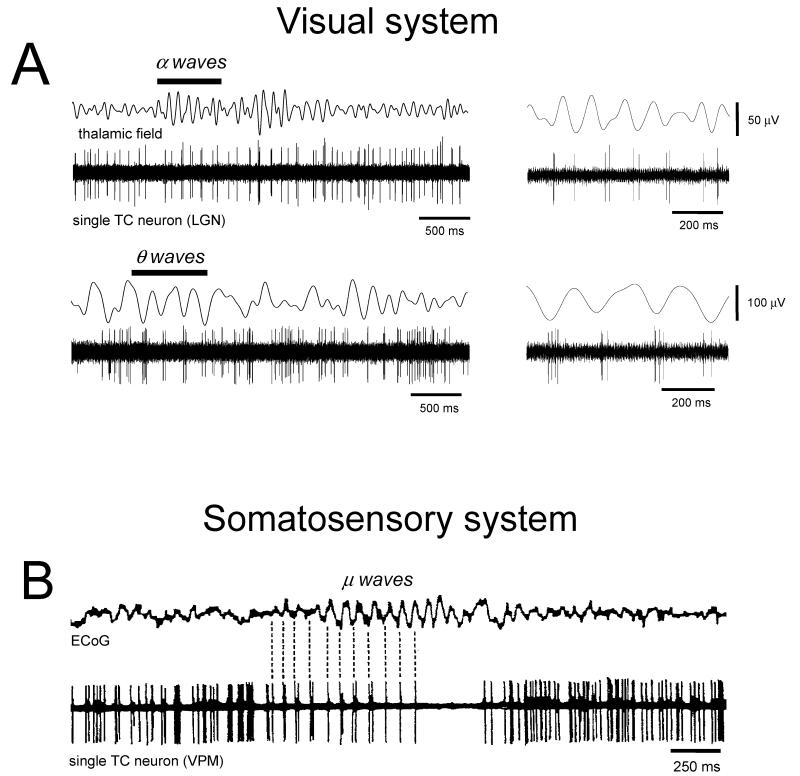
Further evidence that α and θ rhythms in cats actively involve the thalamus comes from experiments showing that these activities are associated with coherent firing in subsets of thalamocortical (TC) neurons (Bouyer et al., 1982; Hughes et al., 2004; Hughes et al., 2005). This firing consists of rhythmic action potential bursts that occur in close register with the thalamic and cortical waves (Fig. 2). These bursts cannot, however, be attributed to the classical low-threshold Ca2+-potential-(LTCP) mediated burst which is a prominent electrophysiological characteristic of TC neurons because the α/θ-related bursts exhibit comparatively large interspike intervals (ISIs) (~10 ms) which do not change as the burst progresses whereas LTCP-mediated bursts display much smaller ISIs (~2-5 ms) that gradually increase (see Fig. 3A) (Domich et al., 1986; Hughes et al., 2004).
Figure 2. Thalamocortical (TC) neuron firing associated with in vivo α and θ rhythms.
A. Extracellular single unit recording of an LGN TC neuron during α (top) and θ waves (bottom). TC neurons generate a mixture of single spikes and spike doublets in register with the local thalamic α waves. During θ activity a similar pattern is evident although in this condition TC neurons produce more spikes per burst during each wave. B. Extracellular single unit recording of a TC neuron in the ventral posterior medial nucleus (VPM) during μ waves reveals a similar pattern to that observed in the LGN (ECoG, electrocorticogram). (A modified from Hughes et al., 2004 with permission from Elsevier; B reproduced and modified with permission from Bouyer et al., 1982).
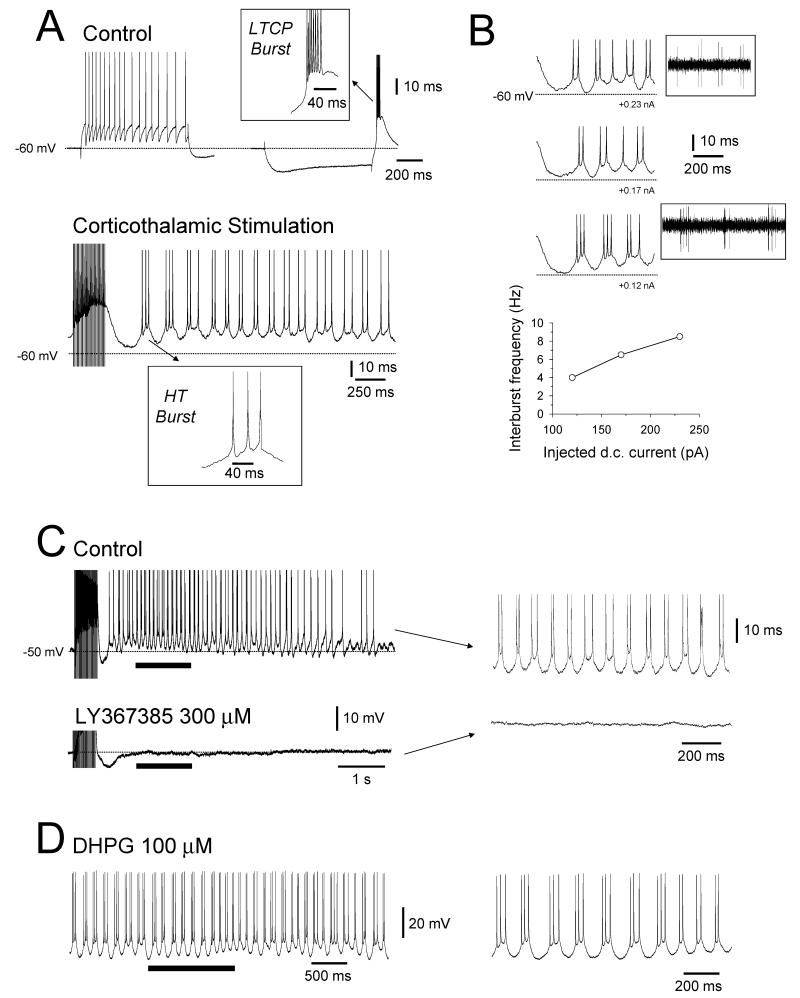
Figure 3. Synaptically and pharmacologically induced HT bursting.
A. Response of a LGN TC neuron recorded with intracellular electrodes in vitro to depolarizing (left) and hyperpolarizing (right) current steps in control conditions reveals tonic firing and LTCP-mediated bursting, respectively (upper traces). The inset above shows an enlargement of the LTCP burst which reveals the small ISIs of this event. Tetanic stimulation of corticothalamic (CT) fibers leads to a distinct type of bursting (i.e. HT bursting) in the same neuron (bottom trace). The inset below shows an enlarged HT burst which has relatively large ISIs in comparison to an LTCP burst. B. HT bursting increases in frequency with increasing d.c. current injection. Note that as the neuron is depolarized the number of spikes per burst decreases so that at α frequencies the activity comprises mainly a mixture of single spikes and spike doublets. Thus HT bursting is equivalent to the bursting observed in TC neurons during in vivo α and θ waves (see insets taken from Fig. 2A). C. Stimulus-induced HT bursting in a different LGN TC neuron (top trace) is abolished by the mGluR1a-specific antagonist, LY367385 (300 μM) (bottom trace). The sections marked by the continuous bars are enlarged on the right. D. HT bursting induced in an LGN TC neuron by application of the Group I mGluR specific agonist, DHPG (100 μM). The section marked by the continuous bar is enlarged on the right (A-C modified from Hughes et al., 2004 with permission from Elsevier).
Synaptic or pharmacological activation of mGluR1a induces a novel form of rhythmic bursting at α and θ frequencies in thalamocortical (TC) neurons in vitro
Given that the firing associated with thalamic α and θ rhythms is not readily explained by LTCP-mediated bursts, which cellular events generate this activity? Recently, using intracellular recordings we showed that stimulation of corticothalamic (CT) fibres in an isolated slice preparation of the cat LGN can induce a novel type of bursting in a subset (~25%) of TC neurons (Fig. 3A) with properties that are fully consistent with those of the bursting observed in vivo during α and θ rhythms (Fig. 2) (Crunelli et al., 2006; Hughes et al., 2002b; Hughes et al., 2004). This activity occurs at relatively depolarized membrane potentials (>-55 mV) and has therefore been termed high-threshold (HT) bursting. CT stimulation brings about HT bursting by activating the metabotropic glutamate receptor (mGluR), mGluR1a, because this effect is prevented by the mGluR1a-specific antagonist, LY367385 (300 μM) (Fig. 3C) and mimicked by exogenous application of either the Group I mGluR selective agonist, DHPG (50-100 μM) (Fig. 3D) or the Group I/II mGluR agonist, trans-ACPD (100 μM) (Fig. 4). This suggests that intact modulatory cortical input is required for thalamic α rhythm generation. Indeed, injection of mGluR1a antagonists in cats markedly reduces α rhythm density in favour of sleep-related EEG events such as spindles and K-complexes (Hughes et al., 2004).
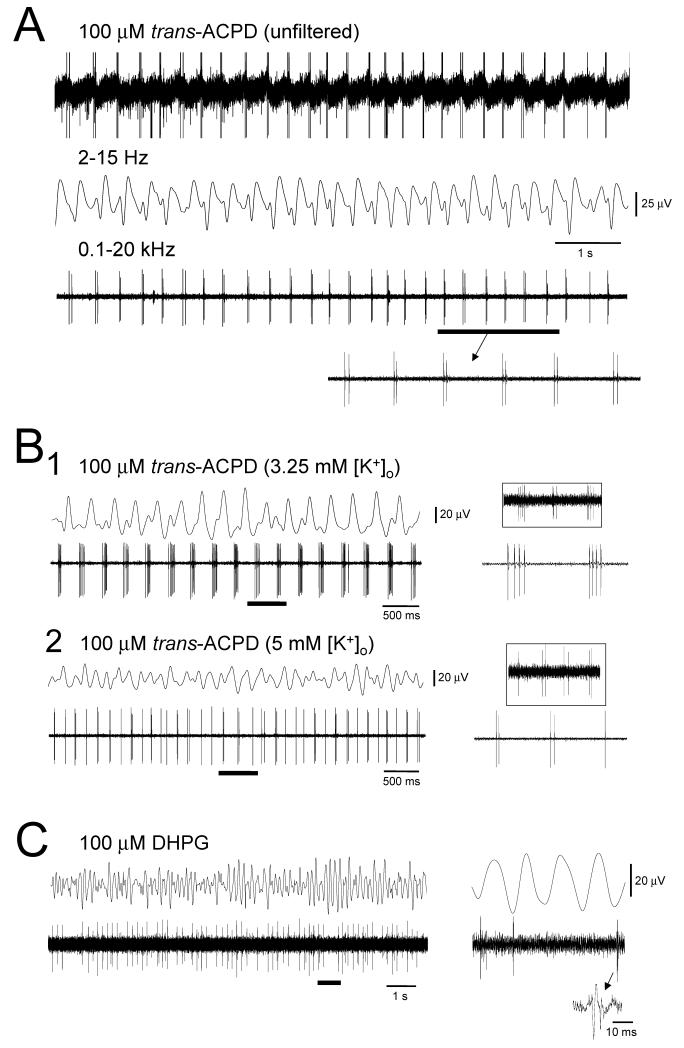
Figure 4. HT bursting is associated with robust field oscillations in the LGN slice.
A. Extracellular recordings of HT bursting TC neurons in the cat LGN slice also exhibit a coherent field oscillation in the presence of 100 μM trans-ACPD (see unfiltered trace, top). The field oscillation and unit activity can be effectively separated by appropriate band-pass filtering. B1. Simultaneous field and unit recording from the cat LGN slice in the presence of 100 μM trans-ACPD displaying coherent rhythmic activity in the θ band. B2. Increasing extracellular K+ from 3.25 to 5 mM increases the frequency of this activity. As with intracellular recordings the number of spikes per burst is greater at lower frequencies (again, matching that observed for TC neuron firing during in vivo α and θ waves (see insets, taken from Fig. 2A). C. Most (>90%) extracellularly-recorded TC neurons exhibit firing on every cycle of the accompanying field oscillation. However, a few neurons do not as shown here. The section marked by the continuous bar is expanded on the right.
Importantly, HT bursting occurs rhythmically in the approximate range 3-12 Hz with the precise frequency increasing with increasing depolarization (Fig. 3B; see also Hughes et al., 2004). This is consistent with the idea that the appearance of θ waves in vivo occurs as a result of thalamic disfacilitation, be it due to a natural decrease in brainstem influence during a normal reduction in arousal (McCormick, 1992; Niedermeyer, 1993a; De Gennaro et al., 2001) or as a result of a shortfall in certain key neurotransmitters in an ongoing pathological state (Soininen et al., 1992a,b; Llinás et al., 1999).
HT bursting and gap junctions generate synchronized α and θ rhythms in vitro
In vitro extracellular recordings performed in the presence of either DHPG (100 μM) or trans-ACPD (100-150 μM) show that rhythmic HT bursting in TC neurons can be associated with a robust field oscillation at the same frequency (Fig. 4A-C). As expected from intracellular recordings (Fig. 3B), depolarization of the TC neuron population by raising extracellular K+ from 3.25 to 5 mM leads to a notable increase in the frequency of HT bursting and associated field oscillation (Fig. 4B). A similar effect can also be produced by increasing the concentration of exogenous mGluR agonists. For example, the mean frequency of the field oscillation in 100 μM trans-ACPD is ~4 Hz whereas this increases to ~8 Hz when the concentration of trans-ACPD is raised to 150 μM (Hughes et al., 2004). Again, this is fully coherent with the suggestion that a shift from α to θ activity relates to thalamic disfacilitation (see above).
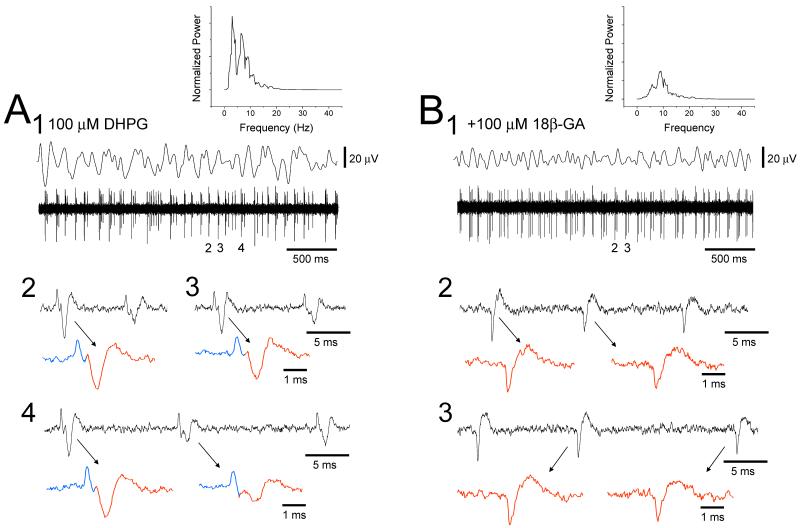
Close inspection of unit recordings obtained during in vitro α and θ rhythms often (~60%) reveals the presence of tightly synchronized (<2 ms) neuronal pairs (Fig. 5A). Whilst this synchrony can obviously explain the associated local field oscillation, it cannot be ascribed to conventional chemical synaptic transmission because, i) it is not blocked by antagonists of fast glutamatergic and GABAergic signaling (Hughes et al., 2004), and ii) for pairs of cells that are closely synchronized we almost never see either of these cells fire alone, i.e. the failure rate is almost zero (Fig. 5A). Correspondingly, α and θ field oscillations are also resistant to blockers of conventional synaptic transmission. However, both the tight neuronal synchrony and α and θ field oscillations are disrupted by drugs which target gap junctions (GJs) such as 18-β-glycyrrhetinic acid (18β-GA) (Fig. 5B) and carbenoxolone (CBX) (Davidson and Baumgarten, 1988) (see Fig. 9B). Thus, HT bursting and GJ coupling combine to produce a continuum of in vitro rhythms across a frequency range which seamlessly encompasses both the α and θ bands.
Figure 5. GJ blockers suppress field oscillations and neuronal synchrony.
A. Simultaneous field and unit recording from the cat LGN slice in the presence of 100 μM DHPG showing coherent rhythmic activity (corresponding power spectrum is in the top right). Close examination of the unit recording reveals two closely synchronized neurons (enlarged and shown in blue and red). B. The putative GJ blocker, 18-β glycyrrhetinic acic (18-β GA, 100 μM), greatly suppresses the field oscillation (see corresponding power spectrum in the top right) and abolishes the synchronized firing.
Figure 9. Phase shifting in a pair of TC neurons and its reliance on GJ coupling.
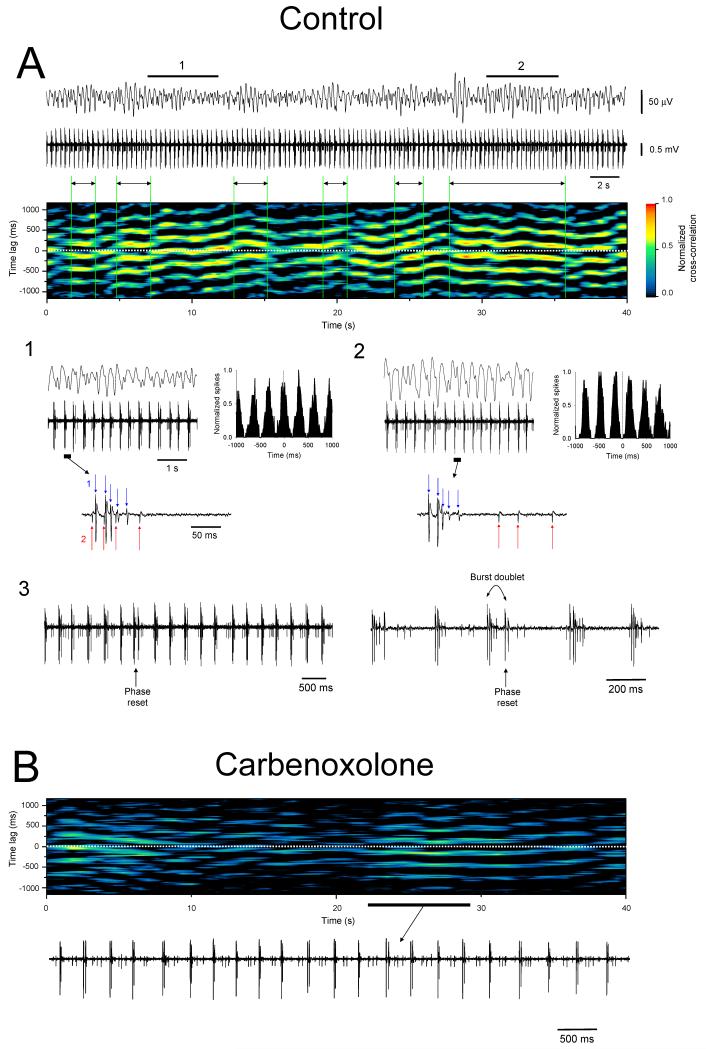
A. Simultaneous LGN field (top) and double-unit (bottom) recording obtained from the cat LGN slice in the presence of 100 μM trans-ACPD. The sliding window cross-correlogram of the two units shown below reveals that there is constant and spontaneous switching between an in-phase and anti-phase relationship (each vertical slice of the image represents a 1.5 s window which is consecutively shifted by 150 ms). Interestingly, larger amplitude waves in the field recording seem to occur when the two units are not synchronized (see double-headed arrows). This is because the larger amplitude unit is persistently out of phase with the main field oscillation and therefore competes against it. Thus when the smaller amplitude unit fires in synchrony with the larger one, the level of competition increases and the field oscillation is reduced in amplitude (note that because the shift in phase in the bursting of the smaller amplitude unit is discernible at the level of the field recording, a similar shift presumably occurs in other neurons at, or close to, the same time; see Fig. 8A1). This is clearly illustrated below where the sections marked 1 and 2 are expanded and show periods where the two neurons are in an in-phase and anti-phase relationship, respectively (as shown by the discrete cross-correlograms to the right). The underlined sections in 1 and 2 are further expanded below. A3. An extract of the above recording containing a phase reset from an anti-phase to in-phase scenario. Note how this occurs actively through the generation of burst doublet in the larger unit (expanded on the right). A shift to an anti-phase relationship on the other hand appears to occur through the two units seeming to simply ‘drift’ out of phase. B. Sliding window cross-correlogram showing how the phase switching depicted in A is greatly disrupted by 100 μM carbenoxolone (CBX) such that, i) the neurons now fire almost exclusively in an anti-phase manner, and ii) the bursting of the neurons is considerably weaker as shown by the reduction in intensity of the image. Both of these points can also be appreciated by scrutinizing the section of recording which is shown below. (modified from Hughes et al., 2004 with permission from Elsevier).
Evidence that HT bursts are transmitted to neighbouring neurons through GJs
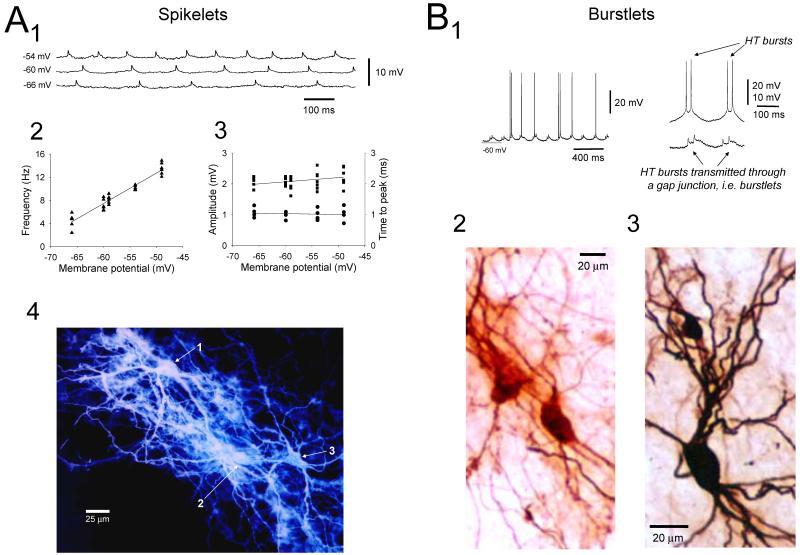
Although the possibility that TC neurons are coupled by GJs has historically not been readily acknowledged, experimental evidence has existed for some time indicating that this is the case. First, ultrastructural studies in rat thalamic relay nuclei have shown that TC neurons make extensive filamentous contacts and exhibit occasional close membrane appositions that resemble GJs (Lieberman and Spacek, 1997). Second, intracellular recordings from cat TC neurons in vivo have demonstrated the presence of small, subthreshold depolarizations or spikelets (Steriade et al., 1991) which possess virtually identical properties to those observed in other brain areas that are known to be caused by the propagation of action potentials through GJs (Logan et al., 1996; Galarreta and Hestrin, 1999; Venance et al., 2000; Gibson et al., 2005). Recently, we showed that spikelets can also be observed in TC neurons in vitro and that they indeed represent GJ-transmitted action potentials from other cells (Fig. 6A) (Hughes et al., 2002a). We later showed that HT bursts can also be transmitted through GJs leading to bursts of spikelets, or burstlets (Fig. 6B1) (Hughes et al., 2004; Long et al., 2004). Interestingly, most HT bursting TC neurons seem to be coupled to other HT bursting cells suggesting that groups of these neurons might form discrete networks (Hughes and Crunelli, 2005).
Figure 6. Evidence for GJ coupling between LGN TC neurons.
A. Rhythmic spikelets in a cat LGN TC neuron at different levels of injected d.c. current in the presence of 100 μM trans-ACPD. The frequency of these events is altered by membrane polarization (2) but the properties of individual events, i.e. amplitude (■) and time to peak (●), are not (3). This suggests that spikelets represent action potentials from distinct neurons which have been transmitted through a gap junction (GJ). This is confirmed by noting that injection of dye into this neuron leads to the staining of two additional cells (i.e. dye coupling) (4). Note that the ability to alter the frequency of firing in a TC neuron by varying injected d.c. current in a separate coupled neuron is suggestive of sparse coupling (see Hughes et al., 2004). Sparse coupling is also implied by the general lack of dye transfer to more than one or two additional cells (Hughes et al., 2002a). B1. LGN TC neuron exhibiting bursts of spikelets or burstlets (left trace). Note the intermittent entrainment of neuronal firing by these burstlets at this particular level of depolarization (cf. Fig. 4C; see also Fig. 8A in Hughes et al., 2004). The traces on the right show the similarity in properties of two consecutive HT bursts obtained from a different neuron (top) and two consecutive burstlets enlarged from the recording on the left (bottom). B2 and B3. Examples of dye coupling obtained following injection of markers into TC neurons exhibiting burstlets (B3 corresponds to the recording shown in Fig. 10). (A modified from Hughes et al., 2002a with permission from Elsevier; B modified from Hughes et al., 2004 with permission from Elsevier).
Anti-phase bursting, phase-shifting and the waxing and waning of in vitro α and θ rhythms
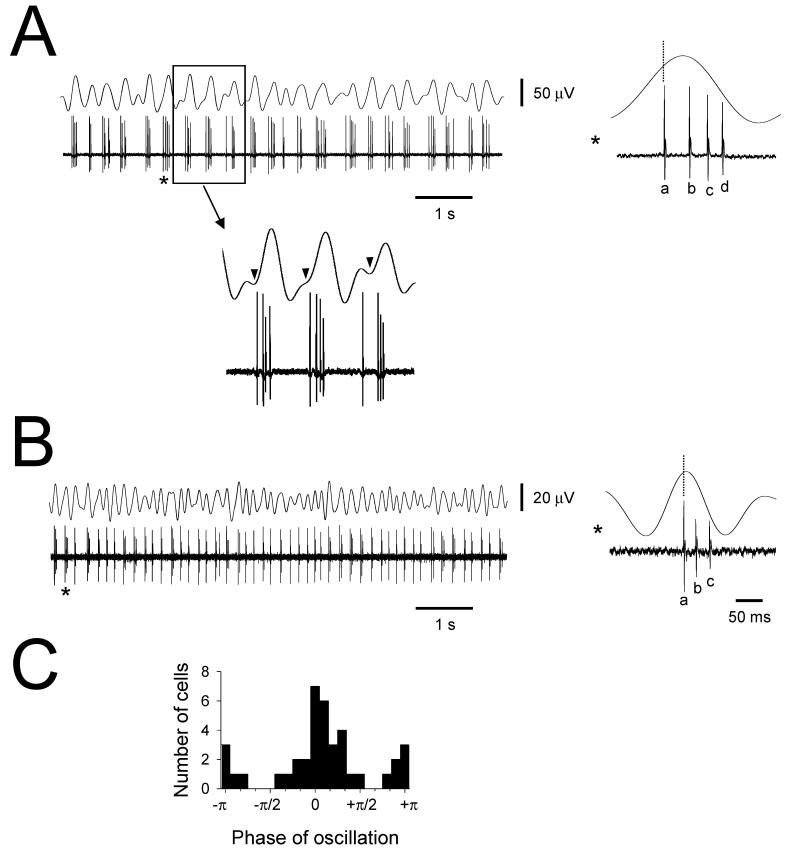
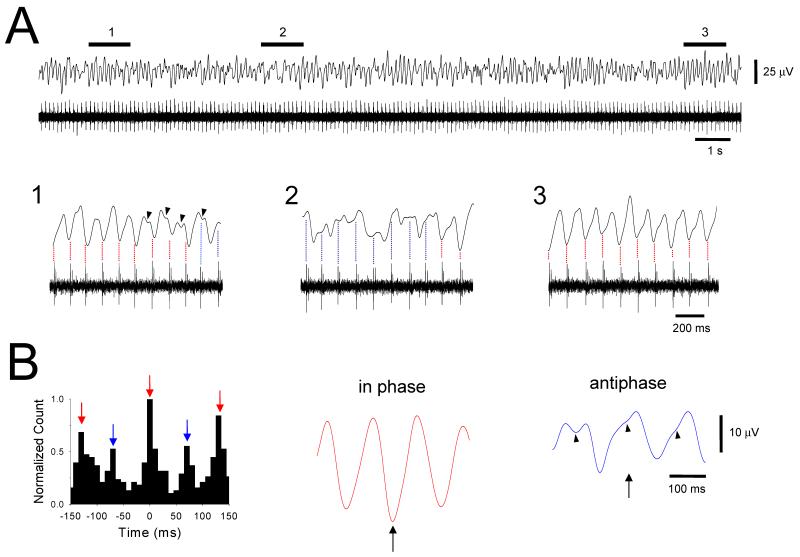
Although the majority of extracellularly-recorded TC neurons generate HT bursts consistently close to the negative peak of the field oscillation (as would be expected) (Figs. 4 and 5), a substantial proportion (~15%) of neurons fire in a persistent anti-phase relationship with this peak (Fig. 7). In a further subset (~10%) of neurons a dynamic behaviour exists whereby bursting continuously switches between an in-phase and anti-phase association (Fig. 8). Predictably, following a shift to an anti-phase pattern, the amplitude of the field oscillation is markedly reduced (Fig. 8A2 and 8B). However, in this condition these neurons continue to burst as rhythmically and robustly as before (Fig. 8A1 and 8A3). Taken together, these results indicate that the amplitude of the overall field oscillation reflects the degree of destructive interference between two neuronal populations which fire out-of-phase. The larger, more dominant of these groups obviously bursts in phase with the local field oscillation whereas the minority group fires anti-phasically. Accordingly, the waxing and waning of the field oscillation signifies the spontaneous shifting of continuously bursting neurons between these two populations.
Figure 7. Persistent anti-phase firing in groups of TC neurons.
A. Simultaneous field and single unit recording from the cat LGN showing HT bursting which consistently occurs with an anti-phase relationship to the main field oscillation. To the right is the field oscillation average, generated using the first action potential in the burst as a reference (see dotted line). The boxed section enlarged below shows the presence of a small anti-phase peak in the field recording (see arrowheads) which suggests that the activity of this unit is representative of a population of neurons. B. Additional example of a TC neuron which bursts in an anti-phase association with the dominant field rhythm. Trans-ACPD was present for both recordings. C. Histogram showing the phase relationship between the negative peak of the field oscillation and the midpoint of a burst for 39 simultaneous field and single or multiple unit recordings (bin size: π/10). Most cells exhibit bursts close to the negative peak of the main field oscillation although there is substantial group that fire in an anti-phase, or close to anti-phase, manner.
Figure 8. Phase shifting in single TC neurons.
A. Simultaneous field and single unit recording from the cat LGN slice in the presence of 125 μM trans-ACPD showing coherent activity at ~8 Hz. During the enlarged section shown in 1, the neuron exhibits bursts which initially occur in phase with the field oscillation (see red dotted lines). However, note the development of a small anti-phase field oscillation toward the end of this episode (see arrowheads) and the gradual phase shift in the firing of the neuron to become coherent with this anti-phase oscillation rather than the dominant field rhythm (blue dotted lines). During the enlarged episode in the centre (2), the neuron initially bursts in an anti-phase manner with the main field oscillation. However, toward the end of this episode, the neuron switches to in-phase firing. The enlarged episode on the right (3) shows a period where the firing of the neuron is consistently in phase with the negative peak of the main field oscillation. B. Discrete cross-correlogram between the negative peak of the field oscillation and the neuronal firing showing clear in-phase (red arrows) and anti-phase (blue arrows) peaks. To the right are field oscillation averages for in-phase (red trace, left) and anti-phase (blue trace, right) neuronal bursts (using the first action potential in the burst as a reference, indicated by the arrow). These show that the field oscillation is of a greater amplitude during periods when the neuron fires in phase, and exhibits additional, smaller anti-phase negative peaks (see arrow heads) when the neuron fires anti-phasically suggesting the presence of a competing field oscillation. (Reprinted from Hughes et al., 2004 with permission from Elsevier).
In a small quantity of recordings we have been able to directly observe the shifting of bursting neurons between the two populations described above. For example, Figure 9A shows a double unit recording where one of the neurons (neuron 1, larger amplitude unit) consistently fires in an anti-phase relationship with the field rhythm whereas the other neuron (neuron 2, smaller amplitude unit) randomly switches between an in-phase and anti-phase relationship. Four important points should be noted regarding this recording. First, when neuron 2 switches to an anti-phase relationship with the field oscillation, the amplitude of this oscillation is reduced. However, at the same time this neuron starts to fire synchronously with neuron 1. This means that the reduction in field oscillation amplitude is associated with an increase in neuronal synchrony in at least some of the local neuronal population that it reflects. Of course, this increase in synchrony is still evidently outweighed by the effects of a larger in-phase group of neurons. Nevertheless, it is not difficult to imagine a scenario where there are two neuronal assemblies of comparative size which fire with opposite phase to each other. This might lead to a very small or non-existent field oscillation even though a great deal of underlying neuronal synchrony would be present. Thus, we suggest that caution should be exercised when relating macroscopic reductions in the amplitude of thalamic, and possibly EEG, α and θ rhythms to an ‘across the board’ reduction in neuronal synchrony. We believe this point to be particularly salient given the increasing awareness that changes in EEG α activity may represent a variety of important cognitive functions (Başar et al., 1997a; Başar et al., 1997b; Başar et al., 1999; Klimesch, 1999; Pfurtscheller and Neuper, 1994; Pfurtscheller et al., 1997; Schurmann et al., 2000; Schürmann and Başar, 2001; Kalaycioglu and Nalcaci, 2001; Verstraeten and Cluydts, 2002; Doppelmayr et al., 2005). Second, at no point in this recording is the bursting of either neuron 1 or 2 suppressed. Therefore, the waxing and waning of the field oscillation appears to be solely related to phase shifting and not changes in the activity of individual neurons. Third, when the two neurons in Figure 9A switch from an anti-phase to in-phase relationship with each other a burst doublet is always generated by neuron 1 (i.e. two bursts in quick succession, the second of which becomes re-entrained with the activity of neuron 2) (Fig. 9A3). This suggests that at this point there is a dominance of the intrinsic dynamics of neuron 2 over neuron 1 and also indicates that the two cells are somehow interacting directly with each other. Finally, phase-shifting is disrupted by the putative GJ blocker, CBX, which is further evidence that GJs play a central role in coordinating in vitro α and θ rhythms (Fig. 9B).
GJ coupling explains both the phase-locking and phase shifting phenomena
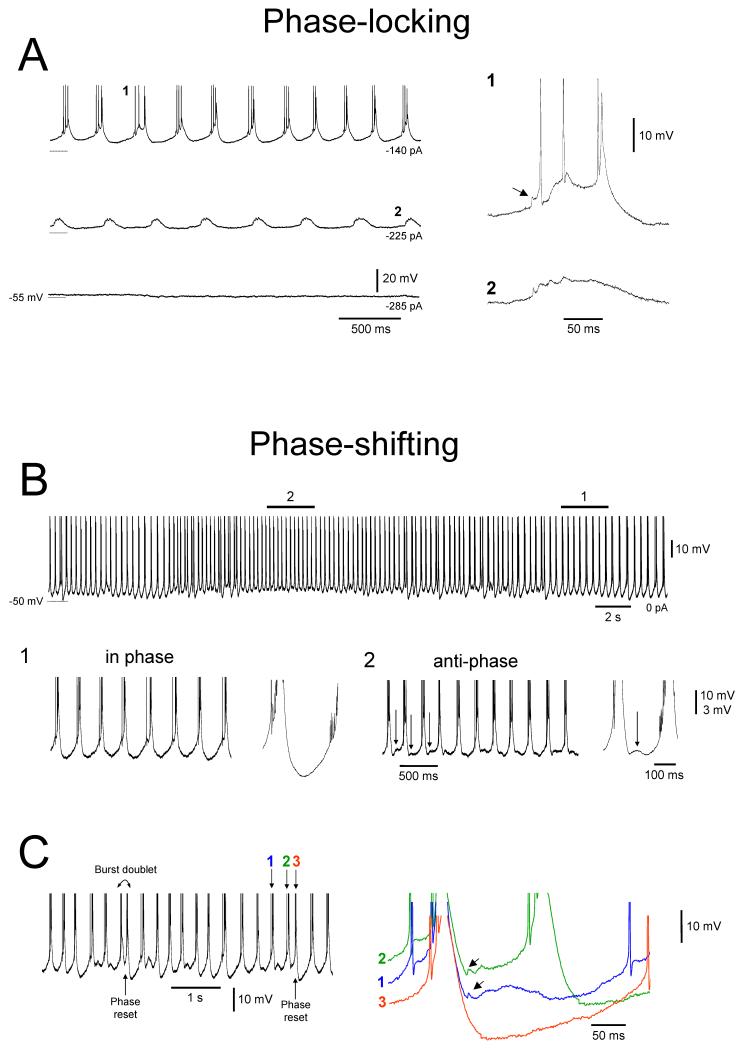
How do HT bursting and GJ coupling generate anti-phase firing and phase shifting? In order to answer this question it is necessary to examine more closely the way in which HT bursts and burstlets interact. For certain levels of membrane polarization, burstlets reliably entrain HT bursts leading to stable synchrony between the two types of event (Fig. 10A; see also Fig. 6B1) and providing a clear cellular substrate for the neuronal synchrony observed during extracellular recordings (Fig. 5A). However, when the level of depolarization is slightly increased, this situation can change into one where burstlets and HT bursts spontaneously alternate between an in-phase and anti-phase relationship (Fig. 10B), thus mirroring that which sometimes occurs in extracellular double unit recordings (Fig. 9A). Furthermore, in the same way that phase-resetting takes place between extracellularly recorded units during α/θ oscillations (Fig. 9A3), a phase reset from an anti-phase to in-phase relationship between burstlets and HT bursts is often marked by a burst doublet (i.e. two bursts in quick succession, the second of which becomes re-entrained with burstlet activity) (Fig. 10C). Again, this indicates a dominance at this point of the intrinsic dynamics of the neuron from which the burstlets originate.
Figure 10. Cellular mechanisms underlying phase-locking and phase shifting.
A. Intracellular recording of the activity of an LGN TC neuron exhibiting burstlets at various levels of injected d.c. current in the presence of 100 μM trans-ACPD. Rhythmic burstlets are only evident in this neuron for sufficient levels of depolarization and can occur in isolation (middle trace on the left) or in conjunction with locally generated HT bursts (top trace on the left). The events marked 1 and 2 in the top and midde traces, respectively, are expanded on the right. Note the clear interaction of burstlets (see first constituent spikelet highlighted by the arrow) and HT bursts in 1. B. Activity of the neuron depicted in A over a longer period of time and for a greater value of injected d.c current. The sections marked 1 and 2 are expanded below. In 1, the interval between rhythmic HT bursts is smooth because HT bursts and burstlets are in phase (as in the top trace in A). Consequently, the averaged interburst interval shown on the right also exhibits a smooth waveform. In 2, the interval between consecutive HT bursts is disrupted by small depolarizing potentials (see arrows) which is due to an anti-phase relationship between HT bursts and burstlets. This can be clearly appreciated in the averaged interburst interval shown on the right which possesses an anti-phase depolarization between the HT bursts (see arrow). C. Examples of phase resetting between HT bursts and burstlets from the neuron depicted in A and B. Note how a phase reset (from an anti-phase to in-phase relationship) is accompanied by a burst doublet (cf. Fig. 9A3). The bursts marked 1, 2 and 3 are enlarged on the right. Following burst 1 an out-of-phase burstlet is clearly present (note the spikelets indicated by the arrows). Following burst 2, the out-of-phase burstlet triggers another HT-burst and resets the phase relationship between the two events such that subsequent HT bursts (3) are now in phase with the burstlets. Note how the shift to an anti-phase relationship appears to occur through the two events seeming to simply ‘drift’ out of phase. (A and B modified from Hughes et al., 2004 with permission from Elsevier).
In theoretical studies, the presence of persistent anti-phase bursting in pairs of GJ-coupled cells has often been attributed to weak coupling (Sherman and Rinzel, 1992; Sherman, 1994; Schweighofer et al., 1999; Bem and Rinzel, 2004). This probably explains the presence of neurons which constantly fire out of phase with the main field oscillation (Figs. 7 and 11). Indeed, application of CBX (which presumably suppresses GJ function via a decrease in coupling strength; Davidson and Baumgarten, 1988) can transform pairs of phase-shifting neurons into pairs which fire in a persistent anti-phase manner (Fig. 9B). However, weak coupling is clearly not responsible for phase-shifting pairs because neurons involved in this activity display burstlets of considerable amplitude (commensurate with strong GJ coupling) (Fig. 10A). Rather, we suggest that phase shifting arises as a result of the competition between the robust but distinct intrinsic dynamics of strongly coupled cells, i.e. due to a dynamic ‘mismatch’ or pronounced heterogeneity between two reciprocally connected neurons (See Figs. 9A, 10B and 10C) (Kawato et al., 1979; Bem and Rinzel, 2004). Additionally, it is likely that a dendritic location of GJs on HT bursting TC neurons, which is often indicated by the patterns of dye-coupling observed between these cells (Fig. 6B2 and 6B3), would also greatly affect the dynamics of coupled neuronal pairs (Komendantov and Canavier, 2002).
Figure 11. Proposed network architecture underlying thalamic α and θ rhythms.
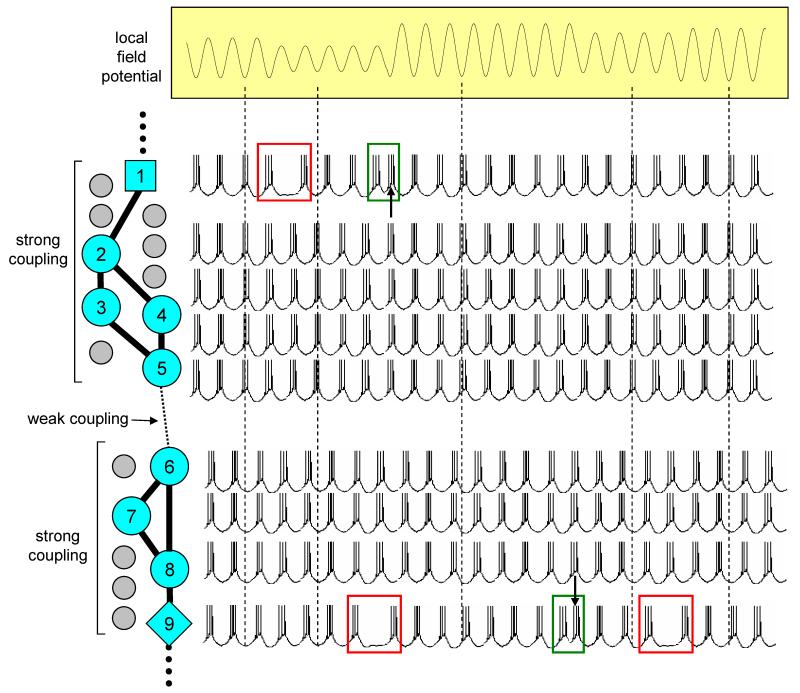
The amplitude of thalamic α and θ rhythms is proposed to be determined by the destructive interference of competing, anti-phase groups of continuously bursting TC neurons which are sparsely connected by GJs. The salient aspects of this proposed scheme are as follows: i) HT bursting TC neurons (indicated in blue) are a subset of TC neurons comprising around ~25% of the total population and which are interspersed amongst conventional TC neurons (indicated in grey), ii) the majority of these HT bursting neurons are coupled by strong GJ connections (thick continuous lines) and form small, tightly correlated groups (e.g. neurons 2-5 and neurons 6-8), iii) such groups can be linked by a single weak GJ connection (i.e. thin dotted line between neurons 5 and 6) causing the bursting of these two groups to be consistently anti-phase to each other (Sherman and Rinzel, 1992; Sherman, 1994; Schweighofer et al., 1999; Bem and Rinzel, 2004), iv) at other points in the network, however, these groups can be linked by strong GJ connections (i.e between neurons 2 and 1 and subsequent cells, and between 8 and 9 and subsequent cells) which act as network ‘pivot points’ and which can facilitate the dynamic phase switching of large groups of neurons. These connections are proposed to occur between dynamically heterogeneous cells as indicated by the different shapes (see text). The overall result of this architecture is that there is a constant swapping of neurons between two populations which essentially burst in an anti-phase relationship to each other with this being dynamically reflected in the amplitude of the field oscillation (see the vertical dotted lines and the way in which the depicted field oscillation is dependent on the proportion of neurons which fire in and out of phase at any one time). The green and red boxes highlight occasions where pairs of TC neurons undergo a phase reset or a ‘drifting out of phase’, respectively (cf. Figs. 9A3 and 10C).
Summary and concluding remarks
In this paper we have discussed the cellular mechanisms underlying a continuum of α and θ rhythms in the cat LGN in vitro. Specifically, we have described how these rhythms are dependent on a novel form of rhythmic bursting in a subset of TC neurons (HT bursting) and the interconnection of these neurons by GJs. Based on our experimental data we propose that the GJ coupled sub-network of HT bursting TC neurons is organized according to the following principles (Fig. 11), i) GJ connections are sparse leading to ‘chains’ of small tightly connected groups rather than a large densely interconnected population of cells, ii) the majority of GJ connections are strong and allow the effective transmission of bursting between neurons. However, a small amount of GJ connections are weak leading to anti-phase firing between the cells that they connect. If such a connection joins two small tightly connected groups it can lead to anti-phase firing between these groups, iii) if the intrinsic dynamics of two cells coupled by a strong GJ connection are sufficiently distinct, phase-shifting can occur between these cells. Again, if such a connection joins two small tightly connected groups, it can lead to phase switching between these groups. The proposed cellular architecture underlying thalamic α and θ rhythms is schematically illustrated in Fig. 11.
Since HT bursting is extremely similar to the bursting present in TC neurons during α and θ rhythms in vivo, we suggest that in vitro α and θ rhythms may be directly related to α and θ rhythms in the whole brain. Were this to be the case, of particular interest is the demonstration that the amplitude of in vitro α and θ rhythms is largely determined by the extent of destructive interference between spatially overlapping, competing anti-phase populations (Fig. 11). Since neurons are able to dynamically shift between these competing populations a situation can arise whereby an increase in the number of neurons participating in the smaller of these populations will lead to a reduction in field oscillation amplitude and vice versa (Fig. 11). This means that the characteristic waxing and waning of gross thalamic α and θ rhythms cannot be assumed to reflect a wholesale increase and reduction, respectively, in underlying neuronal synchrony. In the light of this, we suggest that changes in EEG α and θ rhythms that occur in response to various sensory or cognitive tasks (Başar et al., 1997a; Başar et al., 1997b; Başar et al., 1999; Pfurtscheller and Neuper, 1994; Pfurtscheller et al., 1997; Schürmann and Başar, 2001; Kalaycioglu and Nalcaci, 2001; Verstraeten and Cluydts, 2002; Doppelmayr et al., 2005), and which are believed to involve thalamic circuits (Klimesch, 1999; Schürmann et al., 2000), should be cautiously related to changes in underlying network synchrony.
Acknowledgements
We wish to thank Dr. D.W. Cope for useful discussions on this paper. Our ongoing work on thalamic oscillations is supported by the Wellcome Trust (grants 71436, 78403 and 78311). Additional information regarding this and other published work from the Crunelli lab is available at http://www.thalamus.org.uk.
REFERENCES
- Adrian ED, Matthews BH. The Berger Rhythm: potential changes from the occipital lobes of man. Brain. 1934;57:355–385. [Google Scholar]
- Başar E, Başar-Eroğlu C, Karakas S, Schurmann M. Are cognitive processes manifested in event-related gamma, alpha, theta and delta oscillations in the EEG? Neurosci. Lett. 1999;259:165–168. doi: 10.1016/s0304-3940(98)00934-3. [DOI] [PubMed] [Google Scholar]
- Başar E, Schurmann M, Başar-Eroğlu C, Karakas S. Alpha oscillations in brain functioning: an integrative theory. Int. J. Psychophysiol. 1997a;26:5–29. doi: 10.1016/s0167-8760(97)00753-8. [DOI] [PubMed] [Google Scholar]
- Başar E, Yordanova J, Kolev V, Başar-Eroğlu C. Is the alpha rhythm a control parameter for brain responses? Biol. Cybern. 1997b;76:471–480. doi: 10.1007/s004220050360. [DOI] [PubMed] [Google Scholar]
- Bem T, Rinzel J. Short duty cycle destabilizes a half-center oscillator, but gap junctions can restabilize the anti-phase pattern. J. Neurophysiol. 2004;91:693–703. doi: 10.1152/jn.00783.2003. [DOI] [PubMed] [Google Scholar]
- Berger H. Über das Elektroenkephalogramm des Menschen. Arch. Psychiatry. 1933;99:554–574. [Google Scholar]
- Berger H. Über das Elektroenkephalogramm des Menschen. Arch. Psychiatry. 1936;104:678–689. [Google Scholar]
- Bouyer JJ, Rougeul A, Buser P. Somatosensory rhythms in the awake cat: a single unit exploration of their thalamic concomitant in nucleus ventralis posterior and vicinity. Arch. Ital. Biol. 1982;120:95–110. [PubMed] [Google Scholar]
- Bouyer JJ, Tilquin C, Rougeul A. Thalamic rhythms in cat during quiet wakefulness and immobility. Electroencephalogr. Clin. Neurophysiol. 1983;55:180–187. doi: 10.1016/0013-4694(83)90186-4. [DOI] [PubMed] [Google Scholar]
- Chatila M, Milleret C, Buser P, Rougeul A. A 10 Hz “alpha-like” rhythm in the visual cortex of the waking cat. Electroencephalogr Clin. Neurophysiol. 1992;83:217–222. doi: 10.1016/0013-4694(92)90147-a. [DOI] [PubMed] [Google Scholar]
- Chatila M, Milleret C, Rougeul A, Buser P. Alpha rhythm in the cat thalamus. C. R. Acad. Sci. III. 1993;316:51–58. [PubMed] [Google Scholar]
- Crunelli V, Cope DW, Hughes SW. Thalamic T-type Ca2+ channels and NREM sleep. Cell Calcium. 2006 doi: 10.1016/j.ceca.2006.04.022. in press. [DOI] [PMC free article] [PubMed] [Google Scholar]
- Davidson JS, Baumgarten IM. Glycyrrhetinic acid derivatives: a novel class of inhibitors of gap-junctional intercellular communication. Structure-activity relationships. J. Pharmacol. Exp. Ther. 1988;246:1104–1107. [PubMed] [Google Scholar]
- De Gennaro L, Ferrara M, Bertini M. The boundary between wakefulness and sleep: quantitative electroencephalographic changes during the sleep onset period. Neuroscience. 2001;107:1–11. doi: 10.1016/s0306-4522(01)00309-8. [DOI] [PubMed] [Google Scholar]
- Domich L, Oakson G, Steriade M. Thalamic burst patterns in the naturally sleeping cat: a comparison between cortically projecting and reticularis neurones. J. Physiol. (London) 1986;379:429–449. doi: 10.1113/jphysiol.1986.sp016262. [DOI] [PMC free article] [PubMed] [Google Scholar]
- Doppelmayr M, Klimesch W, Hodlmoser K, Sauseng P, Gruber W. Intelligence related upper alpha desynchronization in a semantic memory task. Brain Res. Bull. 2005;66:171–177. doi: 10.1016/j.brainresbull.2005.04.007. [DOI] [PubMed] [Google Scholar]
- Galarreta M, Hestrin S. A network of fast-spiking cells in the neocortex connected by electrical synapses. Nature. 1999;402:72–75. doi: 10.1038/47029. [DOI] [PubMed] [Google Scholar]
- Gibson JR, Beierlein M, Connors BW. Functional properties of electrical synapses between inhibitory interneurons of neocortical layer 4. J. Neurophysiol. 2005;93:467–480. doi: 10.1152/jn.00520.2004. [DOI] [PubMed] [Google Scholar]
- Goncalves SI, de Munck JC, Pouwels PJ, Schoonhoven R, Kuijer JP, Maurits NM, Hoogduin JM, Van Someren EJ, Heethaar RM, Lopes da Silva FH. Correlating the alpha rhythm to BOLD using simultaneous EEG/fMRI: Inter-subject variability. Neuroimage. 2006;30:203–213. doi: 10.1016/j.neuroimage.2005.09.062. [DOI] [PubMed] [Google Scholar]
- Hughes SW, Blethyn KL, Cope DW, Crunelli V. Properties and origin of spikelets in thalamocortical neurones in vitro. Neuroscience. 2002a;110:395–401. doi: 10.1016/s0306-4522(01)00577-2. [DOI] [PubMed] [Google Scholar]
- Hughes SW, Cope DW, Blethyn KL, Crunelli V. Cellular mechanisms of the slow (<1 Hz) oscillation in thalamocortical neurons in vitro. Neuron. 2002b;33:947–958. doi: 10.1016/s0896-6273(02)00623-2. [DOI] [PubMed] [Google Scholar]
- Hughes SW, Crunelli V. Thalamic mechanisms of EEG alpha rhythms and their pathological implications. Neuroscientist. 2005;11:357–372. doi: 10.1177/1073858405277450. [DOI] [PubMed] [Google Scholar]
- Hughes SW, Lörincz M, Cope DW, Blethyn KL, Kekesi KA, Parri HR, Juhász G, Crunelli V. Synchronized oscillations at alpha and theta frequencies in the lateral geniculate nucleus. Neuron. 2004;42:253–268. doi: 10.1016/s0896-6273(04)00191-6. [DOI] [PubMed] [Google Scholar]
- Isaichev SA, Derevyankin VT, Koptelov Yu M, Sokolov EN. Rhythmic alpha-activity generators in the human EEG. Neurosci. Behav. Physiol. 2001;31:49–53. doi: 10.1023/a:1026622229972. [DOI] [PubMed] [Google Scholar]
- Jasper HH, Andrews HL. Electroencephalography III. Normal differentiation of occipital and precentral regions in man. Arch. Neurol. Psychiatry. 1938;39:96–115. [Google Scholar]
- Kalaycioglu C, Nalcaci E. Accordance between EEG alpha power and dual task performance for different visual cognitive tasks. Int. J. Neurosci. 2001;109:227–244. doi: 10.3109/00207450108986535. [DOI] [PubMed] [Google Scholar]
- Kawato M, Sokabe M, Suzuki R. Synergism and antagonism of neurons caused by an electrical synapse. Biol. Cybern. 1979;34:81–89. doi: 10.1007/BF00365472. [DOI] [PubMed] [Google Scholar]
- Klimesch W. EEG alpha and theta oscillations reflect cognitive and memory performance: a review and analysis. Brain Res. Brain Res. Rev. 1999;29:169–195. doi: 10.1016/s0165-0173(98)00056-3. [DOI] [PubMed] [Google Scholar]
- Komendantov AO, Canavier CC. Electrical coupling between model midbrain dopamine neurons: effects on firing pattern and synchrony. J. Neurophysiol. 2002;87:1526–1541. doi: 10.1152/jn.00255.2001. [DOI] [PubMed] [Google Scholar]
- Lieberman AR, Spacek J. Filamentous contacts: the ultrastructure and three-dimensional organization of specialized non-synaptic interneuronal appositions in thalamic relay nuclei. Cell Tissue Res. 1997;288:43–57. doi: 10.1007/s004410050791. [DOI] [PubMed] [Google Scholar]
- Llinás RR, Ribary U, Jeanmonod D, Kronberg E, Mitra PP. Thalamocortical dysrhythmia: A neurological and neuropsychiatric syndrome characterized by magnetoencephalography. Proc. Natl. Acad. Sci. U.S.A. 1999;96:15222–15227. doi: 10.1073/pnas.96.26.15222. [DOI] [PMC free article] [PubMed] [Google Scholar]
- Logan SD, Pickering AE, Gibson IC, Nolan MF, Spanswick D. Electrotonic coupling between rat sympathetic preganglionic neurones in vitro. J. Physiol. (London) 1996;495:491–502. doi: 10.1113/jphysiol.1996.sp021609. [DOI] [PMC free article] [PubMed] [Google Scholar]
- Long MA, Landisman CE, Connors BW. Small clusters of electrically coupled neurons generate synchronous rhythms in the thalamic reticular nucleus. J. Neurosci. 2004;24:341–349. doi: 10.1523/JNEUROSCI.3358-03.2004. [DOI] [PMC free article] [PubMed] [Google Scholar]
- Lopes da Silva FH, van Lierop TH, Schrijer CF, van Leeuwen WS. Organization of thalamic and cortical alpha rhythms: spectra and coherences. Electroencephalogr. Clin. Neurophysiol. 1973;35:627–639. doi: 10.1016/0013-4694(73)90216-2. [DOI] [PubMed] [Google Scholar]
- Lopes da Silva FH, Vos JE, Mooibroek J, Van RA. Relative contributions of intracortical and thalamo-cortical processes in the generation of alpha rhythms, revealed by partial coherence analysis. Electroencephalogr. Clin. Neurophysiol. 1980;50:449–456. doi: 10.1016/0013-4694(80)90011-5. [DOI] [PubMed] [Google Scholar]
- McCormick DA. Neurotransmitter actions in the thalamus and cerebral cortex and their role in neuromodulation of thalamocortical activity. Prog. Neurobiol. 1992;39:337–388. doi: 10.1016/0301-0082(92)90012-4. [DOI] [PubMed] [Google Scholar]
- Niedermeyer E. Alpha rhythms as physiological and abnormal phenomena. Int. J. Psychophysiol. 1997;26:31–49. doi: 10.1016/s0167-8760(97)00754-x. [DOI] [PubMed] [Google Scholar]
- Niedermeyer E. Sleep and EEG. In: Lopes da Silva FH, editor. Electroencephalography: Basic Principles, clinical applications, and related fields. Williams and Wilkins; Baltimore: 1993a. pp. 153–191. [Google Scholar]
- Niedermeyer E. The normal EEG of the waking adult. In: Lopes da Silva FH, editor. Electroencephalography: Basic Principles, clinical applications, and related fields. Williams and Wilkins; Baltimore: 1993b. pp. 97–117. [Google Scholar]
- Pfurtscheller G, Neuper C. Event-related synchronization of mu rhythm in the EEG over the cortical hand area in man. Neurosci. Lett. 1994;174:93–96. doi: 10.1016/0304-3940(94)90127-9. [DOI] [PubMed] [Google Scholar]
- Pfurtscheller G, Neuper C, Andrew C, Edlinger G. Foot and hand area mu rhythms. Int. J. Psychophysiol. 1997;26:121–135. doi: 10.1016/s0167-8760(97)00760-5. [DOI] [PubMed] [Google Scholar]
- Rougeul-Buser A, Buser P. Rhythms in the alpha band in cats and their behavioural correlates. Int. J. Psychophysiol. 1997;26:191–203. doi: 10.1016/s0167-8760(97)00764-2. [DOI] [PubMed] [Google Scholar]
- Sarnthein J, Morel A, von SA, Jeanmonod D. Thalamic theta field potentials and EEG: high thalamocortical coherence in patients with neurogenic pain, epilepsy and movement disorders. Thalamus and Related Systems. 2003;2:231–238. [Google Scholar]
- Sarnthein J, Morel A, von SA, Jeanmonod D. Thalamocortical theta coherence in neurological patients at rest and during a working memory task. Int. J. Psychophysiol. 2005;57:87–96. doi: 10.1016/j.ijpsycho.2005.03.015. [DOI] [PubMed] [Google Scholar]
- Schürmann M, Başar E. Functional aspects of alpha oscillations in the EEG. Int. J. Psychophysiol. 2001;39:151–158. doi: 10.1016/s0167-8760(00)00138-0. [DOI] [PubMed] [Google Scholar]
- Schürmann M, Demiralp T, Başar E, Başar EC. Electroencephalogram alpha (8-15 Hz) responses to visual stimuli in cat cortex, thalamus, and hippocampus: a distributed alpha network? Neurosci. Lett. 2000;292:175–178. doi: 10.1016/s0304-3940(00)01456-7. [DOI] [PubMed] [Google Scholar]
- Schweighofer N, Doya K, Kawato M. Electrophysiological properties of inferior olive neurons: A compartmental model. J. Neurophysiol. 1999;82:804–817. doi: 10.1152/jn.1999.82.2.804. [DOI] [PubMed] [Google Scholar]
- Sherman A. Anti-phase, asymmetric and aperiodic oscillations in excitable cells--I. Coupled bursters. Bull. Math. Biol. 1994;56:811–835. doi: 10.1007/BF02458269. [DOI] [PubMed] [Google Scholar]
- Sherman A, Rinzel J. Rhythmogenic effects of weak electrotonic coupling in neuronal models. Proc. Natl. Acad. Sci. U.S.A. 1992;89:2471–2474. doi: 10.1073/pnas.89.6.2471. [DOI] [PMC free article] [PubMed] [Google Scholar]
- Soininen H, Reinikainen K, Partanen J, Mervaala E, Paljärvi L, Helkala EL, Riekkinen P., Sr. Slowing of the dominant occipital rhythm in electroencephalogram is associated with low concentration of noradrenaline in the thalamus in patients with Alzheimer’s disease. Neurosci. Lett. 1992a;137:5–8. doi: 10.1016/0304-3940(92)90285-f. [DOI] [PubMed] [Google Scholar]
- Soininen H, Reinikainen KJ, Partanen J, Helkala EL, Paljärvi L, Riekkinen PJ. Slowing of electroencephalogram and choline acetyltransferase activity in post mortem frontal cortex in definite Alzheimer’s disease. Neuroscience. 1992b;49:529–535. doi: 10.1016/0306-4522(92)90223-o. [DOI] [PubMed] [Google Scholar]
- Steriade M, Dossi RC, Pare D, Oakson G. Fast oscillations (20-40 Hz) in thalamocortical systems and their potentiation by mesopontine cholinergic nuclei in the cat. Proc. Natl. Acad. Sci. U.S.A. 1991;88:4396–400. doi: 10.1073/pnas.88.10.4396. [DOI] [PMC free article] [PubMed] [Google Scholar]
- Venance L, Rozov A, Blatow M, Burnashev N, Feldmeyer D, Monyer H. Connexin expression in electrically coupled postnatal rat brain neurons. Proc. Natl. Acad. Sci. U.S.A. 2000;97:10260–10265. doi: 10.1073/pnas.160037097. [DOI] [PMC free article] [PubMed] [Google Scholar]
- Verstraeten E, Cluydts R. Attentional switching-related human EEG alpha oscillations. Neuroreport. 2002;13:681–684. doi: 10.1097/00001756-200204160-00029. [DOI] [PubMed] [Google Scholar]


