

Abstract
High atomic number (Z) materials such as gold preferentially absorb kilovoltage x-rays compared to soft tissue and may be used to achieve local dose enhancement in tumours during treatment with ionizing radiation. Gold nanoparticles have been demonstrated as radiation dose enhancing agents in vivo and in vitro. In the present study, we used multiple endpoints to characterize the cellular cytotoxic response of a range of cell lines to 1.9 nm gold particles and measured dose modifying effects following transient exposure at low concentrations. Gold nanoparticles caused significant levels of cell type specific cytotoxicity, apoptosis and increased oxidative stress. When used as dose modifying agents, dose enhancement factors varied between the cell lines investigated with the highest enhancement being 1.9 in AGO-1522B cells at a nanoparticle concentration of 100 μg ml−1. This study shows exposure to 1.9 nm gold particles to induce a range of cell line specific responses including decreased clonogenic survival, increased apoptosis and induction of DNA damage which may be mediated through the production of reactive oxygen species. This is the first study involving 1.9 nm nanometre sized particles to report multiple cellular responses which impact on the radiation dose modifying effect. The findings highlight the need for extensive characterization of responses to gold nanoparticles when assessing dose enhancing potential in cancer therapy.
1. Introduction
The use of nanomaterials is becoming increasingly common in the biomedical field for a range of applications including imaging, drug and gene delivery [1] and as agents for the detection and treatment of cancer [2-4]. A variety of different cancer therapeutic strategies have focused on the use of gold nanoparticles including the targeted delivery of anti-cancer agents including methotrexate [5] tamoxifen [6] and oxaliplatin [7], radio frequency radiation [8], thermal ablation [9, 10] and metal enhanced radiotherapy [11].
As a therapeutic strategy for the treatment of cancer using ionizing radiation, metal enhanced radiotherapy utilizes the ability of high atomic number (Z) materials such as gold to preferentially increase photoelectric absorption of low kilovoltage x-rays compared to soft tissue causing enhanced radiation dose deposition at the interface of surrounding tissue. This effect has been observed clinically in patients with reconstructive metal implants receiving radiotherapy for mandibular [12] and head and neck cancer [13, 14]. Theoretical simulations have shown gold (Z = 79) compounds as ideal radiation enhancing agents [15-17]. Several experimental attempts have been made to exploit the radiation enhancing properties of gold for therapeutic benefit using gold foils [18, 19] and microparticles [20].
Gold nanoparticles have been shown as potential radiation enhancing agents for the treatment of cancer [21-25]. This was first demonstrated by Hainfeld et al [21] who obtained dose enhancement ratios of at least 2, but potentially as high as 6 using 1.9 nm particles at a gold concentration of 7 mg g−1 when administered by intravenous injection to tumour-bearing mice irradiated with 250 kVp x-rays. These finding were validated by Cho et al [16] using Monte Carlo calculations to estimate tumour dose enhancement to be greater than 2 at a similar concentration of gold nanoparticles to those used in the Hainfeld study and greater than 5 at a concentration of 3% gold when irradiated with 140 kVp x-rays.
Using the same size of particle, Rahman et al [24] demonstrated a peak radiation enhancement factor of 25 fold for kilovoltage x-rays at a 1 mM nanoparticle concentration in bovine endothelial cells irradiated with kilovoltage x-rays or megavoltage electrons. The effect of different sized nanoparticles (14–74 nm) was recently shown [25] with 50 nm particles showing the highest enhancement factor of 1.66 when irradiated with 6 MVp photons.
Using plasmid DNA as a model system, reports from our laboratory [26] and from others [27, 28] have shown gold nanoparticles to enhance radiation damage yield by factors greater 2 using kilovoltage x-rays and low energy electrons. In addition to dose enhancing potential, it is becoming clear that nanoparticles are capable of inducing a range of cell specific responses depending on particle size [29], shape [30] and surface functionalization [31, 32].
The aim of the present study was to investigate the response of a range of cells to 1.9 nm gold particles and to assess dose modifying potential. We present evidence for acute cytotoxicity and apoptosis mediated by oxidative stress. Dose modifying factors up to a maximum of 1.97 are reported for cells irradiated with 160 kVp x-rays. These studies provide further evidence for the potential of gold nanoparticles in cancer therapy and highlight the need for extensive characterization of cellular response.
2. Method and materials
2.1. Cell culture
All cell lines were obtained from Cancer Research UK, excluding primary astrocytes, which were purchased from TCS Cell Works (UK). Human prostate cancer cells, DU-145 and PC-3 were grown in RPMI-1640 medium with 10% foetal bovine serum, 1% penicillin/streptomycin. Human breast cancer cell lines, MDA-231-B and MCF-7 were grown in Dulbecco’s modified Eagle’s medium (DMEM) with 10% foetal bovine serum and 1% penicillin/streptomycin. Human alveolar epithelial cells (L-132) and human glioblastoma cells (T98G) were grown in Eagle’s minimum essential medium with 10% foetal bovine serum and 1% penicillin/streptomycin. Human primary astrocytes were grown in astrocyte growth medium with supplements (Lonza, UK). Human primary fibroblast cells (AGO-1522B) were grown in Eagle’s minimum essential medium (+deoxyribonucleosides and deoxyribonucleotides) with 20% foetal bovine serum and 100 μg ml−1 streptomycin (GIBCO-BRL). All cells were maintained at 37 °C in a humidified atmosphere of 95% air/5% CO2.
2.2. Gold nanoparticles and irradiation setup
1.9 nm Aurovist gold nanoparticles were purchased from Nanoprobes Inc. (Yaphank, NY). Particles were suspended in culture medium, aliquoted and stored at −20 °C until required. Cells were irradiated with 160 kVp x-rays at dose rate of 0.625 Gy min−1 using a Faxitron CP-160 x-ray generator. Culture vessels were returned to the incubator immediately after irradiation.
2.3. Clonogenic assay
Subconfluent cells were removed from flasks by incubating in a 1:1 solution of 0.25% trypsin and 1 mM EDTA. Following detachment, cells were centrifuged and resuspended in fresh culture media before counting using a Coulter counter set at a threshold calibrated for the cell line using a haemocytometer. Appropriate cell numbers were plated for survival analysis using the clonogenic assay technique of Puck and Marcus [33]. Culture medium was removed and replaced with nanoparticle-containing medium prior to irradiation. Immediately following irradiation, gold nanoparticle-containing medium was removed and replaced with fresh culture medium. Cell cultures were incubated for 10–14 days at 37 °C in 5% CO2 in air and 95% humidity before staining with crystal violet. Colonies exceeding 50 cells were scored as representing surviving cells.
2.4. Dynamic cell proliferation assay
For each cell type, 7000 cells/well were seeded into 100 μl of complete culture medium in a 96 well microtiter E-Plate (Roche, UK). Following addition of cells the plate was inserted into the xCelligence System and monitored every 15 min for 28 h. Cell sensor impedance was expressed as an arbitrary unit called cell index. The cell index at each time point is the relative change in measured electrical impedance defined as (Rn − Rb)/15, where Rn is the cell–electrode impedance of the well containing cells and Rb is the background impedance of the well containing medium alone. ANOVA was used to determine statistical significance.
2.5. Cell cycle analysis by flow cytometry
Cells were seed into 6 well plates and allowed to adhere overnight before incubating with gold nanoparticles. Samples were collected by incubating in a 1:1 solution of 0.25% trypsin and 1 mM EDTA. Following detachment, cells were centrifuged, washed in PBS and fixed in chilled 70% ethanol at 4 °C for 60 min. After fixation cells were washed and resuspended in PBS containing 50 μg ml of propidium iodide and 10 μg ml RNase and incubated at 37 °C for 30 min. Samples were analysed using a FACSCalibur flow cytometer and CELL-Quest software (Becton-Dickson, UK). 10 000 cells were analysed sample, values are expressed ±SEM. Statistical significance was determined using a t-test.
2.6. Measurement of oxidative stress by flow cytometry
Cells were seeded into 6 well plates and allowed to adhere overnight before incubating with gold nanoparticles. Nanoparticle-containing medium was removed and replaced with serum-free medium containing 5 μM 2DCFDA (5-6-chloromethyl-2′7′-dichlorodihydrofluorescein diacetate acetyl ester) (Molecular Probes, Invitrogen). Cells were incubated at 37 °C for 30 min, washed with PBS and detached using cell dissociation buffer (Sigma, UK). Samples were analysed using a FACSCalibur flow cytometer and CELL-Quest software (Becton-Dickson, UK). 10 000 cells were analysed per sample; values are expressed as means ±SEM. Statistical significance was determined using a t-test.
2.7. DNA damage analysis by immunostaining for γH2AX and 53BP1
Immunostaining was performed for the DNA damage markers γH2AX and 53BP1. Cells were seeded on to coverslips in 6 well culture plates and allowed to adhere overnight. Cells were then incubated with gold nanoparticle-containing culture medium at 10 or 100 μg ml−1 for 1 or 24 h. Cells were fixed in methanol/acetone (1:1), permeabilized in 0.1% solution of Triton X-100 in PBS (Sigma, UK) and incubated with a mouse monoclonal primary antibody for Ser 139 phosphorylation of H2AX (Millipore, UK, 1 in 10 000) or rabbit monoclonal antibody for 53BP1 (Novus Biologicals, UK, 1 in 2000). A positive control for induction of γH2AX and 53BP1 foci was included using cells exposed to 1 Gy of x-rays and fixed after 30 min. γH2AX and 53BP1 foci were detected using Alexa Fluor 488 and 568 secondary antibodies respectively (Molecular Probes, UK). Cells were counterstained with 4,6-diamidino-2-phenylindole (DAPI) containing mounting medium for fluorescent microscopy (Vectorshield, UK). Cells were imaged using a Zeiss Axiovert 200M fluorescent microscope. Statistical significance was determined using a t-test.
2.8. Statistical analysis and data fitting
Statistical analysis was conducted using Prism version 5.01 (Graphpad Software Inc.) with a significance level of 0.05 used. Radiation dose response curves were fitted using the nonlinear regression function in Mathematica version 6 (Wolfram Scientific).
3. Results
3.1. Time dependent response to nanoparticles
A time course experiment was conducted to determine the effect of gold nanoparticles on cell survival in the absence of radiation and determine the optimum incubation period with nanoparticles prior to irradiation. Figure 1 shows the effect of 100 μg ml−1 nanoparticles, 4 Gy X-irradiation or the combination of gold nanoparticles with 4 Gy X-irradiation on the clonogenic survival of MDA-231-MB cells for incubation periods of up to 8 h. In the absence of X-irradiation, 100 μg ml−1 of nanoparticles caused a variable response within the first 2 h, which dropped to a plateau level around 80% after 4 h. Cells exposed to a single radiation dose of 4 Gy had an average surviving fraction of 0.52 (±0.21) for time points after 1 h, in line with previous radiation dose response data obtained within our laboratory for this cell line. Combination of 100 μg ml−1 nanoparticles with 4 Gy x-rays decreased the surviving fraction of cells significantly to 0.323 (±0.02) when irradiated 1 h after addition of gold nanoparticles. Thus, all further studies were performed by incubating cells with gold nanoparticles 1 h prior to irradiation.
Figure 1.
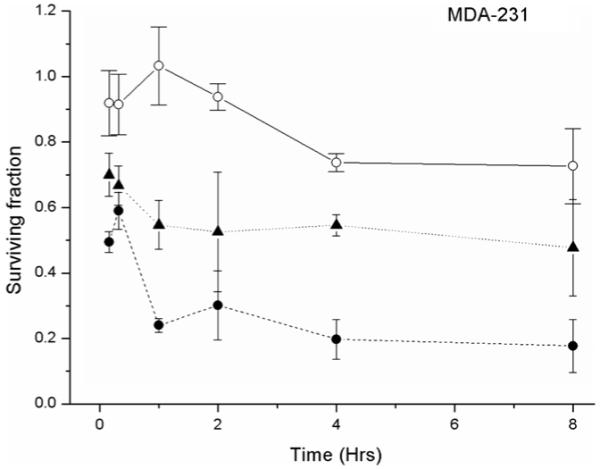
Time dependent response of MDA-231-MB to gold nanoparticles MDA-231-MB cells were exposed to 1.9 nm gold particles or normal medium for periods from 15 min to 8 h then irradiated with 4 Gy or sham irradiated. Symbols represent: nanoparticle control (○ solid line); 4 Gy x-ray irradiation (▲ dotted line); gold nanoparticles in combination with 4 Gy x-ray irradiation (● dashed line). Surviving fractions were normalized to untreated control cells in each of the experiments. Data points show the mean of at least three independent experiments ± SEM.
3.2. Cytotoxicity and proliferative response
The effect of a 1 h exposure to gold nanoparticles at concentrations of 10 and 100 μg ml−1 was measured by clonogenic assay and is shown in figure 2. DU-145 cells showed the highest levels of cytotoxicity at concentrations of both 10 and 100 μg ml−1 compared to MDA-231-MB cells, which showed relatively low levels of cytotoxicity and were therefore selected for further investigation.
Figure 2.
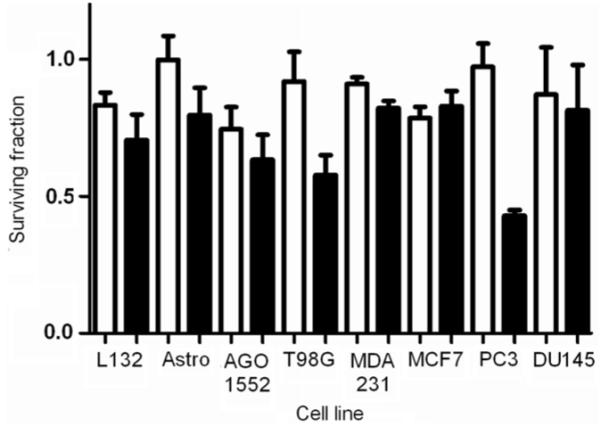
Effect of gold nanoparticles on clonogenic survival. The cytotoxicity of gold nanoparticles following 1 h exposure to concentrations of 10 μg ml−1 (white column) and 100 μg ml−1 (solid column). Surviving fractions were normalized to untreated control cells in each of the experiments. Data points show the mean of at least three independent experiments ± SEM.
The effect of gold nanoparticles on cell proliferation was measured by dynamic cell proliferation assay (Roche Applied Sciences, UK). Figure 3 shows the real time proliferative responses of MDA-231-MB and DU-145 cells following exposure to nanoparticles. Addition of gold at 10 and 100 μg ml−1 had no effect on the proliferation of MDA-231-MB cells compared to control cells (p > 0.05) whilst proliferation of DU-145 cells was significantly inhibited by gold at 10 (p < 0.0001) and 100 μg ml−1 (p = 0.0057). No significant difference in cell index was observed between cells exposed to 10 or 100 μg ml−1 (p > 0.05).
Figure 3.
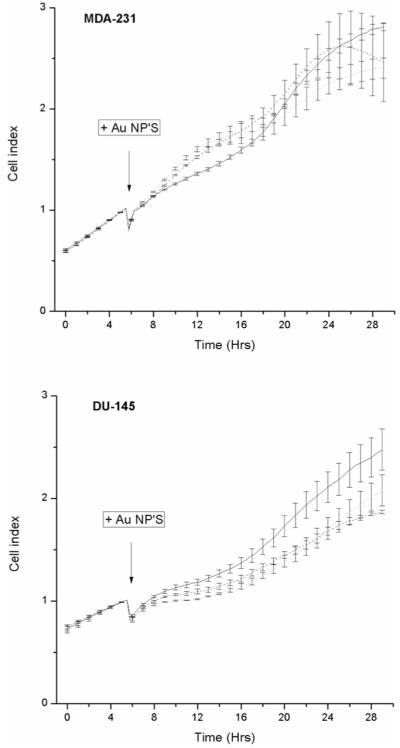
Effect of gold nanoparticles on proliferative response. The proliferative responses of MDA-231-MB and DU-145 cells was measures in real time. Cells were continuously exposed to nanoparticles at concentrations of 10 (dashed line) and 100 μg ml−1 (dotted line). Untreated control cells are shown as a solid line. Normal proliferative responses of the cells were monitored for 4 h prior to addition of gold nanoparticles as indicated by the arrow and cell index recorded every 15 min. Data is shown as the average proliferative index from three independent determinations ± SEM.
3.3. Apoptosis measurement by flow cytometry
Cell cycle distributions were measured in MDA-231-MB and DU-145 cells following exposure to 100 μg ml−1 of nanoparticles. No significant alterations in cell cycle distributions were observed compared to control cells (p > 0.05, data not shown) with the exception of the sub G1 cell populations. Figure 4 shows the sub G1 population measurements 24 and 48 h after exposure to 100 μg ml−1 of gold nanoparticles for 1 and 24 h. MDA-231 cells showed no significant increase in sub G1 population at these time points compared to corresponding controls (p > 0.05) whilst DU-145 cells showed a significant increase in sub G1 cell population 48 h after exposure to nanoparticles compared to control cells (p = 0.03).
Figure 4.
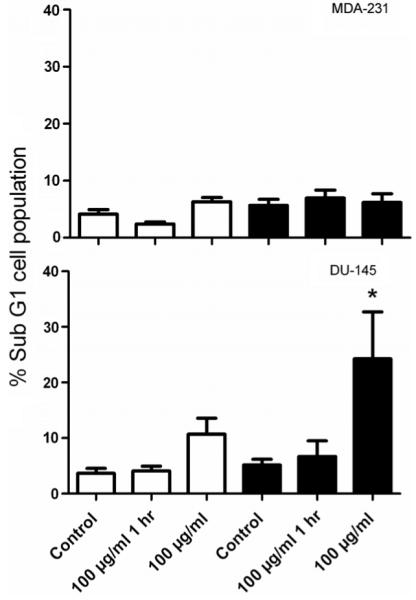
Measurement of apoptosis by flow cytometry. MDA-231-MB and DU-145 cells were exposed to nanoparticles at a concentration 100 μg ml−1 for 1 and 24 h. Samples were labelled with propidium iodide (PI) at 24 (open bars) and 48 h (closed bars) and analysed by flow cytometry. Changes in the sub G1 cell populations are shown relative to untreated control cells. Data points show the mean from three independent measurements ± SEM.
3.4. Induction of DNA damage
Levels of DNA damage were determined by immunofluorescent scoring of foci for the DNA double strand break markers H2AX and 53BP1. Figure 5 shows the number of foci in MDA-231-MD and DU-145 cells following exposure to gold nanoparticles. In MDA-231 cells, significant increases in the number of γH2AX foci number were shown after exposure to 10 μg ml−1 for 24 h (p < 0.001) and 100 μg ml−1 for 1 h (p = 0.04). 53BP1 foci increased significantly at a concentration of 100 μg ml−1 for 1 and 24 h (p < 0.01). In DU-145 cells, significant increases in the number of γH2AX foci number were shown after exposure to 10 and 100 μg ml−1 for 24 h (p < 0.001). 53BP1 foci were shown to increase significantly at a concentration of 10 μg ml−1 for 1 h (p = 0.01) and 24 h (p < 0.01) and at 100 μg ml−1 for 24 h (p < 0.01).
Figure 5.
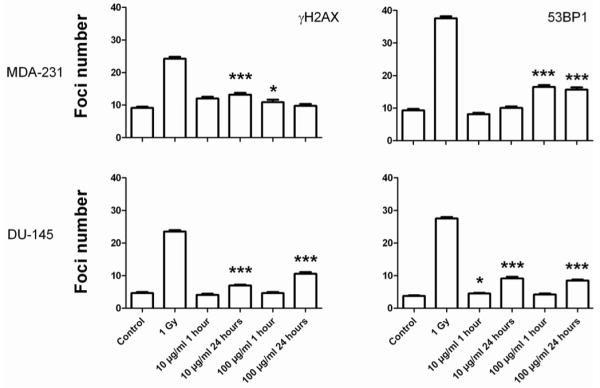
Quantification of DNA damage using γH2AX and 53BP1. MDA-231-MB and DU-145 cells were exposed to nanoparticles at concentrations of 10 and 100 μg ml−1 for 1 and 24 h. Induction of DNA damage was confirmed by exposing cells to 1 Gy and fixing cells 30 min after irradiation.
3.5. Measurement of oxidative stress
Induction of oxidative stress was measured by flow cytometry using the cell permeable fluorescent dye CM-H2DCFDA. Figure 6 shows the relative changes in ROS measurements with exposure to 10 and 100 μg ml−1 of gold nanoparticles for 1 and 24 h in MDA-231 and DU-145 cells. Cells were exposed to 0.5% H2O2 for 1 h as a positive control. In MDA-232 cells, exposure to gold (10 μg ml−1) for 1 and 24 h had an anti-oxidant effect causing a significant decrease in ROS (p < 0.01). Exposure to 100 μg ml−1 significantly decreased ROS levels at 1 h (p < 0.01), but had no significant effect at 24 h compared to control cells (p > 0.63). This trend was reflected in DU-145 cells which showed a significant decrease in ROS levels at 10 μg ml−1 at 1 (p = 0.05) and 24 h (p = 0.01). At a concentration of 100 μg ml−1, exposure for 1 h had no significant effect on production of ROS (p = 0.41) whilst 24 h exposure caused a significant increase in ROS compare to untreated control cells (p = 0.03).
Figure 6.
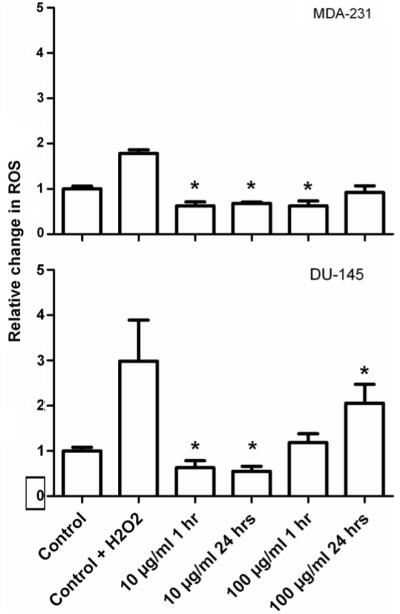
Flow cytometry measurement of oxidative stress. The level of oxidative stress in MDA-231-MB and DU-145 cells following exposure to 10 and 100 μg ml−1 of gold nanoparticles was measured using labelled the fluorescent dye H2DCFDA and analysed by flow cytometry. Reactive oxygen species measurements are shown relative to untreated control cells. Data points show the mean at least three independent measurements ± SEM.
3.6. Assessment of radiation dose modifying effects
The radiation dose modifying effects of 1.9 nm gold were determined by clonogenic assay. Cells were exposed to gold nanoparticles at 10 and 100 μg ml−1 for 1 h prior to irradiation with 160 kVp x-rays. Figure 7 shows the radiation dose response curves for each of the cell lines investigated. Surviving fractions were normalized to that of non irradiated control cells in each of the experiments to correct for the direct cytotoxic effect of gold nanoparticles. Dose response curves of the form SF = exp[−(αD + βD2)] were fitted to the data using least squares minimization, weighted using the standard error of each measurement. Statistical errors on fit values were calculated with 95% confidence intervals. The radiobiological parameters for each of the cell lines investigated are summarized in table 1. Statistical analysis showed significant differences in the response of several cell lines to radiation in the presence of gold nanoparticles compared to control cells in the absence of gold. The most significant response was in AGO-1522B cells with 100 μg ml−1 compared to radiation only controls (p = 0.009). In addition, significant differences were shown in MDA-231-MB cells with 10 and 100 μg ml−1 (p = 0.035, p = 0.06), and astrocytes with 10 μg ml−1 (p = 0.01). Dose enhancement factors were calculated as the ratio of doses required to give the same surviving fractions as that of the radiation only control cells at a dose of 2 Gy (SF2).
Figure 7.

Measurement of radiation dose modifying response. Radiation dose response curves were determined by colony forming assay for cells irradiated with 10 and 100 μg ml−1 nanoparticles. Cells were incubated with nanoparticles 1 h prior to irradiation with 160 kVp x-rays. Each of the radiation dose response curves for each of the cell lines are shown as x-ray control (○ solid line); 10 μg ml−1 gold nanoparticles (● dotted line) and 100 μg ml−1 gold nanoparticles (▲ dashed line). Surviving fractions were normalized to non irradiated control cells in each of the experimental groups. Data points show the mean of at least three independent experiments ± SEM.
Table 1.
Summary of radiobiological parameters for cells irradiated with 160 kVp x-rays in the presence and absence of gold nanoparticles. Values of α and β were derived from fitting of the data to the form SF = exp−(αD − βD2) using least mean squares minimization. Statistical errors on fit values were calculated with 95% confidence intervals. Dose enhancement factors (DEF’s) were calculated as the ratio of doses required to give the same surviving fraction as that of the radiation only control cells at a dose of 2 Gy (SF2)
| Experimental conditions | ||||||||
|---|---|---|---|---|---|---|---|---|
| Control |
10 μg ml−1 |
100 μg ml−1 |
||||||
| Cell line | α (Gy−1) | β (Gy−2) | α (Gy−1) | β (Gy−2) | DEF | α (Gy−1) | β (Gy−2) | DEF |
| AGO-1552B | 0.25 ± (0.11) | 0.04 ± (0.02) | 0.30 ± (0.06) | 0.05 ± (0.01) | 1.16 (+0.30, −0.26) |
0.68 ± (0.19) | < 0.04 | 1.97 (+0.77, −0.86) |
| Astro | 0.37 ± (0.14) | 0.08 ± (0.03) | 0.40 ± (0.04) | 0.09 ± (0.02) | 1.04 (+0.43, −0.30) |
0.23 ± (0.14) | 0.16 ± (0.03) | 0.96 (+0.44, −0.29) |
| DU-145 | 0.03 ± (0.05) | 0.04 ± (0.01) | 0.05 ± (0.04) | 0.04 ± (0.01) | 0.98 (+0.27, −0.22) |
0.04 ± (0.05) | 0.04 ± (0.01) | 0.81 (+0.17, −0.15) |
| L132 | 0.12 ± (0.05) | 0.03 ± (0.01) | 0.11 ± (0.04) | 0.03 ± (0.01) | 0.86 (+0.28, −0.30) |
0.05 ± (0.03) | 0.04 ± (0.01) | 0.87 (+0.16, −0.17) |
| MCF-7 | 0.46 ± (0.13) | 0.02 ± (0.03) | 0.28 ± (0.01) | 0.07 ± (0.04) | 1.41 (+0.43, −0.39) |
0.24 ± (0.05) | 0.08 ± (0.02) | 1.09 (+0.42, −0.47) |
| MDA-231-MB | 0.09 ± (0.03) | 0.03 ± (0.01) | 0.15 ± (0.05) | 0.03 ± (0.01) | 1.67 (+1.15, −0.87) |
0.27 ± (0.06) | 0.02 ± (0.01) | 1.11 (+0.84, −0.60) |
| PC-3 | 0.12 ± (0.06) | 0.06 ± (0.01) | 0.29 ± (0.08) | 0.03 ± (0.01) | 1.07 (+0.23, −0.22) |
0.21 ± (0.10) | 0.03 ± (0.02) | 1.02 (+0.26, −0.23) |
| T98G | 0.04 ± (0.05) | 0.03 ± (0.01) | 0.14 ± (0.07) | 0.02 ± (0.01) | 1.30 (+0.37, −0.33) |
0.06 ± (0.07) | 0.02 ± (0.01) | 1.91 (+0.55, −0.54) |
4. Discussion
The unique properties of nanomaterials have led to their use in a wide range of biomedical applications including cancer diagnosis and therapeutics [1-4, 31]. Several reports have demonstrated the potential for gold nanoparticles in metal enhanced radiotherapy for the treatment of cancer [21, 24, 25]. Whilst most of these studies have used gold particles with sizes in the low nanometre range (1.9 nm) [21, 24] reports have shown these particles may be not be of optimum size for cellular uptake [34-37], may be cytotoxic [29, 30]. Considering the promising in vivo results achieved with 1.9 nm particles in combination with 250 kVp x-rays [21] and that particles in this size range are capable of transition across the blood brain barrier this study evaluated the in vitro cellular responses and dose modifying potential in a range of cell types. 1.9 nm gold nanoparticles are shown to be cytotoxic. Of the cell lines investigated with DU-145 cells showing comparatively high levels of cytotoxicity compared to MDA-231-MB cells across multiple endpoints. No correlation between the level of cytotoxic response was observed between the normal (Astrocytes, AGO-1522B) and the other immortalized or tumour cell lines. The neural cells (astrocytes and T98G glioma) also showed high levels of cytotoxicity. Cell proliferation in response to gold nanoparticles was not significantly different from control cells in MDA-231-MB (p > 0.05) whereas DU-145 cells showed significantly reduced proliferation at 100 μg ml−1 (p = 0.0057). These observations should be qualified by stating that cell index is an arbitrary measure of electrical impedance based on changes in cell proliferation, shape and adhesion, with these factors potentially also playing a role in the observed responses.
Cell cycle analysis showed gold nanoparticles had no significant effect on cell cycle distributions (p > 0.05) with the exception sub G1 populations indicating induction of apoptosis. Significant levels of apoptosis were observed in DU-145 cells following exposure to gold nanoparticles 24 and 48 h. These findings were supported by elevated levels of the DNA damage markers γH2AX and 53BP1. In addition, elevated levels of oxidative stress were detected by fluorescence measurement of intracellular reactive oxygen species (ROS). Taken together these findings show 1.9 nm gold particles induce apoptosis and DNA damage, which may be mediated by the increased generation of ROS.
In a similar study, Pan et al [38] demonstrated 1.4 nm triphenyl monosulfonate (TPPMS) coated particles caused elevated oxidative stress. However, no increase in sub G1 cell population was reported and the authors concluded that necrosis due to mitochondrial damage mediated by elevated levels of ROS was the primary mechanism involved. Gold nanoparticles have also been shown to enhance oxidative stress induced by 5-aminolevulinic acid (5-ALA) [39].
Rahman et al [24] showed that millimolar concentrations of 1.9 nm gold particles decreased cell viability by 30% in bovine aortic endothelial cells. Patra and colleagues [40] demonstrated cell specific induction of apoptosis using multiple endpoints including poly(ADP-ribose) polymerase (PARP) cleavage and uptake of propidium iodide in baby hamster kidney and human hepatocellular carcinoma cells treated with 30–120 nm particles. A recent in vivo study, Cho et al [41] showed that 13 nm PEG-coated gold nanoparticles had significant in vivo toxicity causing acute inflammation and apoptosis in the livers of BALB/c mice. Conversely, Connor et al [42] failed to show acute toxicity for cysteine and citrate capped 4 nm particles and 18 nm cetyl trimethylammonium bromide (CTAB) particles. This study also showed maximal nanoparticle uptake within 1 h of exposure using UV–vis to monitor uptake from culture medium.
Emerging evidence suggests that variability in the synthesis and functionalization of nanoparticles necessitates extensive toxicity evaluation. Particle size [30, 35-39], shape [43] and surface modification [29] may be critical in determining cellular response. Given that particles with sizes in the low nanometre range are similar in size to many small protein molecules such as hormones and growth factors, these observations may be a consequence of modulation of key regulatory pathways within the cell suggesting the merit of more detailed mechanistic investigation.
The radiation enhancing effect of different types of gold nanoparticle has been demonstrated in vivo [21] and in vitro using cellular [22-25] and plasmid DNA [26-28 model systems. Using the same 1.9 nm particles as used in this study, Rahman et al [24] characterized the radiation enhancement effects of kilovoltage x-rays and megavoltage electrons in bovine endothelial cells. The authors reported dose enhancement factors of around 25 using 80 kVp x-rays and 4 using 6 MeV electrons. In addition, this report showed low mM nanoparticle concentrations to significantly decrease cell viability.
Our experimental data showed significant differences in the dose response curves with and without gold in AGO-1522B (100 μg ml−1), MDA-231-MB (10 and 100 μg ml−1) and astrocytes (10 μg ml−1). It was also noted that the shape of the survival curve, particularly for the AGO-1522B cells changed from a linear quadratic response to a purely exponential response at the highest concentration of nanoparticles used indicative of a shift in the mechanism underpinning the survival response. Dose enhancement factors were calculated based on the ratio of the surviving fractions at 2 Gy (SF2). These values ranged from 1.97 for AGO-1522B at 100 μg ml−1 to 1.04 for Astrocytes at 10 μg ml−1 and 1.67 and 1.11 in MDA-231-MB cells at 10 μg ml−1 and 100 μg ml−1 respectively. These values are in close agreement with those of Rahman et al [24] who reported a dose enhancement factor of 1.4 with 150 kVp x-rays at a concentration of 0.5 mM.
In agreement with other authors [21-24] it is possible that the gold nanoparticle radiation enhancement observed in our study is primarily due to the photoelectric effect and subsequent Auger decay. The x-ray absorption coefficient of gold is in region of the x-ray spectrum where absorption is dominated by photo ionization from either the K- or L-shell, with the gold K-shell edge being at 80.7 keV. The radiation spectrum from our 160 kVp source ranges predominantly from 20 to 100 keV with a high energy tail increasing to the maximum energy of 160 keV, with a form broadly similar to that shown previously by McMahon et al [15] for 150 kVp. The ratio of the mass attenuation coefficient of gold to that of water has a broad maximum at an energy of about 40 keV [44]. Therefore the radiation source used in these experiments is expected to achieve a high level of dose enhancement yet a higher level could be achieved using a more narrow band source tuned to this maximum. In addition to the physical processes governing gold nanoparticle radiation enhancement, the cellular responses presented in this report suggest a role for biological enhancement of radiation dose which remain to be determined.
A recent study by Chitrani et al [25] compared particles from 14 to 74 nm and showed the highest level of cellular uptake and radiosensitization enhancement with 50 nm particles irradiated with 105 kVp x-rays. Furthermore, the study emphasizes the need for optimization of nanoparticles to achieve the highest level of radiation enhancement which is likely to dependent not solely by size, but also shape and functionalization.
In conclusion, we have demonstrated gold nanoparticles as potential radiation enhancing agents accompanied with cell cytotoxicity, apoptosis, DNA damage and oxidative stress. This study highlights the need for comprehensive characterization of cellular responses to gold nanoparticles when assessing radiation enhancing potential in cancer therapy.
Acknowledgments
We would like to thank Cancer Research UK [CRUK] (grant number C1278/A990 to DGH and C1513/A7047 to KMP) for financial support.
References
- [1].Boisselier E, Astruc D. Gold nanoparticles in nanomedicine: preparations, imaging, diagnostics, therapies and toxicity. Chem. Soc. Rev. 2009;38:1759–82. doi: 10.1039/b806051g. [DOI] [PubMed] [Google Scholar]
- [2].Radwan SH, Azzazy HM. Gold nanoparticles for molecular diagnostics expert. Rev. Mol. Diagn. 2009;9:511–24. doi: 10.1586/erm.09.33. [DOI] [PubMed] [Google Scholar]
- [3].Jain KK. Recent advances in nanooncology Technol. Cancer Res. Treat. 2008;7:1–13. doi: 10.1177/153303460800700101. [DOI] [PubMed] [Google Scholar]
- [4].Jain KK. Applications of nanobiotechnology in clinical diagnostics. Clin. Chem. 2007;53:2002–9. doi: 10.1373/clinchem.2007.090795. [DOI] [PubMed] [Google Scholar]
- [5].Chen YH, Tsai CY, Huang PY, Chang MY, Cheng PC, Chou CH, Chen DH, Wang CH, Shiau AL, Wu CL. Methotrexate conjugated to gold nanoparticles inhibits tumor growth in a syngeneic lung tumor model. Mol. Pharm. 2007;4:713–22. doi: 10.1021/mp060132k. [DOI] [PubMed] [Google Scholar]
- [6].Dreaden EC, Mwakwari SC, Sodji QH, Oyelere AK, El-Sayed MA. Tamoxifen-poly(ethylene glycol)-thiol gold nanoparticle conjugates: enhanced potency and selective delivery for breast cancer treatment. Bioconjug. Chem. 2009;20:2247–53. doi: 10.1021/bc9002212. [DOI] [PMC free article] [PubMed] [Google Scholar]
- [7].Brown SD, Nativo P, Smith JA, Stirling D, Edwards PR, Venugopal B, Flint DJ, Plumb JA, Graham D, Wheate NJ. Gold nanoparticles for the improved anticancer drug delivery of the active component of oxaliplatin. J. Am. Chem. Soc. 2010;132:4678–84. doi: 10.1021/ja908117a. [DOI] [PMC free article] [PubMed] [Google Scholar]
- [8].Curley SA, Cherukuri P, Briggs K, Patra CR, Upton M, Dolson E, Mukherjee P. Noninvasive radiofrequency field-induced hyperthermic cytotoxicity in human cancer cells using cetuximab-targeted gold nanoparticles. J. Exp. Ther. Oncol. 2008;7:313–26. [PubMed] [Google Scholar]
- [9].Terentyuk GS, Maslyakova GN, Suleymanova LV, Khlebtsov NG, Khlebtsov BN, Akchurin GG, Maksimova IL, Tuchin VV. Laser-induced tissue hyperthermia mediated by gold nanoparticles: toward cancer phototherapy. J. Biomed. Opt. 2009;14:021016. doi: 10.1117/1.3122371. [DOI] [PubMed] [Google Scholar]
- [10].Cherukuri P, Curley SA. Use of nanoparticles for targeted, noninvasive thermal destruction of malignant cells. Methods Mol. Biol. 2010;624:359–73. doi: 10.1007/978-1-60761-609-2_24. [DOI] [PubMed] [Google Scholar]
- [11].Hainfeld JF, Dilmanian FA, Slatkin DN, Smilowitz HM. Radiotherapy enhancement with gold nanoparticles. J. Pharm. Pharmacol. 2008;60:977–85. doi: 10.1211/jpp.60.8.0005. [DOI] [PubMed] [Google Scholar]
- [12].Castillo MH, Button TM, Doerr R, Homs MI, Pruett CW, Pearce JI. Effects of radiotherapy on mandibular reconstruction plates. Am. J. Surg. 1988;156:61–3. doi: 10.1016/s0002-9610(88)80287-3. [DOI] [PubMed] [Google Scholar]
- [13].Niroomand-rad A, Razavi A, Thobejane S, Harter KW. Radiation dose perturbation at tissue-titanium dental interfaces in head and neck cancer patients. Int. J. Radiat. Oncol. Biol. Phys. 1996;34:475–80. doi: 10.1016/0360-3016(95)02095-0. [DOI] [PubMed] [Google Scholar]
- [14].Allal AS, Richter M, Russo M, Rouzaud M, Dulguerov P, Kurtz JM. Dose variation at bone/titanium interfaces using titanium hollow screw osseointegrating reconstructive plates. Int. J. Radiat. Oncol. Biol. Phys. 1998;40:215–9. doi: 10.1016/s0360-3016(97)00587-7. [DOI] [PubMed] [Google Scholar]
- [15].McMahon SJ, Mendenhall MH, Jain S, Currell F. Radiotherapy in the presence of contrast agents: a general figure of merit and its application to gold nanoparticles. Phys. Med. Biol. 2008;20:5635–51. doi: 10.1088/0031-9155/53/20/005. [DOI] [PubMed] [Google Scholar]
- [16].Cho SH. Estimation of tumor dose enhancement due to gold nanoparticles during typical radiation treatments: a preliminary Monte Carlo study. Phys. Med. Biol. 2005;50:N163–73. doi: 10.1088/0031-9155/50/15/N01. [DOI] [PubMed] [Google Scholar]
- [17].Das IJ, Chopra KL. Backscatter dose perturbation in kilovoltage photon beams at high atomic number interfaces. Med. Phys. 1995;22:767–73. doi: 10.1118/1.597594. [DOI] [PubMed] [Google Scholar]
- [18].Li XA, Chu JC, Chen W, Zusag T. Dose enhancement by a thin foil of high-Z material: a Monte Carlo study. Med. Phys. 1999;26:1245–51. doi: 10.1118/1.598619. [DOI] [PubMed] [Google Scholar]
- [19].Regulla DF, Hieber LB, Seidenbusch M. Physical and biological interface dose effects in tissue due to x-ray-induced release of secondary radiation from metallic gold surfaces. Radiat. Res. 1998;150:92–100. [PubMed] [Google Scholar]
- [20].Herold DM, Das IJ, Stobbe CC, Iyer RV, Chapman JD. Gold microspheres: a selective technique for producing biologically effective dose enhancement. Int. J. Radiat. Biol. 2000;76:1357–64. doi: 10.1080/09553000050151637. [DOI] [PubMed] [Google Scholar]
- [21].Hainfeld JF, Slatkin DN, Smilowitz HM. The use of gold nanoparticles to enhance radiotherapy in mice. Phys. Med. Biol. 2004;49:N309–15. doi: 10.1088/0031-9155/49/18/n03. [DOI] [PubMed] [Google Scholar]
- [22].Kong T, Zeng J, Wang X, Yang X, Yang J, McQuarrie S, McEwan A, Roa W, Chen J, Xing JZ. Enhancement of radiation cytotoxicity in breast-cancer cells by localized attachment of gold nanoparticles. Small. 2008;4:1537–43. doi: 10.1002/smll.200700794. [DOI] [PubMed] [Google Scholar]
- [23].Liu CJ, et al. Enhancement of cell radiation sensitivity by pegylated gold nanoparticles. Phys. Med. Biol. 2010;55:931–45. doi: 10.1088/0031-9155/55/4/002. [DOI] [PubMed] [Google Scholar]
- [24].Rahman WN, Bishara N, Ackerly T, He CF, Jackson P, Wong C, Davidson R, Geso M. Enhancement of radiation effects by gold nanoparticles for superficial radiation therapy. Nanomedicine. 2009;5:136–42. doi: 10.1016/j.nano.2009.01.014. [DOI] [PubMed] [Google Scholar]
- [25].Chithrani DB, Jelveh S, Jalali F, van Prooijen M, Allen C, Bristow RG, Hill RP, Jaffray DA. Gold nanoparticles as radiation sensitizers in cancer therapy. Radiat. Res. 2010;173:719–28. doi: 10.1667/RR1984.1. [DOI] [PubMed] [Google Scholar]
- [26].Butterworth KT, Wyer JA, Brennan-Fournet M, Latimer CJ, Shah MB, Currell FJ, Hirst DG. Variation of strand break yield for plasmid DNA irradiated with high-Z metal nanoparticles. Radiat. Res. 2008;170:381–7. doi: 10.1667/RR1320.1. [DOI] [PubMed] [Google Scholar]
- [27].Zheng Y, Hunting DH, Ayotte P, Sanche L. Radiosensitization of DNA by gold nanoparticles irradiated with high-energy electrons. Radiat. Res. 2008;169:19–27. doi: 10.1667/RR1080.1. [DOI] [PubMed] [Google Scholar]
- [28].Foley EA, Carter JD, Shan F, Guo T. Enhanced relaxation of nanoparticle bound supercoiled DNA in x-ray radiation. Chem. Commun. 2005;25:3192–4. doi: 10.1039/b503425f. [DOI] [PubMed] [Google Scholar]
- [29].Goodman CM, McCusker CD, Yilmaz T, Rotello VM. Toxicity of gold nanoparticles functionalized with cationic and anionic side chains. Bioconjug. Chem. 2004;15:897–900. doi: 10.1021/bc049951i. [DOI] [PubMed] [Google Scholar]
- [30].Pan Y, Neuss S, Leifert A, Fischler A, Wen F, Simon U, Schmid G, Brandau W, Jahnen-Dechent W. Size-dependent cytotoxicity of gold nanoparticles. Small. 2007;11:1941–9. doi: 10.1002/smll.200700378. [DOI] [PubMed] [Google Scholar]
- [31].Skrabalak SE, Au L, Lu X, Li X, Xia Y. Gold nanocages for cancer detection and treatment. Nanomedicines. 2007;2:657–68. doi: 10.2217/17435889.2.5.657. [DOI] [PubMed] [Google Scholar]
- [32].Jiang W, Kim BY, Rutka JT, Chan WC. Nanoparticle-mediated cellular response is size-dependent. Nat. Nanotechnol. 2008;3:145–50. doi: 10.1038/nnano.2008.30. [DOI] [PubMed] [Google Scholar]
- [33].Puck TT, Marcus PI. Action of x-rays on mammalian cells. J. Exp. Med. 1956;103:653–66. doi: 10.1084/jem.103.5.653. [DOI] [PMC free article] [PubMed] [Google Scholar]
- [34].Gao H, Shi W, Freund LB. Mechanics of receptor-mediated endocytosis. Proc. Natl Acad. Sci. USA. 2005;102:9496–74. doi: 10.1073/pnas.0503879102. [DOI] [PMC free article] [PubMed] [Google Scholar]
- [35].Chithrani BD, Stewart J, Allen C, Jaffray DA. Intracellular uptake, transport, and processing of nanostructures in cancer cells. Nanomedicine. 2009;2:118–27. doi: 10.1016/j.nano.2009.01.008. [DOI] [PubMed] [Google Scholar]
- [36].Chithrani BD, Ghazani AA, Chan WC. Determining the size and shape dependence of gold nanoparticle uptake into mammalian cells. Nano Lett. 2006;6:662–8. doi: 10.1021/nl052396o. [DOI] [PubMed] [Google Scholar]
- [37].Chithrani BD, Chan WC. Elucidating the mechanism of cellular uptake and removal of protein-coated gold nanoparticles of different sizes and shapes. Nano Lett. 2007;7:1542–50. doi: 10.1021/nl070363y. [DOI] [PubMed] [Google Scholar]
- [38].Pan Y, Leifert A, Ruau D, Neuss S, Bornemann J, Schmid G, Brandau W, Simon U, Jahnen-Dechent W. Gold nanoparticles of diameter 1.4 nm trigger necrosis by oxidative stress and mitochondrial damage. Small. 2009;5:2067–76. doi: 10.1002/smll.200900466. [DOI] [PubMed] [Google Scholar]
- [39].Ito S, Miyoshi N, Degraff WG, Nagashima K, Kirschenbaum LJ, Riesz P. Enhancement of 5-aminolevulinic acid-induced oxidative stress on two cancer cell lines by gold nanoparticles. Free Radic. Res. 2009;43:1214–24. doi: 10.3109/10715760903271249. [DOI] [PubMed] [Google Scholar]
- [40].Patra HK, Banerjee S, Chaudhuri U, Lahiri P, Dasgupta AK. Cell selective response to gold nanoparticles. Nanomedicine. 2007;3:111–9. doi: 10.1016/j.nano.2007.03.005. [DOI] [PubMed] [Google Scholar]
- [41].Cho WS, et al. Acute toxicity and pharmacokinetics of 13 nm-sized PEG-coated gold nanoparticles. Toxicol. Appl. Pharmacol. 2009;236:16–24. doi: 10.1016/j.taap.2008.12.023. [DOI] [PubMed] [Google Scholar]
- [42].Connor EE, Mwamuka J, Gole A, Murphy CJ, Wyatt MD. Gold nanoparticles are taken up by human cells but do not cause acute cytotoxicity. Small. 2005;1:325–7. doi: 10.1002/smll.200400093. [DOI] [PubMed] [Google Scholar]
- [43].Jahnen-Dechent W, Simon U. Function follows form: shape complementarity and nanoparticle toxicity. Nanomedicine. 2008;5:601–3. doi: 10.2217/17435889.3.5.601. [DOI] [PubMed] [Google Scholar]
- [44].Hubbell JH, Seltzer SM. Tables of X-ray Mass Attenuation Coefficients and Mass Energy-Absorption Coefficients 1 KeV to 20 MeV For Elements Z = 1–92 and 48 Additional Substances of Dosimetric Interest. US Department of Commerce, Technology Administration, National Institute of Standards and Technology; Gaithersburg, MD: 1996. [Google Scholar]