

Abstract
Adipocytes are heterogeneous. Whether their differences are attributed to anatomical location or to different developmental origins is unknown. We investigated whether development of different white adipose tissue (WAT) depots in zebrafish occurs simultaneously or whether adipogenesis is influenced by the metabolic demands of growing fish. Like mammals, zebrafish adipocyte morphology is distinctive and adipocytes express cell-specific markers. All adults contain WAT in pancreatic, subcutaneous, visceral, esophageal, mandibular, cranial, and tail-fin depots. Unlike most zebrafish organs that form during embryogenesis, WAT was not found in embryos or young larvae. Instead, WAT was first identified in the pancreas on 12 days postfertilization (dpf), and then in visceral, subcutaneous, and cranial stores in older fish. All 30 dpf fish exceeding 10.6 mm standard length contained the adult repertoire of WAT depots. Pancreatic, esophageal, and subcutaneous WAT appearance correlated with size, not age, as found for other features appearing during postembryonic zebrafish development.
Keywords: adipocyte, post-embryonic development, larvae, fat, histology
INTRODUCTION
Obesity is a worldwide health epidemic, and over one third of Americans are obese (Flegal et al., 2010). The consequences are dire, including cardiovascular and liver disease, the development of diabetes, predisposition to a variety of cancers, and increased morbidity and mortality (Bruce and Hanson, 2010). When energy intake exceeds expenditure, excess lipid is stored in adipocytes as triglycerides. Adipocyte size expands to accommodate the additional lipids; however, the total number of adipocytes does not apparently increase in obese adults (Spalding et al., 2008). Recent data showing expansion of adipocyte stem cells in mice fed a high fat diet (Rodeheffer et al., 2008) may change this dogma. The formation and expansion of adipose tissue during childhood can lead to impaired glucose regulation, hypertension, dyslipidemia, fatty liver disease, and systemic low-grade inflammation during childhood (Cali and Caprio, 2008). Moreover, many obese and overweight children develop into obese adults, resulting in life-long health problems (Flynn et al., 2006). It is, therefore, important to understand adipogenesis in vivo and to uncover the contribution of adipocyte number and location to obesity and its comorbidities.
In endotherms, two types of adipose tissue have different functions. Brown adipose tissue contains multiple microvesicular lipid droplets and abundant mitochondria and function to use lipid for generating heat. In white adipose tissue (WAT), on the other hand, lipid droplets fuse into one large unilocular lipid droplet which is stored as a reserve for future energy use (Gesta et al., 2007). Most animals use stored fat as an energy source: C. elegans store lipid in their intestinal epithelial cells (Wood, 1988), Drosophila have a fat body (Doane, 1960) and vertebrates use mesoderm-derived WAT as their main lipid storage depot. WAT is comprised of adipocytes, stroma, macrophages and vasculature and mature adipocytes express adipokines, such as adipsin, adiponectin, and leptin (Gesta et al., 2007). Thus, WAT is considered an endocrine organ.
In humans, WAT develops within different depots, including but not limited to intra-abdominal (omental, intestinal, and perirenal), subcutaneous (buttocks, thighs, and abdomen), facial, cervical, supraclavicular, and bone marrow stores (Wasserman, 1965; Gesta et al., 2007). There is evidence that these WAT depots may be functionally and biologically different from each other. For example, WAT in the breasts and thighs is responsive to sex hormones while WAT on the neck and upper back responds to glucocorticoids, exemplified by the so-called “buffalo hump” in Cushing’s disease (Gesta et al., 2007). WAT distribution undergoes dynamic changes during aging, in which intra-abdominal WAT expands while subcutaneous WAT diminishes (Kuk et al., 2009). Interestingly, there are marked differences in the transcriptome of different WAT depots in both mice (Gesta et al., 2006) and humans (Tchkonia et al., 2007). Finally, some lipodystrophies affect particular adipose stores while others are unaffected: familial partial lipodystrophy of the Dunnigan type, for example, displays a loss of subcutaneous WAT in the trunk and extremities without affecting intra-abdominal, neck, or facial WAT (Agarwal and Garg, 2006). There is emerging evidence that expansion of some WAT depots, but not others, predispose to co-morbid conditions such as type II diabetes and fatty liver disease (Schaffler et al., 2005). This heterogeneity may denote that subclasses of adipocytes may exist in vivo and that these subclasses may be functionally and biologically distinct. Whether these different stores have different developmental origins has not been examined.
Adipocytes develop in two phases: (i) formation of an adipoblast from an early multipotent progenitor cell and (ii) differentiation of the adipoblast into a definitive adipocyte. While the latter part of adipocyte development has been extensively studied using an in vitro adipocyte differentiation protocol for 3T3-L1 fibroblasts, little is known about earlier stages of adipocyte development. Both mesenchymal stem cells (mesoderm origin; Phinney and Prockop, 2007) and neural crest cells (ectoderm; Billon et al., 2007) can differentiate into adipocytes in vitro; however, adipocyte lineage in vivo has not been established. While in vitro models have been instrumental in identifying many key genes that regulate adipogenesis, these models are not useful for deciphering whether differences experienced in vivo, such as adipocyte location or response to physiological factors, affect development. Recently, an adipocyte progenitor was identified in mice (Rodeheffer et al., 2008), and this will certainly lead to a greater understanding of the formation, expansion, and regeneration of this tissue in vivo.
Brown adipose tissue is not present in poikilotherms, but WAT has been described in most vertebrate classes, including mammals, birds, amphibia, reptiles, and bony fish (osteichthyes). In the superclass osteichthyes, WAT has been described in the common carp (Cyprinus carpio; Gesta et al., 2007) and Atlantic salmon (Salmo salar; Todorcevic et al., 2009), but it has not been well characterized in zebrafish (Danio rerio). Although adipose tissue has been described in adult zebrafish and physiological and morphological similarities to mammals have been demonstrated (Song and Cone, 2007; Flynn et al., 2009), little is known about WAT development in vivo in fish or in mammals. Some outstanding questions are: (i) do all adipocyte depots develop at the same time? Alternatively, (ii) because WAT is integral to metabolism, is adipogenesis in vivo dictated by metabolic or physiological parameters? We address these questions using zebrafish.
Most research in zebrafish development focuses on the embryonic period from 0–3 days postfertilization (dpf), and the formation of most organs during this period has been extensively studied, with WAT being a notable exception. Our finding that WAT is not present in zebrafish embryos provides an explanation for this. We, therefore, focused on the postembryonic period of zebrafish development comprising the larval period, which has recently been extensively described (Parichy et al., 2009). Because lipid accumulates in many cell types other than adipocytes, we used cell morphology to unequivocally identify adipocytes. We asked whether a developmental clock drives the formation of WAT, as is the case with most organs during embryogenesis, or whether fish size correlates with WAT development, as found for many features that develop during the postembryonic period (Parichy et al., 2009). We report that not all WAT depots develop synchronously and suggest that adipogenesis at different anatomical sites may be regulated differently. Zebrafish do not form adipocytes until they become larvae, and while some WAT depots develop according to developmental cues, others develop once the fish exceed a specific size. We conclude that physiological and metabolic parameters thus play a role in adipogenesis in vivo.
RESULTS
WAT Is Located in Discrete Anatomical Sites in Adult Zebrafish
WAT is found in different anatomical locations in most vertebrate species, however, WAT depots distribution in zebrafish has not been reported. The primary functions of adipocytes are to store lipid and to secrete adipokines. As in mammals, other cell types in zebrafish also contain lipid, including myocytes, hepatocytes and chondrocytes (Supp. Fig. S1A, which is available online, and Kadereit et al., 2008, and adipokine expression is not restricted to adipocytes (see below). Therefore, using lipid accumulation or gene expression alone to mark adipocytes can be misleading. Adipocyte morphology, however, is distinctive: the unilocular lipid droplet, thin circular cytoplasm and pericentral nucleus define this cell. Also, WAT includes the loose supporting connective tissue infiltrated by a vascular network. The morphological features of WAT allow for its unequivocal identification on histological sections. We used histology, lipid staining, and gene expression analysis to identify the location of WAT in adult zebrafish.
Consecutive serial sagittal 30-μm sections of an adult zebrafish (12–18 months) were collected on different slides, and one slide was stained with hematoxylin and eosin (H&E), which allows for superior morphological analysis, while the other slide was stained with oil red O to identify lipid. Because we estimate the average adult adipocyte diameter to be between 30 and 40 μm (scale bar middle column in Fig. 1), this technique allowed us to assess both morphological characteristics by means of H&E staining and lipid droplet accumulation by oil red O staining in the same cell (asterisk in Fig. 1B,C).
Fig. 1.

White adipose tissue (WAT) is located in distinct depots in adult zebrafish. A–R: Serial cryosections from adult (12–18 months old) zebrafish were stained with H&E (A,B,D,E,G,H,J,K,M,N,P,Q) or oil red O (C,F,I,L,O,R) for neutral lipids. The boxed region in the far left panels is magnified in the middle panels. Adipocytes have a unilocular lipid droplet (B,C asterisk) thin cytoplasm and peripheral nucleus (B,C arrow). The pancreatic acinar cells are labeled in K. Scale bar = 200 μm in the right panels and 50 μm in the middle and left panels. S: Diagram of the major sites of WAT in zebrafish adults (yellow circles).
The distinguishing histological features described for mammalian adipocytes were identified in zebrafish: these cells have a unilocular lipid droplet, scant cytoplasm, and small, peripheral nucleus. Mucous cells in the epidermis share some histological features with adipocytes, but do not have any oil red O staining (Supp. Fig. S1A). We used these criteria to identify WAT in several distinct anatomical sites in adult zebrafish, including the viscera, esophagus, mandible, tail fin, and subcutaneous tissues as well as within the cranium, surrounding the eye, and interspersed within the pancreatic acinar cells (Fig. 1A–R, and Supp. Fig. S2A–D). Visceral adipocytes were observed posterior to the swim bladder and lining the visceral cavity. Cranial adipocytes were located within the ventral wall of the cranium, situated between the brain and the esophagus. In the five adult fish examined in this study, each had adipocytes in all of the sites illustrated in Supp. Fig. S1. Adipocytes may also be found in additional locations, but because these were not consistent between fish, they were not recorded.
Mature Adipocytes Express Adipose-Specific Genes
Several genes have been described as adipocyte-specific and, in mammals, are used as molecular markers of differentiated adipocytes. These markers include the adipokines leptin (LEP), adipsin (CFD), and adiponectin (ACRP30) and fatty acid binding protein 4 (FABP4; Lago et al., 2009). Factors that drive adipocyte differentiation such as CEBPα, CEBPβ, and PPARγ can also serve as pre-adipocyte markers (Gesta et al., 2007), but other cells also express these genes (Cortes-Canteli et al., 2002; Drori et al., 2005; Yamasaki et al., 2006). There are zebrafish orthologs of each of these markers, and several of them have significant protein homology to human and mouse proteins (Table 1). The likely ortholog of human FABP4 is the zebrafish fabp11 gene, which underwent duplication to fabp11a and fabp11b (Karanth et al., 2008). fabp11a, but not fabp11b, appears to be expressed in lipid-storing cells in zebrafish larvae (Flynn et al., 2009) and is likely an adipocyte-specific fatty acid binding protein.
TABLE 1.
Many Proteins Expressed by Mammalian Adipocytes Are Conserved in Zebrafisha
| Cfd | Acrp30 | Fabp11a | Leptin | Pparg | Cebpb | Cebpa | |
|---|---|---|---|---|---|---|---|
| Human | 41.2 | 54.0 | 50.0 | 23.6 | 47.2 | 38.0 | 52.2 |
| Mouse | 39.5 | 55.4 | 50.0 | 23.6 | 46.8 | 41.4 | 53.2 |
Percent identity of the zebrafish protein compared with the human and mouse orthologs. Each of the corresponding genes, except leptin, which was not assessed, were found to be expressed in zebrafish adipose tissue.
To examine whether these genes are expressed in zebrafish WAT, the two largest WAT stores (visceral and pancreatic) were dissected from 1-year-old adult zebrafish and pooled for mRNA isolation. Quantitative polymerase chain reaction (qPCR) analysis was carried out on these two tissues and on cDNA prepared from liver RNA as a negative control. Figure 2A illustrates the specificity of dissection as determined by PCR for tissue-specific markers of the exocrine pancreas (amylase), hepatocytes (fabp10), and cardiac myocytes (cmlc2, not shown). Markers of liver and heart cells were not detected in the adipocyte containing samples, pointing to the specificity of dissection. We found significant enrichment of acrp30, cfd, and fabp11a in the WAT-containing samples and very low levels in the liver (note the log scale in Fig. 2B). cfd and acrp30 were expressed at higher levels in visceral tissue, this is likely reflects that the percentage of adipocytes in the pancreatic WAT is diluted by pancreatic acinar cells which presumably do not express these genes, whereas visceral WAT is comprised mostly of adipocytes. pparγ is one of the key factors driving adipogenesis and we found it enriched in WAT, but it was also expressed in the liver (Fig. 1B). In situ hybridization for cfd and acrp30 on adult zebrafish sections confirmed the qPCR: both were expressed in visceral (Fig. 2C–G) and esophageal (Fig. 2H–L) adipocytes.
Fig. 2.
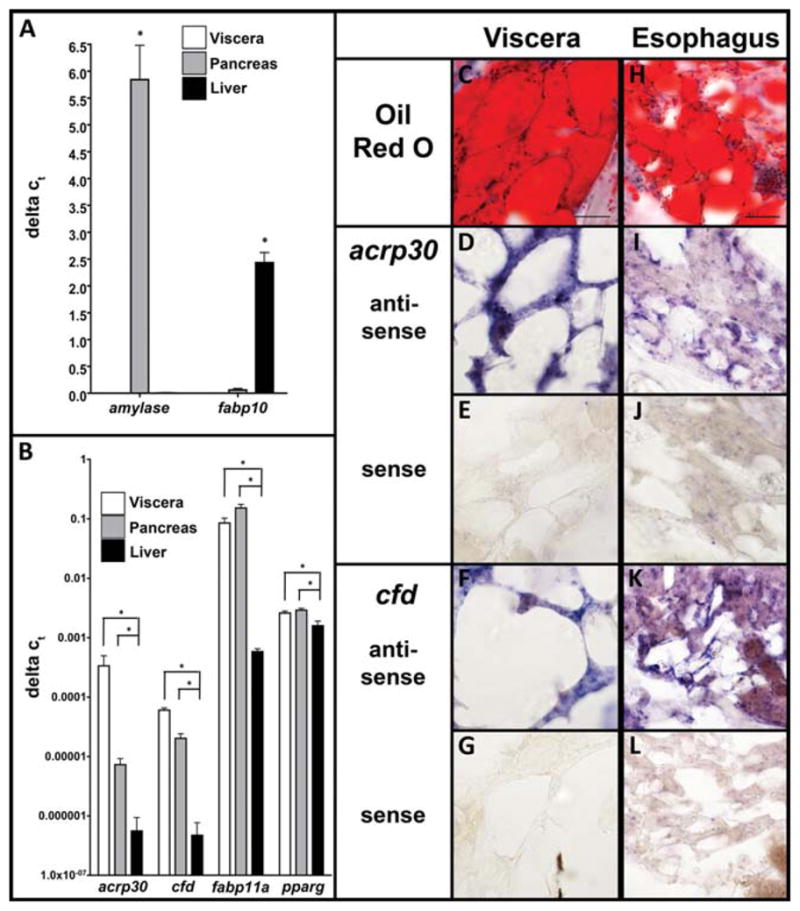
Orthologs of mammalian adipocyte marker genes are enriched in adult visceral, pancreatic, and esophageal adipocytes. The liver, pancreas which contains adipocytes, and visceral white adipose tissue (WAT) were dissected from three batches of three to five adult zebrafish, pooled, and processed for quantitative polymerase chain reaction (qPCR; A,B). A: amylase is a specific marker of pancreatic acinar cells and fabp10 is only expressed in hepatocytes, demonstrating the specificity of the dissected tissues. The zebra-fish orthologs of acrp30, cfd, fabp11a, and pparg are expressed specifically in visceral adipose tissue and pancreas as opposed to liver. B: Bars represent the standard deviation and *indicates P < 0.05. C–L: Oil red O staining (C,H) and in situ hybridization (D–G,I–L) was carried out on consecutive serial sections of adult fish through the visceral and esophageal WAT stores. acrp30 and cfd antisense probes show positive staining in visceral (D–F) and esophageal (I–L) adipocytes coincides with positive oil red O staining in (C,H). There is some staining with both probes in esophageal muscle adjacent to the adipocytes (I,K) which is absent from sections stained with the respective senses probe (J,L). Scale bar = 50 μm.
In contrast, while qPCR shows that cebpα and cebpβ are clearly expressed in both visceral and pancreatic WAT, they were also expressed in the liver (Supp. Fig. S3), indicating that they are not adipose-specific in adult zebrafish. Interestingly, all of these genes were expressed in unfertilized eggs and with different dynamics during embryogenesis (Supp. Fig. S4), yet these are stages in which neither we (see Figs. 3, 4, and not shown) nor other researchers (Flynn et al., 2009) detected any adipocytes. Thus, expression of these genes does not directly reflect adipocyte formation, but instead may suggest other roles for these genes during embryogenesis.
Fig. 3.
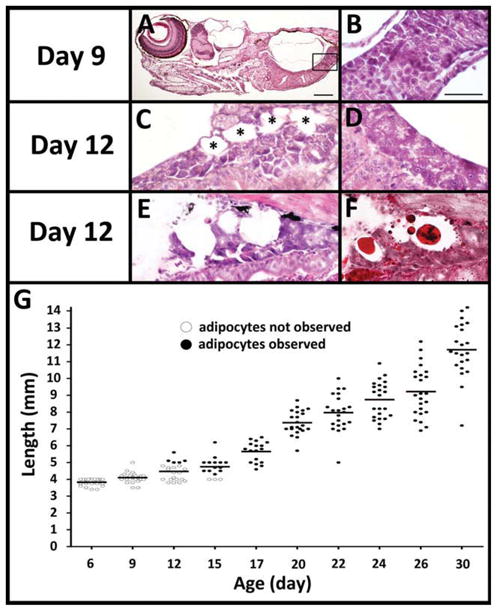
White adipose tissue (WAT) is detectable in zebrafish larvae on 12 days postfertilization (dpf). A: Representative image of a larva at 9 dpf which lacks any morphologically identifiable adipocytes. B: Rectangle is magnified to show the exocrine pancreas lacks adipocytes. C–F: On 12 dpf, the pancreas of some fish (C,E,F) but not others (D) have adipocytes (C, black asterisks) intertwined with pancreatic acinar cells. Another 12 dpf fish with serial sections stained with hematoxylin and eosin (H&E; E) or oil red O (F) show lipid-laden adipocytes. G: Time course of adipocyte appearance in over 200 zebrafish kept at the same density (10 fish/L) and fed the same amount of food. Every fish at each time point was measured for standard length (SL). Serial paraffin sections were H&E stained and scored for adipocytes. Fish where WAT was observed in any depot are represented in black dots and fish lacking any WAT are represented in white dots. Scale bar = 100 μm in A; 50 μm in B.
Fig. 4.
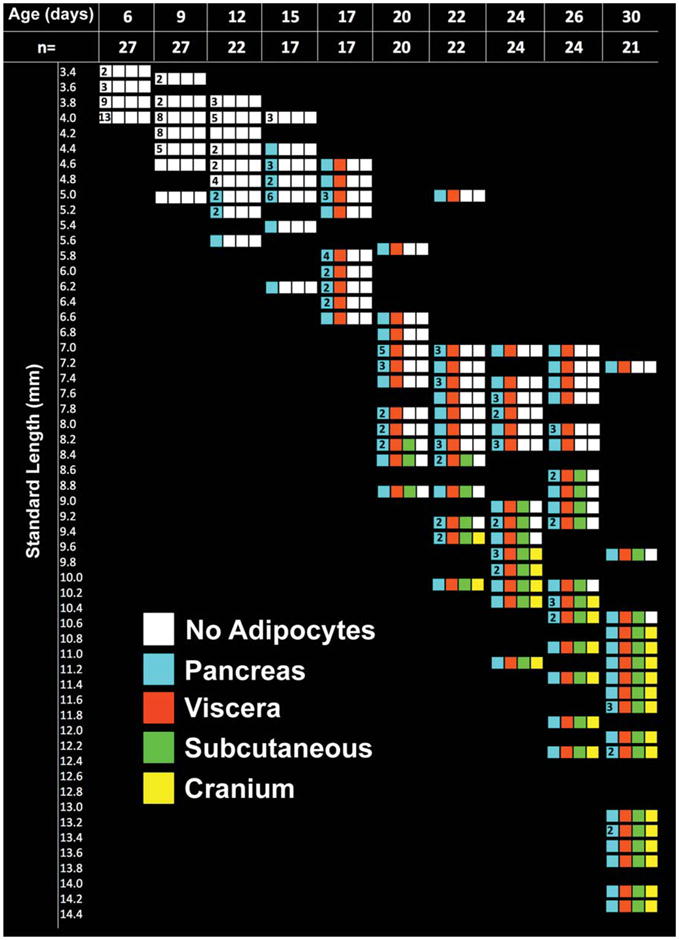
Adipocytes develop in zebrafish larvae in a size-dependent and time-dependent manner. Time course of zebrafish adipocyte appearance in larvae from 6 to 30 days postfertilization (dpf). Each horizontal strip of four boxes indicates fish at the indicated standard length (SL). If a strip lacks a number in the left-most box, this indicates that a single fish was scored at that age and size. The number in the left most box indicates multiple fish of the same SL on the indicated day were scored. The number of fish scored at each age is indicated by the boxes labeled “n”. The presence of WAT at each anatomical location is indicated by a colored box: pancreatic (blue boxes), visceral (orange boxes), subcutaneous (green boxes), or cranial (yellow boxes). White boxes indicate no adipocytes were seen in the four prospective locations: pancreatic, visceral, subcutaneous, and cranial. Adipocytes appear in zebrafish larger than 5.0 mm in length verified by chi-square goodness-of-fit test, P < 0.01. Pancreatic adipocytes begin to appear in the largest fish at 12 dpf, visceral at 17 dpf regardless of size, subcutaneous at 20 dpf in fish larger than 8.2 mm, and cranial at 22 dpf in fish larger than 9.4 mm verified by chi-square goodness-of-fit test, P < 0.01.
These data demonstrate that in adult zebrafish, adipocytes reside in WAT, that they store lipid in a unilocular droplet, are morphologically identical to mammalian adipocytes and that they express adipokines and other genes that regulate adipocyte formation and function. Additional studies are needed to determine whether all adipose stores express the same genes, however, the notorious difficulty of staining the thin adipocyte cytoplasm (Guo et al., 2007) may limit such studies.
WAT Development First Occurs in the Pancreatic Depot
The zebrafish embryonic period comprises 0–3 dpf, after which the free-swimming larvae becomes a juvenile by approximately 30 dpf, and becomes a sexual mature adult by ~3 months of age. The skeleton, head shape, fins, pigment, scales, lateral line and swim bladder develop de novo or undergo extensive morphogenesis during post-embryonic zebrafish development (Parichy et al., 2009). With the notable exceptions of gonads, however, most organs are formed in zebrafish during the embryonic period. Despite the robust expression of several adipocyte markers during embryogenesis (Lyons et al., 2001; Gorissen et al., 2009; Li et al., 2010; Supp. Fig. S4), we examined over 25 larvae from 3–5 dpf both in our collection and using the Zebrafish Atlas (http://zfatlas.psu.edu/index.php) and were surprised at a complete lack of any morphologically identifiable adipocytes. Oil red O staining of 5 dpf larvae (Supp. Fig. S1B) clearly shows that lipid is present in many tissues at this stage, including a massive store in the yolk and minor accumulation in hepatocytes (Sadler et al., 2005), within blood vessels, skeletal myocytes, chondrocytes in the jaw (Li et al., 2010), and neuronal tissue in the brain. However, we did not find adipocytes at any of these sites using histological analysis (not shown).
We next carried out a time course to determine when and where adipose tissue can first be identified in zebrafish. To avoid potential false negatives that can be achieved by using a single gene as a marker for differentiated adipocytes, the same criteria used to identify WAT on H&E stained adult tissue sections was used on serial sections through the entire larvae. Scoring also relied on observing at least two adjacent cells on at least three serial sections. This assay is highly specific at the expense of sensitivity, as it is unlikely to identify WAT composed of less than three adipocytes and it will not identify pre-adipocytes.
The study was carried out by raising a single clutch distributed equally among five separate tanks that were fed identically. At each time point, a single tank was collected, the standard length (SL) of each fish was measured from the tip of the nose to the caudal peduncle and they were then fixed and processed through paraffin, sectioned and stained with H&E. In one cohort, fish over 20 dpf were also weighed and we found a linear weight-length ratio between 20 and 30 days (Supp. Fig. S5). Thus, as suggested by Parichy et al. (2009), SL is a reliable assessment of fish size and all measurements described in this study are for SL. Consecutive 4-μm sagittal sections obtained through each fish were stained with H&E and scored for the appearance of WAT according to the criteria described above. In total, 426 fish were serial sectioned and over 10,000 sections were analyzed.
No adipocytes were observed in larvae on 6 or 9 dpf (Fig. 3A,B). Adipocytes appeared in some 12 dpf larvae in the pancreas (Fig. 3C,E,F). If adipogenesis is triggered by a developmental cue, as is the case with most organs in zebrafish which develop during embryogenesis, it should be detectable in all fish at the same developmental stage. Alternatively, if WAT development is like the fins or scales that develop during the post-embryonic period (Parichy et al., 2009), then it will correspond with SL. We first identified adipocytes in 5 of 22 fish examined on 12 dpf fish (Fig. 3G, dark circles on 12 dpf). In these fish, adipocytes were only in the pancreas. This is consistent with another study using Nile Red staining to detect neutral lipid droplets in vivo in which the first lipid stores were observed between 8 and 15 dpf in the pancreas (Flynn et al., 2009).
WAT Development Does not Occur Synchronously in all Fish of the Same Age
Postembryonic development is influenced by environmental and metabolic factors and some aspects may also be regulated by a developmental clock, as are most events during zebrafish embryogenesis. Zebrafish typically vary greatly in size. In our study, larvae were maintained at a relatively low density to maximize access to food, yet we also still found a significant variance in SL after 9 dpf, and the range increased as the fish got older (Fig. 3F, Supp. Fig. S5). The SL ranges we found are similar to those described by Parichy et al. (2009) in a study where fish were raised in single tanks, indicating that genetics, not social interactions that limit access to food, likely contributes to variation in size.
One possibility is that during the larval period, all consumed energy is used to increase the total mass of the fish, but that when a target size is reached, then the ability to store excess energy may be required and hence adipocytes develop and the number of WAT depots also expand. This hypothesis predicts that (i) adipocyte development in zebrafish is dependent on size, not age, and that (ii) additional sites of WAT form as the size of the fish increases.
Our data support this hypothesis. Adipocytes are observed first in only the largest fish at 12 dpf (over 4.8 mm; Fig. 3G). If WAT development in zebrafish is dependent on size, then all zebrafish over 4.8 mm should have adipocytes. We examined 226 fish ranging from 6–30 dpf with a SL range of 3.4–14.2 mm (Fig. 3G). All fish with a SL exceeding 5 mm have adipocytes and all fish 4.2 mm SL or smaller do not. A chi-square test of goodness-of-fit examining whether adipocytes were equally distributed regardless of fish SL yielded a P value of <0.01. Thus, initial development of adipocytes correlates with SL, not age.
Interestingly, some fish between 4.2 and 5 mm have adipocytes, and some do not. Those that do, however, tend to be older: i.e., on 12 dpf, the four fish that are 4.8 mm do not have adipocytes, whereas the two fish of the same SL on 15 dpf do have pancreatic adipocytes. Therefore, it is likely that size is not the only factor determining when adipocytes appear, and some intrinsic temporal cue may also contribute to the signal for adipocyte development. A similar variability has been described for other traits that develop in the postembryonic period in zebrafish (Parichy et al., 2009).
The remarkable consistency in which all fish that are the same SL at the same age have the exact same adipocyte distribution points to the technical accuracy of our method. We measured the average adipocyte diameter in 12 dpf fish to be 25 μm. Consecutive 4-μm sections were analyzed, so that each adipocyte should be present in at least 6 sections. Although it was not possible to recover every section, over 90% of all sections were collected and analyzed; in no case were six serial sections discarded. Therefore, the failure to detect adipocytes in some 12 dpf fish cannot be attributed to a technical limitation of our method.
Analysis of the data from 12 and 15 dpf larvae supports two conclusions: (i) adipocytes form only in the largest fish of a given age and (ii) as the larvae age, even smaller fish form WAT so that by 17 dpf, all fish have adipocytes, regardless of size (Fig. 3G, see 4.4 to 4.8 mm fish at 15 dpf compared with same sized fish at 9 and 12 dpf). Thus, WAT formation is first determined by the size of the fish and as the fish get older, temporal cues signal WAT development, even in small fish.
The Site of WAT Development Is Regulated Both by Size and Developmental Time
In our analysis of the youngest larvae in which WAT was detected (12 dpf), adipocytes were only found in the pancreas, indicating that formation of other WAT depots occurs later in development. We next asked whether WAT appears in specific sites based on a developmental clock or, if like pancreatic adipocytes, development of other depots correlate with SL.
The sites selected to assess WAT appearance during development were the same WAT stores seen in the adult zebrafish. Each fish was assessed using the previously described histological criteria for WAT in four distinct locations: pancreatic, visceral, cranial and subcutaneous. Pancreatic adipocytes were identified as intertwined with acinar cells, visceral adipocytes were cells posterior to the swim bladder and lining the peritoneal cavity, subcutaneous adipocytes are in between muscle and the dermis at any location along the periphery of the fish, and cranial adipocytes are in clusters lining the ventral wall of the cranium between the brain and the muscular layers of the esophagus. These depots are all clearly observed in the 3-month-old fish in The Zebrafish Atlas (http://zfatlas.psu.edu). Between 17 and 27 fish were examined per time point, and all fish were maintained in identical conditions, as described above.
Figure 4 displays our findings. Fish are arrayed according to developmental age (x-axis) and SL (y-axis). Each strip of four boxes represents the four different adipose stores analyzed: blue corresponds to pancreatic, orange to visceral, green to subcutaneous, and yellow to cranial. White boxes indicate no adipocytes were identified in the four adipose stores. The total number of fish analyzed for each age is indicated on the x-axis (n). The number in the first box of each strip of boxes represents the number of zebrafish at the same length; boxes without a number indicates a single zebrafish.
As found in 5 dpf larvae (not shown), there are no discernable adipocytes present at 6 or 9 dpf (all white boxes; also see Fig. 3). Pancreatic adipocytes appear at 12 dpf only in the largest zebrafish (5 mm SL and above). This demonstrates that early WAT formation correlates with zebrafish size. At 15 dpf, pancreatic WAT was found in fish that were 4.4 mm and longer; no other WAT stores were present. However, at 17 dpf, every fish has both pancreatic (blue boxes) and visceral (orange boxes) WAT. Because some of these 17 dpf fish were smaller (4.6 and 4.8 mm SL) than 15 dpf which lack visceral adipocytes, we conclude that development of visceral WAT depends on fish age, not size.
Subcutaneous WAT (green boxes) and cranial adipocytes (yellow boxes) appear in a size-specific manner. Subcutaneous WAT appeared at 20 dpf in only fish greater than 8.2 mm SL, and cranial WAT appeared at 22 dpf only in zebrafish larger than 9.4 mm SL. Chi-square analysis indicates an unequal distribution of adipocytes at these lengths at their respective time points (P < 0.01). As the fish age, they add more sites until 30 dpf, when the fish are termed juveniles, and they had WAT depots at all of the sites found in adults (Fig. 4).
In summary, these data indicate that: (i) WAT development in different locations occurs in a step wise manner, with pancreatic first, visceral second, subcutaneous third and cranial fourth, (ii) the development of visceral WAT is regulated by age, whereas (iii) the development of pancreatic, cranial, and subcutaneous WAT is dependent on size. However, fish that are very small for their age did not have all of the WAT depots of their larger siblings. Thus, both size and developmental cues regulate adipose development.
WAT Development Can Be Accelerated by Increasing Larvae Size
To further analyze the relationship between developmental time and fish size in the appearance of WAT, we manipulated the size of the fish at a fixed developmental time point by changing the density at which they were raised. A single clutch was raised in two 3-L tanks. One tank held fish at a similar density to the study displayed in Figure 4 (20 fish; labeled “high”) and the other held 10 fish (labeled “low”). Both tanks were fed as described above; however, to maximize the size difference, the low density tank received two supplemental brine shrimp feeds daily between 10 and 20 dpf. At 20 dpf, all fish were collected, SL was measured, and they were processed for paraffin sectioning and scored for adipocytes in the pancreatic, visceral, subcutaneous, and cranial depots. We compared the fish in this cohort with those of a similar age that were reared at high density and analyzed in Figure 4 (labeled with an asterisk).
If WAT development is regulated by size, then fish which are larger due to rearing at a low density should have a pattern of adipose stores found in older fish reared at high density. Fish reared at high density ranged in SL between 6.6 and 9 mm at 20 dpf (Fig. 5, 20-high column). In these fish, subcutaneous adipocytes were seen only in the fish between 8 and 9 mm SL, identical to the finding in the previous cohort (Fig. 5, 20-high* column). As expected, siblings that are the same age but reared under conditions to maximize growth are bigger (SL range from 7.6 mm to 9.6 mm; Fig. 5, 20-low). In the previous cohort where fish were reared at high density, cranial adipocytes were first seen in 22 dpf fish exceeding 8.8 mm SL (Fig. 5, column 20-high*). Importantly, we found cranial adipocytes in 8 fish reared at low density on 20 dpf, but in none of their siblings raised at high density. This indicates that WAT development can be manipulated by altering fish size or rate of growth.
Fig. 5.
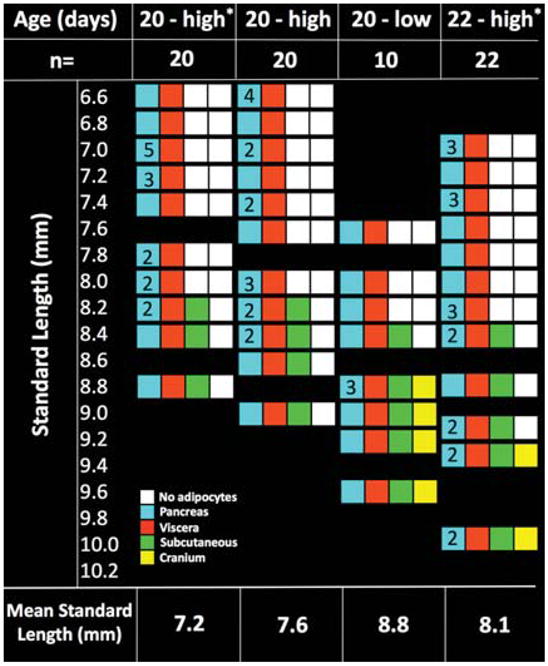
Cranial adipocytes appear in a size-dependent manner. Fish size was manipulated by rearing them at two densities. Two cohorts were used. In the first cohort labeled with asterisks, all fish were reared with ~ 20 fish/3 L tank (high density) and collected at 20 and 22 days postfertilization [dpf]). The second cohort was reared either at 20 fish/30 L (high density) or 10 fish/30 L (low density) and all were collected on 20 dpf. Those at low density received more food than the high density fish. All fish in each tank were collected, measured, serial sectioned, and scored for pancreatic (blue boxes), visceral (orange boxes), subcutaneous (green boxes), or cranial (yellow boxes) white adipose tissue (WAT) stores. Low density fish on 20 dpf were bigger (8.8 mm standard length [SL]) than their siblings raised at a higher density (7.6 mm SL). None of the 20 dpf raised at high density (20-high* and 20-high) developed cranial adipocytes, 8 of 20 of their siblings reared at low density (20-low) did. This pattern of adipocyte depot distribution resembles older fish raised at a higher density (22-high). This suggests that cranial adipocyte formation can be influenced by manipulating fish size.
In summary, we found that WAT first appears at 12 dpf in the pancreas. Pancreatic WAT stores appear first in a size-dependent manner, and then later is time-dependent. Subcutaneous and cranial WAT stores follow, and their development is largely regulated by the size of the fish, while visceral WAT instead develops due to a temporal cue.
DISCUSSION
Adipocytes play a vital role in metabolism and energy homeostasis. It is, therefore, possible that, unlike other organs that develop at precise developmental times, adipogenesis may occur in response to metabolic demands. Moreover, different adipose depots are proposed to have different functions associated with diabetes and liver diseases resulting from obesity. Developmental and metabolic factors may play differential roles in the formation of different WAT depots. Aside from one elegant study that identified mouse adipocyte precursors in vivo (Rodeheffer et al., 2008), extensive studies on the molecular pathways required for adipocyte differentiation have been carried out primarily in vitro. Thus, a new in vivo system for studying adipogenesis is needed.
The attributes of zebrafish for developmental studies make this an excellent system to define the molecular and physiologic factors that regulate adipogenesis. Here, we define the development of WAT in zebrafish and report the interesting findings that (i) different WAT depots do not develop simultaneously and that (ii) the development of some WAT depots is dictated by fish size. This suggests that the metabolic demands may regulate adipogenesis.
We used histology as a highly specific method to identify WAT, with the accepted limitation that adipocyte progenitors, clusters of small adipocytes, or single adipocytes will not be identified. We found WAT first appeared in zebrafish larvae at 12 dpf intermingling with pancreatic acinar cells, and subsequently form in the viscera, subcutaneous, and cranial regions. Interestingly, another study that used Nile Red staining for lipid accumulation to chronicle zebrafish adipogenesis also concluded that adipocytes first form in the pancreas (Flynn et al., 2009). Fatty infiltration of the exocrine pancreas is not likely to be a pathological condition in fish, as it is in humans, because fatty pancreas is observed in virtually all adult zebrafish, although the ratio of adipose tissue to pancreatic acini varies from fish to fish. It is not yet clear whether the adipocytes and pancreatic acinar cells originate from a common progenitor. Mesenchymal stem cells isolated from the mouse pancreas can differentiate into adipocytes in vitro (Seeberger et al., 2006) and an in vivo study in mice found pancreatic acinar cells can trans-differentiate into adipocytes when the oncogene c-Myc is depleted (Bonal et al., 2009). Therefore, it is possible that the appearance of adipocytes in the exocrine pancreas could point to a common precursor.
Adipocytes can be derived from mesodermal (mesenchymal cells) or ectodermal (neural crest cells) origins. It is possible that adipocytes of the trunk and appendages may be of mesodermal origin, but those of the head may be derived from neural crest cells. A recent study in zebrafish finds that lipid accumulates in the region of the jaw that encompasses the ceratohyal in 5 dpf zebrafish larvae; retinoic acid treatment and pparγ activation enhances lipid in this region and diminishes chondrogenesis (Li et al., 2010). The authors conclude that osteoclasts and adipocytes originate from a common neural crest precursor; however, whether the lipid containing cells described in this study are indeed adipocytes requires further analysis.
In humans, adipocyte formation occurs step-wise, with differentiated adipocytes first observed in the head, then the trunk, and finally the appendages (Poissonnet et al., 1984). Our findings show that zebrafish are similar. Adipocytes appear first in the pancreas, and then in the viscera, subcutaneous tissue, and finally in the cranium during larval development. Thus, not all adipose depots develop synchronously, and it is possible that different factors regulate their formation at different sites. This is relevant to the well-established phenomenon that expansion of visceral WAT is associated more frequently with diabetes and fatty liver disease compared with subcutaneous WAT (Schaffler et al., 2005). Whether different origins of these two adipose depots can explain the differential contribution to pathology has not been explored due to lack of a suitable in vivo model. Development of visceral adipose tissue in zebrafish appears to be completely regulated by developmental time: all fish 17 dpf or older have visceral fat, regardless of their size. This suggests that a developmental clock controls visceral adipose development, similar to the development of virtually all other organs studied in zebrafish. In contrast, subcutaneous WAT is only found in fish that with a SL exceeding 8.2 mm, regardless of age. Therefore, the development of the subcutaneous WAT depot may depend on metabolic demands or physiologic factors that occur only when fish reach a critical size. This is similar to several other features that develop within the larval zebrafish stage. The pancreatic and cranial adipocyte stores appear to be influenced by both time and size. This suggests that, at some point in postembryonic development, a temporal cue over rides the size restriction, so that all fish that pass a developmental time point will acquire age-appropriate features. This is reflected in the findings of Parichy et al. (2009), who report that fish that are small due to being reared at high density or adverse conditions can still achieve developmental milestones.
In this study, we verified zebrafish as a model for studying adipogenesis in vivo, as adipocytes in this system are morphologically identical to mammals, and they express acrp30, cfd, and fabp11a as a marker of definitive, differentiated adipocytes. Using cell morphology, we found that adipocyte development is based both on size-dependent and temporal mechanisms. We also demonstrate that all adipocytes do not form simultaneously. Two possibilities may explain how WAT forms at unique sites: (i) preadipocytes are deposited at the site of future adipose stores, and the accumulation of excess lipid triggers them to divide and differentiate, or (ii) preadipocytes settle or are derived from adjacent mesenchyme or neural crest cells in the place which forms the first WAT depot, and then circulate to deposit in future WAT sites. The zebrafish will be an important in vivo model to study adipogenesis and future studies will determine adipogenic precursors, how these adipogenic precursors lead to the formation of different adipose stores in a developing organism, and the genes that regulate the formation of these different WAT stores in vivo.
EXPERIMENTAL PROCEDURES
Animal Husbandry
TAB14 fish were maintained using standard procedures in accordance with the Mount Sinai Institutional Animal Care and Use Committee. For the first study, fish from a single clutch were separated on 5 dpf into groups of 35 and raised in 3L tanks (Aquatic Habitats). They were fed a larval food supplement (Zeigler AP100) three times daily plus one drop of decapsulated brine shrimp drop twice daily from 6 to 15 dpf. From 15 dpf onward, they were fed exclusively decapsulated brine shrimp three times daily. Excess food was removed daily and all tanks received the same amount of food. Density can affect fish growth, therefore, we controlled the density by redistributing to 25 fish per 3L tank on 14 dpf. All fish in a tank were counted and harvested at each time point from 20–30 dpf. Some fish loss occurred, and, therefore, the number of fish analyzed on each time point is not the same as the number put in the tank on 5 dpf. The study was repeated on a second clutch from the same TAB14 parents where fish were collected at times points between 6 and 17 dpf. At each time point, fish from a single tank were killed by Tricane-S (Western Chemical MS-222) overdose and the SL was measured from tip of the nose to the caudal peduncle. All measurements reported are SL; we did not note any other features which would have allowed assigning standardized standard length (Parichy et al., 2009). Twenty- to 30-dpf were wiped dry and weighed on a Mettler AE 50 balance to the nearest milligram.
Histology
Fish were fixed in Bouin’s fixative solution (RICCA Chemical Company 1120-32) overnight, washed in phosphate buffered saline (PBS) + 0.1% Tween (PBS-T), and then dehydrated to 100% methanol. They were then rehydrated to PBS-T and embedded in Histogel (Thermo Scientific HG-4000-013), fixed in 4% paraformaldehyde at room temperature, and dehydrated in 70% ethanol overnight at 4°C. Fish at ages 12–17 were not embedded in Histogel and were instead fixed in Bouin’s fixative, washed in PBS-T, and then dehydrated into 70% ethanol. All samples were sequentially dehydrated to 100% ethanol, xylene, paraffin, and embedded in paraffin as previously described (Sabaliauskas et al., 2006). Four-micron serial sections were stained with hematoxylin and eosin by sequentially rehydrating slides in ethanol to water, stained with hematoxylin, washed in running tap water, stained with eosin, washed in running tap water, then sequentially dehydrated to xylene and mounted using Cytoseal (Stephens Scientific 5310-16).
Oil red O staining was carried out on cryosections. Fish were fixed in Bouin’s fixative solution overnight at 4°C, washed in PBS and equilibrated in 30% sucrose/PBS overnight at 4°C, washed in PBS, and embedded in OCT (Tissue-Tek 4583). Cryosections were cut at thirty microns for adult fish and 10 microns for juveniles on Superfrost slides (Fisher Scientific 12-550-15). Consecutive sections were paired on adjacent slides; one slide in each pair was stained with oil red O and the other in hematoxylin and eosin. Oil red O staining was carried out as described as described (Sadler et al., 2005). All sections were imaged on an Olympus BX41 Clinical Microscope using a Nikon DS-Ri1 digital camera.
Criteria for Adipocyte Identification in Paraffin Sections
Adipocytes were identified as possessing the three standard morphological characteristics of an adipocyte: central vacuolated area where lipid is stored, thin cytoplasmic walls, and pericentral nucleus. Identified adipocytes must be present on three consecutive sections, and at least two adipocytes per section. The vacuolated center of each identified adipocyte could not contain any blood cells, distinguishing them from blood vessels.
In Situ Hybridization
The antisense digoxigenin-labeled RNA probe was prepared for cfd (NM_001 020532.1) and acrp30 (NM_0010454 25.1) as follows. cDNA from 5 dpf larvae was amplified using the gene-specific primers listed in Table S1. These amplify base pairs of the coding sequences 245-642 for cfd and 117-1020 for acrp30, respectively. Each fragment was cloned into a TOPO TA dual promoter PCRII vector (Invitrogen) and was sequenced to confirm identity. Sense and antisense probes were synthesized using T7 and SP6 from the DIG-RNA labeling kit (Roche 11-175-025-910). Thirty-micron cryosections were obtained from adult (older than 12 months) fish, and Consecutive sections were collected on adjacent slides to compare in situ results with oil red O staining.
Hybridization of each probe (1 μg/mL) was carried out by adding 30 μl to each section and covering with parafilm at 65°C for 16–20 hr. Slides were washed three times in a solution containing 1× standard saline citrate, 50% formamide, and 0.1% tween-20 at 65°C followed by washing with maleic acid buffer (MAB; 150 mM Maleic Acid 100 mM NaCl/0.1% Tween-20/pH 7.5) four times at room temperature. Slides were blocked with MAB with 2% blocking reagent (Roche), 0.1% tween-20 and 20% heat inactivated lamb serum for 3 hr in the dark at room temperature. Anti-digoxigenin antibody (Enzo 1093274; 1:5,000) was added to the blocking solution and incubated overnight at room temperature in the dark. Slides were washed with MAB and 0.1% tween-20 6× 30 min at room temperature, stained at 37°C overnight with the 0.1 M sodium chloride/0.1 M Tris pH 9.5/0.05 M magnesium chloride/0.1% tween-20 supplemented with 50 μL NBT/37 μL BCIP (Roche). The reaction was stopped by washing with PBS/0.1% tween-20. Coverslips were mounted using Vectashield (Vector Laboratories).
PCR
Visceral fat, liver, and pancreas were dissected from three to five adult fish and pooled for RNA isolation using the Qiagen RNeasy kit. Three different batches of fish were used as replicates, with equal numbers of male and female fish in each batch. cDNA was synthesized using Qscript (Quanta Biosciences 95082) with poly dT primers. Quantitative PCR (qPCR) was performed in triplicate using Roche Sybergreen on the Roche Light-Cycler. Ct values for target genes were normalized against ribosomal protein P0 (rpp0), and expression was calculated by the ΔCt method. Melting curves for each amplicon was analyzed to ensure specificity. Primer sequences are displayed in Table S1.
Supplementary Material
Acknowledgments
We thank Christopher Monson for the drawing in Figure 1S, to S. Friedman and R. Krauss for helpful discussions, to N. Mall for histology instructions, and to M. Baron, B. Hanss, and C. Mobbs for critical reading of the manuscript. D.I. was supported in part by the Medical Scientist Training Program and by the Training Program in Cellular and Molecular Biology; additional support was provided to K.C.S. by the American Gastroenterological Association Research Scholar Award and the NIAAA.
Grant sponsor: American Gastroenterological Association; NIAAA; Grant number: 1RO1AA018886-01; Grant sponsor: NIGMS; Grant number: T32GM08633.
Footnotes
Additional Supporting Information may be found in the online version of this article.
References
- Agarwal AK, Garg A. Genetic disorders of adipose tissue development, differentiation, and death. Annu Rev Genomics Hum Genet. 2006;7:175–199. doi: 10.1146/annurev.genom.7.080505.115715. [DOI] [PubMed] [Google Scholar]
- Billon N, Iannarelli P, Monteiro MC, Glavieux-Pardanaud C, Richardson WD, Kessaris N, Dani C, Dupin E. The generation of adipocytes by the neural crest. Development. 2007;134:2283–2292. doi: 10.1242/dev.002642. [DOI] [PMC free article] [PubMed] [Google Scholar]
- Bonal C, Thorel F, Ait-Lounis A, Reith W, Trumpp A, Herrera PL. Pancreatic inactivation of c-Myc decreases acinar mass and transdifferentiates acinar cells into adipocytes in mice. Gastroenterology. 2009;136:e309–e319. doi: 10.1053/j.gastro.2008.10.015. [DOI] [PubMed] [Google Scholar]
- Bruce KD, Hanson MA. The developmental origins, mechanisms, and implications of metabolic syndrome. J Nutr. 2010;140:648–652. doi: 10.3945/jn.109.111179. [DOI] [PubMed] [Google Scholar]
- Cali AM, Caprio S. Obesity in children and adolescents. J Clin Endocrinol Metab. 2008;93:S31–S36. doi: 10.1210/jc.2008-1363. [DOI] [PMC free article] [PubMed] [Google Scholar]
- Cortes-Canteli M, Pignatelli M, Santos A, Perez-Castillo A. CCAAT/enhancer-binding protein beta plays a regulatory role in differentiation and apoptosis of neuroblastoma cells. J Biol Chem. 2002;277:5460–5467. doi: 10.1074/jbc.M108761200. [DOI] [PubMed] [Google Scholar]
- Doane WW. Developmental physiology of the mutant female sterile(2)adipose of Drosophila melanogaster. I. Adult morphology, longevity, egg production, and egg lethality. J Exp Zool. 1960;145:1–21. doi: 10.1002/jez.1401450102. [DOI] [PubMed] [Google Scholar]
- Drori S, Girnun GD, Tou L, Szwaya JD, Mueller E, Xia K, Shivdasani RA, Spiegelman BM. Hic-5 regulates an epithelial program mediated by PPAR-gamma. Genes Dev. 2005;19:362–375. doi: 10.1101/gad.1240705. [DOI] [PMC free article] [PubMed] [Google Scholar]
- Flegal KM, Carroll MD, Ogden CL, Curtin LR. Prevalence and trends in obesity among US adults, 1999–2008. JAMA. 2010;303:235–241. doi: 10.1001/jama.2009.2014. [DOI] [PubMed] [Google Scholar]
- Flynn EJ, 3rd, Trent CM, Rawls JF. Ontogeny and nutritional control of adipogenesis in zebrafish (Danio rerio) J Lipid Res. 2009;50:1641–1652. doi: 10.1194/jlr.M800590-JLR200. [DOI] [PMC free article] [PubMed] [Google Scholar]
- Flynn MA, McNeil DA, Maloff B, Mutasingwa D, Wu M, Ford C, Tough SC. Reducing obesity and related chronic disease risk in children and youth: a synthesis of evidence with ‘best practice’ recommendations. Obes Rev. 2006;7(suppl 1):7–66. doi: 10.1111/j.1467-789X.2006.00242.x. [DOI] [PubMed] [Google Scholar]
- Gesta S, Bluher M, Yamamoto Y, Norris AW, Berndt J, Kralisch S, Boucher J, Lewis C, Kahn CR. Evidence for a role of developmental genes in the origin of obesity and body fat distribution. Proc Natl Acad Sci U S A. 2006;103:6676–6681. doi: 10.1073/pnas.0601752103. [DOI] [PMC free article] [PubMed] [Google Scholar]
- Gesta S, Tseng YH, Kahn CR. Developmental origin of fat: tracking obesity to its source. Cell. 2007;131:242–256. doi: 10.1016/j.cell.2007.10.004. [DOI] [PubMed] [Google Scholar]
- Gorissen M, Bernier NJ, Nabuurs SB, Flik G, Huising MO. Two divergent leptin paralogues in zebrafish (Danio rerio) that originate early in teleostean evolution. J Endocrinol. 2009;201:329–339. doi: 10.1677/JOE-09-0034. [DOI] [PubMed] [Google Scholar]
- Guo W, Bigornia S, Leizerman I, Xie W, McDonnell M, Clemente K, Pirtskhalava T, Kirkland JL, Gokce N, Corkey BE, Sullivan LM, Apovian CM. New scanning electron microscopic method for determination of adipocyte size in humans and mice. Obesity (Silver Spring) 2007;15:1657–1665. doi: 10.1038/oby.2007.198. [DOI] [PubMed] [Google Scholar]
- Kadereit B, Kumar P, Wang WJ, Miranda D, Snapp EL, Severina N, Torregroza I, Evans T, Silver DL. Evolutionarily conserved gene family important for fat storage. Proc Natl Acad Sci U S A. 2008;105:94–99. doi: 10.1073/pnas.0708579105. [DOI] [PMC free article] [PubMed] [Google Scholar]
- Karanth S, Denovan-Wright EM, Thisse C, Thisse B, Wright JM. The evolutionary relationship between the duplicated copies of the zebrafish fabp11 gene and the tetrapod FABP4, FABP5, FABP8 and FABP9 genes. FEBS J. 2008;275:3031–3040. doi: 10.1111/j.1742-4658.2008.06455.x. [DOI] [PubMed] [Google Scholar]
- Kuk JL, Saunders TJ, Davidson LE, Ross R. Age-related changes in total and regional fat distribution. Ageing Res Rev. 2009;8:339–348. doi: 10.1016/j.arr.2009.06.001. [DOI] [PubMed] [Google Scholar]
- Lago F, Gomez R, Gomez-Reino JJ, Dieguez C, Gualillo O. Adipokines as novel modulators of lipid metabolism. Trends Biochem Sci. 2009;34:500–510. doi: 10.1016/j.tibs.2009.06.008. [DOI] [PubMed] [Google Scholar]
- Li N, Kelsh RN, Croucher P, Roehl HH. Regulation of neural crest cell fate by the retinoic acid and Pparg signalling pathways. Development. 2010;137:389–394. doi: 10.1242/dev.044164. [DOI] [PMC free article] [PubMed] [Google Scholar]
- Lyons SE, Shue BC, Lei L, Oates AC, Zon LI, Liu PP. Molecular cloning, genetic mapping, and expression analysis of four zebrafish c/ebp genes. Gene. 2001;281:43–51. doi: 10.1016/s0378-1119(01)00774-0. [DOI] [PubMed] [Google Scholar]
- Parichy DM, Elizondo MR, Mills MG, Gordon TN, Engeszer RE. Normal table of postembryonic zebrafish development: staging by externally visible anatomy of the living fish. Dev Dyn. 2009;238:2975–3015. doi: 10.1002/dvdy.22113. [DOI] [PMC free article] [PubMed] [Google Scholar]
- Phinney DG, Prockop DJ. Concise review: mesenchymal stem/multipotent stromal cells: the state of transdifferentiation and modes of tissue repair--current views. Stem Cells. 2007;25:2896–2902. doi: 10.1634/stemcells.2007-0637. [DOI] [PubMed] [Google Scholar]
- Poissonnet CM, Burdi AR, Garn SM. The chronology of adipose tissue appearance and distribution in the human fetus. Early Hum Dev. 1984;10:1–11. doi: 10.1016/0378-3782(84)90106-3. [DOI] [PubMed] [Google Scholar]
- Rodeheffer MS, Birsoy K, Friedman JM. Identification of white adipocyte progenitor cells in vivo. Cell. 2008;135:240–249. doi: 10.1016/j.cell.2008.09.036. [DOI] [PubMed] [Google Scholar]
- Sabaliauskas NA, Foutz CA, Mest JR, Budgeon LR, Sidor AT, Gershenson JA, Joshi SB, Cheng KC. High-throughput zebrafish histology. Methods. 2006;39:246–254. doi: 10.1016/j.ymeth.2006.03.001. [DOI] [PubMed] [Google Scholar]
- Sadler KC, Amsterdam A, Soroka C, Boyer J, Hopkins N. A genetic screen in zebrafish identifies the mutants vps18, nf2 and foie gras as models of liver disease. Development. 2005;132:3561–3572. doi: 10.1242/dev.01918. [DOI] [PubMed] [Google Scholar]
- Schaffler A, Scholmerich J, Buchler C. Mechanisms of disease: adipocytokines and visceral adipose tissue--emerging role in nonalcoholic fatty liver disease. Nat Clin Pract Gastroenterol Hepatol. 2005;2:273–280. doi: 10.1038/ncpgasthep0186. [DOI] [PubMed] [Google Scholar]
- Seeberger KL, Dufour JM, Shapiro AM, Lakey JR, Rajotte RV, Korbutt GS. Expansion of mesenchymal stem cells from human pancreatic ductal epithelium. Lab Invest. 2006;86:141–153. doi: 10.1038/labinvest.3700377. [DOI] [PubMed] [Google Scholar]
- Song Y, Cone RD. Creation of a genetic model of obesity in a teleost. FASEB J. 2007;21:2042–2049. doi: 10.1096/fj.06-7503com. [DOI] [PubMed] [Google Scholar]
- Spalding KL, Arner E, Westermark PO, Bernard S, Buchholz BA, Bergmann O, Blomqvist L, Hoffstedt J, Naslund E, Britton T, Concha H, Hassan M, Ryden M, Frisen J, Arner P. Dynamics of fat cell turnover in humans. Nature. 2008;453:783–787. doi: 10.1038/nature06902. [DOI] [PubMed] [Google Scholar]
- Tchkonia T, Lenburg M, Thomou T, Giorgadze N, Frampton G, Pirtskhalava T, Cartwright A, Cartwright M, Flanagan J, Karagiannides I, Gerry N, Forse RA, Tchoukalova Y, Jensen MD, Pothoulakis C, Kirkland JL. Identification of depot-specific human fat cell progenitors through distinct expression profiles and developmental gene patterns. Am J Physiol Endocrinol Metab. 2007;292:E298–E307. doi: 10.1152/ajpendo.00202.2006. [DOI] [PubMed] [Google Scholar]
- Todorcevic M, Kjaer MA, Djakovic N, Vegusdal A, Torstensen BE, Ruyter B. N-3 HUFAs affect fat deposition, susceptibility to oxidative stress, and apoptosis in Atlantic salmon visceral adipose tissue. Comp Biochem Physiol B Biochem Mol Biol. 2009;152:135–143. doi: 10.1016/j.cbpb.2008.10.009. [DOI] [PubMed] [Google Scholar]
- Wasserman F. Handbook of physiology. Section 5: Adipose tissue. Washington DC: American Physiologicl Society; 1965. The development of adipose tissue; pp. 87–100. [Google Scholar]
- Wood WB. Determination of pattern and fate in early embryos of Caenorhabditis elegans. Dev Biol (N Y 1985) 1988;5:57–78. doi: 10.1007/978-1-4615-6817-9_2. [DOI] [PubMed] [Google Scholar]
- Yamasaki H, Sada A, Iwata T, Niwa T, Tomizawa M, Xanthopoulos KG, Koike T, Shiojiri N. Suppression of C/EBPalpha expression in periportal hepatoblasts may stimulate biliary cell differentiation through increased Hnf6 and Hnf1b expression. Development. 2006;133:4233–4243. doi: 10.1242/dev.02591. [DOI] [PubMed] [Google Scholar]
Associated Data
This section collects any data citations, data availability statements, or supplementary materials included in this article.