

Abstract
There is little information on early molecular events in the development of N-nitrosomethylbenzylamine (NMBA)–induced rat esophageal tumorigenesis and of the effects of chemopreventive agents on these events. In this study, we identified genes in rat esophagus that were differentially expressed in response to short-term NMBA treatment and modulated by cotreatment with phenylethyl isothiocyanate (PEITC). Rats were fed AIN-76A diet or AIN-76A diet containing PEITC for 3 weeks. During the 3rd week of dietary treatment, they were administered three s.c. doses of NMBA (0.5 mg/kg body weight). Rats were sacrificed 24 h after the last treatment; esophagi were excised and processed for histologic grading, microarray and real-time PCR analysis. Histopathologic analysis showed that treatment of rats with PEITC had a protective effect on NMBA-induced preneoplastic lesions in the rat esophagus. We identified 2,261 genes that were differentially expressed in the NMBA-treated versus control esophagi and 1,936 genes in the PEITC + NMBA versus NMBA-treated esophagi. The intersection of these two sets resulted in the identification of 1,323 genes in NMBA-treated esophagus, the vast majority of which were modulated by PEITC to near-normal levels of expression. Measured changes in the expression levels of eight selected genes were validated using real-time PCR. Results from 12 microarrays indicated that PEITC treatment had a genome-wide modulating effect on NMBA-induced gene expression. Samples obtained from animals treated with PEITC alone or cotreated with PEITC + NMBA were more similar to controls than to samples treated with NMBA alone.
Introduction
Esophageal cancer is the third most common gastrointestinal malignancy and the sixth most frequent cause of cancer death in the world (1). Squamous cell carcinoma is the predominant histologic subtype worldwide, and this disease has a high mortality rate (2, 3). Statistics indicate the insidious nature of this malignancy and support the need to develop improved treatment and preventive strategies. Chemoprevention can play an integral role in the overall strategy toward reducing the incidence of cancer, and is a potentially viable approach to reduce the risk of esophageal cancer in high-risk individuals (3).
Recent studies provide evidence that many daily consumed dietary compounds possess cancer-preventative properties (4, 5). These properties include the induction of cellular detoxifying and antioxidant enzymes, which protect against cellular damage, caused by carcinogens and endogenously generated reactive oxygen species. These compounds can also affect cell death signaling pathways, resulting in reduced proliferation of tumor cells. Because the process of cancer development comprises three different stages (i.e., initiation, promotion, and progression), many potential chemopreventive agents can be categorized broadly as blocking agents, which impede the initiation stage, or suppressing agents, which arrest or reverse the promotion and progression stages, presumably by affecting crucial factors that control cell proliferation, differentiation, senescence, and/or apoptosis (4). Numerous cancer cell lines and animal tumor models have been used to evaluate the chemopreventive effects and elucidate the mechanisms of cancer prevention by various phytochemicals, such as flavonoids from soybeans, isothiocyanates from cruciferous vegetables, resveratrol from grapes, curcumin from tumeric powder, and polyphenols from green and black tea (5, 6).
Isothiocyanates are potent inhibitors of carcinogenesis in rodents induced by a number of chemical carcinogens, including the esophageal carcinogen, N-nitrosomethylbenzylamine (NMBA; ref. 7). These compounds, including phenylethyl isothiocyanate (PEITC), are found at high levels in cruciferous vegetables such as watercress, garden cress, cabbage, cauliflower, and broccoli (8). Inhibition of P450 enzymes and induction of phase II enzymes, among other effects, have been implicated in the chemopreventive action of isothiocyanates (9, 10). The chemopreventive properties of PEITC in animal models have been extensively studied (7). PEITC is a potent inhibitor of lung tumor formation by 4-(methylnitrosamino)-1-(3-pyridyl)-1-butanone in mice and rats, esophageal tumor formation in rats treated with NMBA, and liver tumors in rats treated with N-nitrosodiethylamine (11–13).
Several investigations suggest that certain nitrosamine carcinogens present in tobacco smoke and in the diet are causative agents for esophageal squamous cell carcinoma in humans and in rodents (14–17). The sequence of histopathologic changes in esophageal squamous cell carcinoma development typically involves hyperplasia, mild to severe dysplasia, carcinoma in situ, and, finally, invasive carcinoma. Genetic events that accompany such changes frequently include disruption of cell cycle control in the G1 phase, activation of oncogenes, and inactivation of tumor suppressor genes (18). The rat esophagus, in which tumors can be induced by multiple nitrosamine carcinogens such as NMBA, has been used extensively for studies of the molecular mechanism(s) involved in the development of esophageal squamous cell carcinoma as well as for identification of chemopreventive agents for this disease (13, 19–21). NMBA requires cytochrome P450 enzyme (CYP)–dependent activation to induce tumors in the rat esophagus (15, 22–24).
In a typical F-344 rat esophagus bioassay, NMBA (0.25–0.5 mg/kg body weight) is administered s.c. either thrice a week for 5 weeks or once per week for 15 weeks (25). This treatment results in a 100% tumor incidence within 20 weeks after the first injection of NMBA. Most tumors at this point are classified histopathologically as papillomas. Several preneoplastic esophageal lesions, including simple hyperplasia, leukoplakia, and dysplasia, are also observed at 20 weeks. These lesions, which can be quantitated by routine histopathology, closely mimic lesions observed in the human esophagus; however, only dysplastic lesions are known to progress into carcinoma (26). We have reported that the conversion of preneoplastic lesions to papillomas in this model is accompanied by multiple molecular changes in oncogenes, suppressor genes, growth factors, growth factor receptors, cyclins, cell adhesion molecules, and cell signaling molecules (25). To date, however, there is little information on early molecular events that occur during treatment of the rat esophagus with NMBA, and whether these events can be modulated with chemopreventive agents. In the present study, DNA microarray analysis was used to identify genes in the rat esophagus that are differentially expressed in response to short-term NMBA treatment, and whether the expression of these genes can be modulated by PEITC. Our results suggest that PEITC treatment has a genome-wide modulating effect on NMBA-induced gene expression in the esophagus.
Materials and Methods
Chemicals
NMBA was purchased from Ash Stevens, Inc., and PEITC was from Aldrich Chemical Company.
Animals and diet
All experimental protocols were in accordance with NIH guidelines and approved by the Institutional Animal Care and Use Committee of The Ohio State University. The animals were housed and maintained as described before (23).
Experimental procedure
Rats were randomized into four experimental groups of nine animals each. Rats in groups 1 and 3 were placed on control AIN-76A diet and those in groups 2 and 4 were given AIN-76A diet plus 5 μmol PEITC. During the 3rd week of dietary treatment, group 1 (vehicle control) and group 2 (PEITC control) rats each received three s.c. injections of 20% DMSO in water (the vehicle for NMBA). During the same week, group 3 (NMBA control) and group 4 (PEITC + NMBA) rats were given three s.c. injections of NMBA (0.5 mg/kg body weight). All rats were sacrificed 24 h after the last NMBA treatment, and their esophagi were excised, opened longitudinally, and sectioned into two parts. One part was fixed for at least 24 h in buffered formalin and then placed in PBS for histopathologic studies. The other part was stripped of the submucosal and muscularis layers, added to 1 mL of TRIzol solution, quick frozen in liquid nitrogen, and stored at −80°C until extraction of RNA. Food intake and body weights were recorded weekly.
Histologic grading of NMBA-induced preneoplastic lesions
One-half of each formalin-fixed esophagus from six rats per group was cut into thirds and embedded in paraffin with the epithelium uppermost. Serial 4-μm sections were cut and mounted on Superfrost plus slides (Histotechniques Laboratories). An H&E-stained slide was made from each esophagus of animals in all groups and scanned at ×100 magnification. Each viewing field was categorized into one of three histologic categories: normal epithelium, epithelial hyperplasia, and low-grade dysplasia (12, 13).
RNA extraction
Total cellular RNA was isolated from frozen tissue using TRIzol reagent (Life Technologies), according to the manufacturer’s instructions, and cleaned using RNeasy Mini kit (Qiagen). The integrity of the RNA samples was checked by resolving the total RNA on an agarose gel and visualizing the 18S and 28S ribosomal bands after staining the gel with ethidium bromide. Samples were aliquoted and frozen at −80°C.
Microarray analysis
Further quality control checks of total RNA from each biological sample was made using an Agilent 2100 Bioanalyzer and the 6000 Nano Assay kit (Agilent Technologies), and analyzed for purity using a spectrophotometer; a 260/280 ratio in the range of 1.9 to 2.2 was considered acceptable. Samples having apparent degradation were excluded from the study. To account for biological variation, we used a pooling strategy to enable the inclusion of samples from numerous animals. Three replicate microarrays were completed for each of the four treatments (control, PEITC, NMBA, and PEITC + NMBA) for a total of 12 microarrays. Each microarray was hybridized using a pooled RNA sample, and each pool was created from equal amounts of total RNA from two or three independent RNA samples, representing individual animals. Each of these samples was obtained from a different animal, and no sample was included in more than one pool. This approach provides appropriate biological replication within the constraints of a limiting number of microarrays (27). In total, samples from nine animals per group were pooled for control, NMBA, PEITC, and PEITC + NMBA microarrays. To facilitate comparisons of gene expression across all treatments, we used a reference design in which each microarray was cohybridized with a common reference sample labeled with Cy3, and RNA from the treatment pool was labeled with Cy5. Stratagene’s Universal Rat reference RNA was used as the common reference in all microarrays. The microarrays used were Agilent Rat Whole-Genome oligonucleotide arrays (Agilent Technologies). Each array included 60-mer oligonucleotide probes for over 41,000 genes and transcripts.
Labeling and hybridization
An aliquot of 500 ng of total RNA from each pool was labeled using the Agilent Low RNA Input Fluorescent Linear Amplification Kit per the vendor’s protocol. Labeled cRNA was purified using a Qiagen RNeasy mini kit (Qiagen). For each hybridization reaction, 0.75 μg of Cyanine3-labeled cRNA and 0.75 μg of Cyanine5-labeled cRNA were mixed together and allowed to cohybridize on the array for 17 h at 60°C. After hybridization, the microarrays were washed in SSC, 0.005% Triton X-102 for 10 min at room temperature, then washed in 0.1× SSC, 0.005% Triton X-102 for 5 min on ice and dried according to Agilent’s protocol. Slides were immediately scanned with an Agilent G2565AA dual-laser scanner. Photomultiplier tube settings were at 100% for both channels. Tiff images were analyzed using Agilent feature extraction software (version 7.5) to obtain fluorescent intensities for each spot on the arrays. Local background subtraction was done for each feature (spot) on the arrays, and Linear&Lowess normalization was done on the background-subtracted intensity values (28). Features flagged as population outliers or saturated in both channels were excluded from further analysis. Log10 ratios representing gene expression relative to the common reference were derived for each probe on the array. All microarray data are available from the Gene Expression Omnibus database using series accession number GSE6917.3
Data analysis
Normalized data for each microarray was imported into Rosetta Resolver for analysis (version 5.1.0.1.23, Rosetta Biosoftware). ANOVA was done on log ratios using the Rosetta Resolver error model and weighting, as described by Weng et al. (29). One-way ANOVA was used to identify genes with a significant treatment effect. A P value cutoff of 0.001 was used to determine statistical significance in each treatment comparison, providing a false-discovery rate below 5% for each test. Statistically significant genes were further filtered to identify those with a minimum 1.5-fold change. Clustering and principal components analysis was done using GeneSpring GX version 7.2 (Agilent Technologies). Gene ontology and pathway analyses of differentially expressed genes were done using the Gene Ontology Consortium designations and DAVID (30, 31).4
Real-time PCR
Microarray results were confirmed by comparison with mRNA levels obtained by quantitative reverse transcription PCR using selected gene-specific primer pairs. Total RNAs checked for quality control was used for reverse transcription-PCR (RT-PCR) analysis. Comparative RT-PCR for Gst1a2 and proliferating cell nuclear antigen (Pcna) and mitogen activated protein kinase 6 (Mapk6) was done using SYBR green (Applied Biosystems). Primers for Gst1a2 (forward 5′-CAGGAGTGGAGTTTGATGAG-3′, reverse 5′-GCGATGTAGTTGAGAATGG-3′) and Pcna (forward 5′-GGACCTTAGCCATATTGGAG-3′, reverse 5′-TCTATGGACACAGCTTCCT-3′) were designed using PerlPrimer software and obtained on request (Integrated DNA Technologies). Mapk6 primers were obtained from SuperArray Bioscience Corp. Each sample was assayed in triplicate for each gene. Reverse transcription was carried out using 2 μg of total RNA following the protocol for the Taqman Reverse Transcription Master Mix (Applied Biosystems) and 100 ng of RNA converted into cDNA of each sample was used. Primer optimization was done to determine the minimum primer concentration giving the minimum threshold cycle (Ct). Primer optimization was accomplished using varying concentrations of forward and reverse primers and 100 ng of cDNA of Universal Rat Reference Sample (Stratagene), and 1× Sybr Green PCR Master Mix (Applied Biosystems). One hundred nanograms of cDNA of each sample, 1× Sybr Green PCR Master Mix, and primers in optimal concentrations were then used for the RT-PCR in a total reaction mixture of 25 μL. Assays were completed using the ABI Prism 7500 Sequence Detection System (Applied Biosystems). Initial setup for the thermal cycler conditions were 2 min at 50°C followed by 10 min at 95°C. After initial setup, 40 cycles were run with 15 s at 95°C followed by 1 min at 60°C. The expressions of genes of interest were normalized against internal control gene Rps11 (ABI Taqman).
Relative expression was calculated as 2−ΔΔCt, where ΔCt was determined by subtracting the average normalization Ct from the average target Ct value. The ΔΔCt was then obtained by the difference in ΔCt values for the control group versus treated group.
Results
Effect of PEITC on preneoplastic lesions in NMBA-treated rat esophagus
To determine the effects of dietary PEITC on microscopic NMBA-induced preneoplastic lesions, we used a histologic grading scheme as described (Fig. 1A; refs. 12, 13). The effects of vehicle, PEITC and NMBA alone, and PEITC in combination with NMBA, on the development of preneoplastic lesions were evaluated. Microscopic lesion data were compared using ANOVA followed by Tukey’s multiple comparison test (P < 0.01). The percentages of each viewing field exhibiting either normal epithelium, epithelial hyperplasia, or low-grade dysplasia in esophagi from vehicle control rats were 81%, 19%, and 0%, respectively; in the NMBA-treated group, 19%, 72%, and 9%, respectively; and in the PEITC + NMBA–treated group, 76%, 24%, and 0%, respectively. Esophagi treated with PEITC alone were histologically similar to vehicle controls. Combined treatment with PEITC + NMBA reduced the formation of NMBA-induced preneoplastic lesions (P < 0.01), suggesting a protective effect of dietary PEITC (Fig. 1B).
Figure 1.
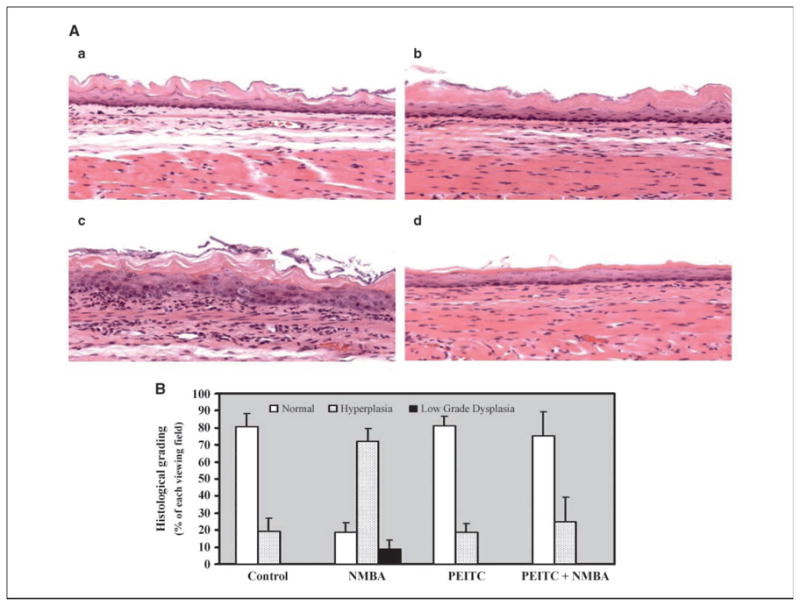
Effect of PEITC on NMBA-induced preneoplastic lesions in rat esophagus. Microscopic esophageal tissue sections (magnification ×100) stained with H&E. A, a, vehicle control; b, PEITC treated; c, NMBA treated (note extensive cytotoxicity and inflammatory response); d, NMBA + PEITC treated. B, percent of normal, hyperplasia, and low-grade dysplasia area in vehicle control, NMBA, PEITC, and NMBA + PEITC–treated esophagus.
Genes differentially expressed in response to dietary PEITC or NMBA and modulated by cotreatment with PEITC + NMBA
The effect of vehicle, PEITC, NMBA alone, and PEITC + NMBA on changes in gene expression in the esophagus were evaluated. Initially, we sought to identify genes that were differentially expressed in response to dietary PEITC alone. ANOVA was used to identify genes that were differentially expressed in PEITC-treated animals versus vehicle controls. Using replicate microarray data and a P value cutoff of 0.001, 832 genes were found to be differentially expressed in PEITC-treated esophagus (false discovery rate 4.9%). To reduce the false positives, we filtered this set of genes by selecting those that had a minimum 1.5-fold change. This resulted in the identification of 251 genes that were differentially expressed by dietary PEITC (Supplementary Table S1). To identify biological processes and molecular functions associated with this set of genes, we analyzed the set with DAVID and the lists were sorted by the DAVID P value (data not shown). In the list, the expression levels of three genes, all thioredoxin-related and associated with oxidative reductase activity, were markedly up-regulated in PEITC-treated esophagus (Table 1). This category of genes had a DAVID P value of 0.005, and their up-regulation may provide an elevated capability of the esophagus to respond to oxidative stress. Another gene category that was affected was “protein metabolism” (Table 1). This category included 17 genes, most of which were down-regulated. In contrast, protein tyrosine phosphatase receptor type E (PTPRE) was induced 8-fold. PTPRE inhibits events downstream of extracellular signal-regulated kinases (ERK), including transcriptional activation mediated by c-Jun (32). The list of 251 genes also contains numerous uncharacterized genes and expressed sequence tags (Supplementary Table S1).
Table 1.
Differentially expressed genes in PEITC-treated rat esophagus associated with oxidative reductase activity and protein metabolism
| Unigene | Reporter name | Gene symbol | Sequence description | NCBI gene ID | Accession | PEITC vs control, fold change |
|---|---|---|---|---|---|---|
| Thioredoxin-related genes | ||||||
| Rn.29777 | A_44_P559392 | Txn | Thioredoxin | 3197112 | BM389527 | 1.972 |
| Rn.44920 | A_44_P258855 | Qscn6 | Quiescin Q6 | 3206319 | NM_053431 | 1.807 |
| Rn.67581 | A_44_P554454 | Txnrd1 | Thioredoxin reductase 1 | 3207283 | NM_031614 | 1.537 |
| Protein metabolism–related genes | ||||||
| Rn.107819 | A_44_P170541 | Ptpre | Protein tyrosine phosphatase, receptor type, E | 114767 | XM_341950 | 8.03 |
| Rn.3841 | A_44_P537780 | Hsp27 | Heat shock 27 kDa protein | 24471 | BG375996 | 2.05 |
| Rn.94551 | A_44_P242664 | Psmb3 | Proteasome (prosome, macropain) subunit, β type, 3 | 29676 | AA859484 | 1.53 |
| Rn.119867 | A_44_P261874 | Hspca | Heat shock protein 1, α | 299331 | NM_175761 | −1.51 |
| Rn.55145 | A_44_P477785 | Eef2 | Eukaryotic translation elongation factor 2 | 29565 | NM_017245 | −1.52 |
| Rn.97889 | A_44_P262192 | Cct4 | Rattus norvegicus chaperonin subunit 4 (δ; Cct4) | 29374 | NM_182814 | −1.54 |
| Rn.10958 | A_44_P517591 | Eef2k | Eukaryotic elongation factor 2 kinase | 25435 | NM_012947 | −1.54 |
| Rn.92980 | A_44_P605733 | Rpl5 | Ribosomal protein L5 | 81763 | NM_031099 | −1.55 |
| Rn.12223 | A_44_P230712 | Rasa1 | RAS p21 protein activator | 25676 | NM_013135 | −1.56 |
| Rn.89756 | A_44_P1039856 | Rock1 | Rho-associated kinase β | 81762 | NM_031098 | −1.58 |
| Rn.6822 | A_44_P160550 | Capn2 | Calpain 2 | 29154 | NM_017116 | −1.61 |
| Rn.107726 | A_44_P355947 | Rpl3 | Ribosomal protein L3, mRNA (NM_198753) | 300079 | NM_198753 | −1.64 |
| Rn.90191 | A_44_P259979 | Jak1 | Similar to tyrosine-protein kinase JAK1 | 84598 | XM_342872 | −1.71 |
| Rn.93345 | A_44_P254283 | Map4k3 | Mitogen-activated protein kinase kinase kinase kinase 3 | 170920 | XM_343006 | −1.84 |
| Rn.88642 | A_44_P101644 | Rock2 | RhoA-binding serine/threosine kinase α (ROKα) | 25537 | NM_013022 | −2.06 |
| Rn.7687 | A_44_P1006977 | Lars | Rattus norvegicus leucyl-tRNA synthetase | 291624 | NM_001009637 | −2.10 |
| Rn.10484 | A_44_P111897 | Map2 | Microtubule-associated protein 2 | 25595 | NM_013066 | −5.69 |
Abbreviation: NCBI, National Center for Biotechnology Information.
Next, we applied ANOVA to identify genes that were differentially expressed in response to NMBA treatment only. Using replicate microarray data and a P value cutoff of 0.001, we identified 3,752 genes that were differentially expressed in response to NMBA. To further reduce false positives, we filtered this set of genes by selecting those that had a minimum 1.5-fold change. This resulted in 2,261 genes that were differentially expressed by NMBA treatment (Fig. 2A; Supplementary Table S2).
Figure 2.

PEITC modulates NMBA-induced changes in gene expression. A, gene expression profiles for 1,323 genes that are differentially expressed in response to NMBA treatment and also differentially expressed comparing NMBA to PEITC + NMBA treatment. B, data points reflect the mean value for three replicate arrays. Y axis, normalized gene expression levels in which the expression value for each treatment of a gene was divided by the average of all treatments for that gene. C, to provide a comparison of genome-wide expression changes for different treatments, we applied principal components analysis to all of the 12 microarrays used in the study. Each of the 12 microarrays used were clustered with the axes representing the first three principal components of gene expression, based on the expression of all 41,070 probes on the arrays. NMBA-treated samples ( ) are distinct in global gene expression whereas those samples treated with PEITC alone (
 ) or cotreated with PEITC + NMBA () are clustered near the vehicle controls (
 ).
).
The same approach was used to identify esophageal genes that were differentially expressed when comparing NMBA-treated samples to those treated with PEITC + NMBA. Using ANOVA with a P value ≤0.001, 3,615 genes were found to be differentially expressed in these two sets. Using a 1.5-fold change cutoff resulted in 1,936 genes that were differentially expressed (Fig. 2A; Supplementary Table S3). To identify genes that were differentially expressed in response to NMBA treatment and modulated by cotreatment with PEITC, we determined the intersection of the 2,261 genes found in the NMBA versus control comparison and the 1,936 genes from the PEITC + NMBA versus NMBA set. The intersection of these two sets resulted in 1,323 genes (Fig. 2A; Supplementary Table S4). Figure 2B shows the gene expression profiles for the 1,323 genes when viewed across the four treatments, including controls, using averaged data for treatment replicates. The Y axis represents normalized gene expression levels in which the expression value for each treatment of a gene was divided by the average of all treatments for that gene. The profiles revealed that NMBA treatment alone results in multiple large changes in gene expression, and that the vast majority of these genes are returned to near-normal expression levels in the animals treated with both PEITC and NMBA.
Because PEITC is known to influence the metabolism of NMBA, we attempted to identify the genes for phase I (CYPs) and phase II detoxifying enzymes that might be influenced by PEITC in NMBA-treated rat esophagus. Genes encoding for CYP2A2 and CYP3A13 were up-regulated 2-fold in esophagi treated with NMBA alone and down-regulated by treatment with PEITC (Table 2). Their expression in the esophagus of animals cotreated with PEITC + NMBA was comparable with vehicle. However, CYP2A2 and CYP3A13 have not been shown to be involved in NMBA metabolism in any tissue. We also noticed that the probe for Cyp2a2 was misannotated by the array manufacturer as it targets a region upstream of the coding sequence; thus, Cyp2a2 requires further validation. The expression of Cyp2a3, which has been reported to be involved in NMBA metabolism in rat esophagus, was not altered by treatment with NMBA. Several genes associated with glutathione S-transferase (GST) activities were down-regulated by NMBA treatment. Dietary PEITC up-regulated the expression of these genes, and cotreatment with PEITC + NMBA led to expression levels that were comparable with vehicle control (Table 2). PEITC treatment, therefore, restored normal levels of expression of these genes in NMBA-treated rat esophagus.
Table 2.
Differentially expressed genes in the esophagus of rats treated with NMBA, PEITC, or NMBA + PEITC and associated with phase I and phase II metabolizing enzymes “1”
| Unigene | Reporter name | Gene symbol | Sequence description | NCBI gene ID | Accession | NMBA FC | PEITC FC | NMBA + PEITC FC |
|---|---|---|---|---|---|---|---|---|
| Phase I–related genes | ||||||||
| A_44_P117389 | Cyp2a2 | Rat hepatic steroid hydroxylase IIA2 (CYP2A2) gene, exons 1 and 2 | 24895 | M33313 | 1.94 | −1.22 | −1.35 | |
| Rn.10489 | A_44_P1037342 | Cyp3a13 | Rattus norvegicus cytochrome P450, family 3, subfamily a, polypeptide 13 | 171352 | NM_147206 | 2.12 | 1.14 | 1.11 |
| Phase II–related genes | ||||||||
| Rn.1916 | A_42_P522857 | 221670_Rn | Expressed sequence tags, moderately similar to GST3_human microsomal glutathione S-transferase 3 (Homo sapiens) | 289197 | BF282898 | −3.70 | 1.14 | 1.07 |
| A_42_P531078 | 384436_Rn | R. rattus mRNA for glutathione transferase subunit 8 | X62660.1 | −3.25 | 1.00 | −1.32 | ||
| Rn.129343 | A_43_P23287 | BF566100 | Expressed sequence tags, weakly similar to glutathione S-transferase YC-2 (Rattus norvegicus) | 363205 | BF566100 | −10.03 | −1.29 | 1.01 |
| Rn.2460 | A_44_P1011898 | Gclm | Glutamate-cysteine ligase, modifier subunit | 29739 | NM_017305 | −2.04 | 1.24 | −1.31 |
| A_44_P491831 | Gst | Glutathione S-transferase Yc2 subunit (rats, fetal liver, mRNA, 1,129 nt) | S72506 | −1.91 | 1.73 | 1.22 | ||
| Rn.1692 | A_44_P254767 | Gss | Rattus norvegicus glutathione synthetase, mRNA | 25458 | NM_012962 | 1.66 | 1.04 | −1.03 |
| Rn.109452 | A_44_P369808 | GST13-13 | Rattus norvegicus glutathione S-transferase, mitochondrial, mRNA | 297029 | NM_181371 | −1.66 | 1.03 | −1.05 |
| Rn.10460 | A_42_P624195 | Gsta1 | Glutathione-S-transferase, α type (Ya) | 24421 | NM_031509 | −2.68 | 2.02 | 1.51 |
| Rn.40574 | A_43_P13967 | Gsta2 | Glutathione-S-transferase, α type (Yc?) | 24422 | NM_017013 | −3.54 | 1.99 | 1.97 |
| Rn.40574 | A_44_P109608 | Gsta2 | Glutathione-S-transferase, α type (Yc?) | 24422 | NM_017013 | −2.35 | 1.70 | 1.57 |
| Rn.87212 | A_44_P547801 | Gstt2 | Glutathione S-transferase, θ2 | 29487 | NM_012796 | −1.99 | 1.03 | 1.07 |
| Rn.87212 | A_44_P182008 | Gstt2 | Glutathione S-transferase, θ2 | 29487 | AA998545 | −1.64 | −1.00 | 1.06 |
| Rn.3561 | A_43_P12569 | Idh1 | Isocitrate dehydrogenase 1, soluble | 24479 | NM_031510 | −1.79 | −1.03 | −1.47 |
| Rn.1916 | A_44_P269544 | LOC289197 | Rattus norvegicus similar to microsomal glutathione S-transferase 3 (LOC289197), mRNA | 289197 | XM_213943 | −4.47 | 1.05 | 1.09 |
| Rn.127912 | A_44_P227286 | LOC314570 | Rattus norvegicus similar to glutathione S-transferase 8 (GST8-8; chain 8; GST class-α; LOC314570) | 314570 | XM_234810 | −2.89 | 1.09 | −1.25 |
| Rn.112146 | A_44_P380218 | LOC366653 | Rattus norvegicus similar to glutathione S-transferase 8 (GST8-8; chain 8; GST class-α; LOC366653) | 366653 | XM_345684 | −3.99 | 1.01 | −1.27 |
| Rn.2580 | A_44_P283561 | Mgst1 | Rattus norvegicus microsomal glutathione S-transferase 1 | 171341 | NM_134349 | −1.54 | 1.28 | −1.09 |
| A_44_P609586 | TC516234 | GST3_human microsomal glutathione S-transferase 3 (microsomal GST-III). (Homo sapiens), partial (80%) | −4.37 | 1.14 | 1.02 | |||
Dysregulation of multiple genes associated with early events in carcinogenesis such as cyclins D1 and G1, and cyclin-dependent kinase inhibitor 1 a (Cdkn1a), the Ras oncogene family (Ran, raga), MapK, cell proliferation (Pcna), inflammation (interleukin 1β and Jun b), and cell death [caspase-3 (Casp3), Pycard, transforming growth factor-β–inducible early growth response (Tieg)] among other genes was observed (Supplementary Tables S5–S7). Dietary PEITC alone did not influence the expression of these genes, and treatment with PEITC returned the expression levels of these genes to near normal in NMBA-treated esophagus.
Principal components analysis has been widely used in the analysis of microarray data (33). Principal components analysis is a dimensional reduction technique allowing samples to be compared and clustered within a three-dimensional space in which each axis represents a linear combination of genes that best account for the variance among the treated samples. The distance between esophagus samples plotted in this space represents the difference in overall gene expression between the samples. To provide a comparison of genome-wide expression changes for the different treatments, we applied principal components analysis to all 12 microarrays in the study, using the expression values for all 41,070 genes on the array (Fig. 2C). The first three principal components were selected to enable visualization of the array data in three dimensions. Each point represents one microarray and the data are color coded to reflect treatment type. The axes in Fig. 2C represent the first three principal components of gene expression plotted on the X, Y, and Z axes, respectively. The variance accounted for by each axis is 30.71%, 17.08%, and 13.03%, respectively for X, Y, and Z. The data reveal that the esophagi from PEITC-treated animals were most similar to vehicle control esophagi in terms of global gene expression. NMBA-treated esophagi are well separated from all other samples indicating distinct differences in global gene expression. Importantly, the esophagus samples obtained from animals cotreated with PEITC and NMBA are more similar to vehicle controls than they are to NMBA treatment alone. This suggests that PEITC treatment has a genome-wide modulating effect on NMBA-induced gene expression in the rat esophagus.
Ontology and pathway analysis
Biological processes and pathways perturbed by NMBA treatment and modulated by PEITC in NMBA-treated rats were identified using ontology analysis of the set of 1,323 genes obtained from the intersection of ANOVA sets (Fig. 2A). Analysis of the Gene Ontology Consortium designation of gene biological processes using the web-based tool DAVID provided a list of statistically significant processes (P ≤ 0.05) represented in the set of 1,323 genes (33). Table 3 lists the categories ordered by P value. The most significant categories are cell cycle (30 genes), cell proliferation (36 genes), and cell death (22 genes). Gene expression data for the genes in each of these categories and fold changes in NMBA-, PEITC-, and PEITC + NMBA–treated esophagi relative to vehicle controls are shown in Supplementary Tables S5 to S7. In some cases, there are multiple probes for a given gene. In these cases, the redundant probes typically report very consistent fold changes. For example, in Table S4, there are four probes listed for Hspa8 (i.e., heat shock 70 kDa protein 8). Each of these probes had statistically significant changes in expression, and the four probes each show an approximate 2-fold induction of the gene in esophagi with NMBA alone and a return to near-normal levels in esophagi treated with PEITC + NMBA.
Table 3.
Biological processes in NMBA-treated rat esophagus that were modulated by PEITC treatment
| Gene Ontology biological process | No. genes | P |
|---|---|---|
| Cell cycle | 30 | 0.000103 |
| Cell proliferation | 36 | 0.000114 |
| Cell death | 22 | 0.000343 |
| Response to stress | 34 | 0.000637 |
| Apoptosis | 20 | 0.001004 |
| Lipid metabolism | 24 | 0.005953 |
| Response to chemical substance | 10 | 0.010004 |
| Mitotic cell cycle | 8 | 0.010651 |
| Induction of apoptosis | 12 | 0.012446 |
| Nuclear division | 7 | 0.013056 |
| Response to wounding | 15 | 0.014014 |
| Response to DNA damage stimulus | 8 | 0.020254 |
| Positive regulation of apoptosis | 12 | 0.023231 |
| Amino acid and derivative metabolism | 13 | 0.027037 |
| Amine metabolism | 13 | 0.028625 |
| Glutathione metabolism | 4 | 0.029496 |
| Response to endogenous stimulus | 8 | 0.031913 |
| Carboxylic acid metabolism | 17 | 0.031929 |
| Organic acid metabolism | 17 | 0.031929 |
| Response to abiotic stimulus | 12 | 0.037509 |
| Protein localization | 17 | 0.039672 |
| One-carbon compound metabolism | 4 | 0.043354 |
| Translational initiation | 5 | 0.048176 |
NOTE: Genes were categorized per the Gene Ontology Consortium designations. The count column indicates the number of genes from the set of 1323 genes derived by statistical analysis that are associated with the specified category.
In general, the data reveal that esophageal gene expression levels for the biological processes identified by Gene Ontology are greatly perturbed in response to NMBA treatment but are near-normal when cotreated with PEITC.
Real-time PCR validation
To verify the microarray data, out of the set of 1,323 genes obtained from the intersection of ANOVA, eight genes from different categories were chosen for quantitative RT-PCR to confirm the modulation effect of PEITC on NMBA-induced differential gene expression. We selected genes expressing drug-metabolizing enzymes (i.e., Cyp2a2, Gst1a2, Ugt1a6); genes involved in signal transduction and apoptosis pathways, such as Mapk6, Junb, Casp3; and genes associated with early events in tumor development, such as Ccnd1 and Pcna. These genes were chosen because they are known to play an important role in NMBA-induced carcinogenesis and in chemoprevention by PEITC. However, in the interest of space, we provide data from three of the eight genes analyzed (i.e., Gst1a2, Pcna, and Mapk6; Fig. 3). Data from these genes were chosen because their expression as determined by microarray was perturbed by NMBA treatment and modulated by PEITC + NMBA cotreatment (P ≤ 0.05), and are also known to play an important role either in NMBA-induced carcinogenesis or in chemoprevention by PEITC. The expressions of these genes were normalized against expression of the endogenous gene, Rps11, because microarray analysis revealed that expression of Rps11 remained unchanged with all treatments when compared with other housekeeping genes such as Hprt, ActB, or Gapdh. A comparison of the fold changes measured by the microarray and RT-PCR assays is shown in Fig. 3. For each gene tested, the RT-PCR results confirmed gene expression changes that were observed by microarray. RT-PCR assays showed that NMBA treatment up-regulated the expressions of Pcna and Mapk6 by 3.6- and 9-fold, respectively, whereas Gst1a2 was down-regulated by 5.9-fold. In contrast, dietary-PEITC up-regulated expression of Gst1a2 and down-regulated Mapk6 by 2-fold. Cotreatment with PEITC + NMBA reduced the expressions of Pcna and Mapk6, and up-regulated the expression of GSTs.
Figure 3.

RT-PCR validation of microarray results. Gene expression was measured in selected genes, Gst1a2, Pcna, and Mapk6 using RT-PCR. Each sample was assayed in triplicate for each gene. Each sample represents pooled RNA created from equal amounts of total RNA from three independent RNA samples, representing individual animals. Each of these samples was obtained from a different animal, and no sample was included in more than one pool. In total, samples from nine animals per group were pooled for control, NMBA, PEITC, and PEITC + NMBA. In all cases, RT-PCR measurements (vertical filled bars) confirmed the changes in gene expression identified by microarray analysis (dotted filled bars).
These results suggest that PEITC may abrogate NMBA-induced changes by (a) inhibiting NMBA metabolism through CYPs, (b) enhancing detoxification by induction of GST activity, and/or (c) by interfering in signal transduction cascades involved in carcinogenesis.
Discussion
The major goal of this study was to assess early changes in genes involved in NMBA-induced cytotoxic/carcinogenic events in rat esophagus and the effects of the chemopreventive agent, PEITC, on these events. Histopathologic data showed that treatment of rats with PEITC alone led to very few, if any, changes in the esophagus relative to rats treated with vehicle only. In contrast, treatment with NMBA led to basal cell proliferation, cytotoxicity, apoptosis, and inflammatory changes in the esophagus. The histologic appearance of the esophagus in rats treated with PEITC + NMBA was more normal than in esophagus treated with NMBA only. Microarray analyses identified multiple genes that were differentially expressed by short-term treatment of the esophagus with NMBA, and many of these were modulated by cotreatment with dietary PEITC. There was a strong correlation between the ability of PEITC to prevent NMBA-induced morphologic changes in the esophagus and its effects on overall gene expression.
NMBA is bioactivated by CYPs into metabolites that elicit DNA damage through the formation of O6-methylguanine adducts (22, 24). The specific CYP(s) responsible for NMBA metabolism in the rat have not been fully identified; however, two candidate enzymes are CYP2A3, present in the esophagus, lung, and nasal mucosa, and CYP2E1, found primarily in liver (34, 35). Earlier, we showed that PEITC markedly reduces the levels of O6-methylguanine from NMBA in rat esophagus (36). Because PEITC is a known inhibitor of CYP activity, we thought that the use of DNA array analysis would assist in the further identification of specific P450s involved in NMBA metabolism in the rat esophagus. We found, for the first time, that the expression levels of CYP2a2 and CYP3a9 were up-regulated by NMBA treatment of rat esophagus, and that cotreatment with PEITC lowered the expression of these genes to control levels. Differential expression of Cyp2a2 in the esophagus was confirmed by RT-PCR. These data suggest that Cyp2a2 and Cyp3a9 may be important for NMBA metabolism in rat esophagus, and they may be targets for PEITC inhibition. These observations require confirmation in further studies, however, because both genes have been reported to be expressed predominately in the liver (37, 38). Interestingly, as reported earlier by our laboratory, treatment with NMBA did not result in significant changes in the expression of the Cyp2a3 gene in the rat esophagus, suggesting that Cyp2a3 is either noninducible or its constitutive levels are sufficient for metabolism of NMBA in the esophagus.
Phase II enzymes are important for detoxifying carcinogens through conjugation with acceptor molecules such as cellular glutathione, glucuronic acid, and sulfates (39, 40). Although the role of phase II enzymes in the metabolism of NMBA in the rat esophagus has not been fully elucidated, there is evidence of the formation of glucuronide conjugates of NMBA-derived metabolites in rodent tissues (41). In the present study, NMBA treatment of rat esophagus led to reduced expression levels of several GSTs, including Gsta1, Gsta2, and Gstt2 (Table 2). In contrast, the expression of these genes was significantly up-regulated by dietary PEITC alone. Importantly, PEITC modulated the expression levels of these GSTs in NMBA-treated esophagus to levels equal to or greater than seen in vehicle controls. These results indicate the important role of PEITC in restoring the activities of detoxifying enzymes in the esophagus. We also showed recently that PEITC induces GST activity in the rat liver (23).
A portion of the chemopreventive effects of PEITC against NMBA-induced toxicity in the rat esophagus appears to be associated with blocking the metabolic activation of NMBA by CYPs (phase I inhibition) coupled with induction of the phase II detoxifying GSTs and UDP-glucuronic acid transferases. Because NMBA is administered s.c., much of the compound likely encounters hepatic cells before reaching the esophagus. Recently, we showed the ability of PEITC to induce GST activity in the rat liver, which may also be an important mechanism for reducing its carcinogenic effect in the esophagus (23). Interestingly, we also found that NMBA is metabolically activated in rat liver, but this activation was not affected by dietary PEITC.
Cellular functions in the rat esophagus that were perturbed by NMBA and also modulated by cotreatment with PEITC included genes associated with cell proliferation, cell cycle, and cell death (Table 2). Some of the genes induced in the esophagus by short-term NMBA treatment were Ran (member of Ras oncogene family), Mapk6, Jun b, fos11, cyclins (cyclin A2, cyclin B1, cyclin D1, and cyclin G1), Cdkn1a, Pcna, interleukins (Il18 and Il1b), Tieg, T-cell associated gene (Tdag), Casp3, and Bcl-2 binding component 3 (Bbc3; see Supplementary Tables S5–S7). Dietary PEITC reduced the differential expression of these genes in NMBA-treated esophagus to levels comparable with control esophagus. Because the principal regulatory events leading to mammalian cell proliferation and differentiation occur in the transition from G0 to G1 and/or at the G1 to S phase of the cell cycle, the deregulated expression of G1 or G1-S phase cyclins or their related cyclin-dependent kinases (CDK) could cause loss of cell cycle control and thus enhance carcinogenesis. Amplification and overexpression of cyclin D1 has been reported in several human tumors including esophageal squamous cell carcinoma and adenocarcinoma (42). Our laboratory reported overexpression of cyclins D1 and E as well as PCNA in NMBA-treated rat esophagus, and we suggested that overexpression of these genes are relatively early events in tumor development (43–45). Results in the present study confirm these observations in that NMBA activation of cyclins and their related CDKs, as well as PCNA, occurred after only 1 week of NMBA treatment. Interestingly, dietary PEITC completely reduced the overexpression of these genes to control levels in NMBA-treated esophagus.
Apoptosis of preinitiated and/or neoplastic cells represents a protective mechanism against neoplastic transformation. In the present study, the expression of the proapoptotic gene Casp3 was up-regulated by NMBA treatment consistent with our observation of an apparent increase in the apoptotic rate in NMBA-treated rat esophagus. This increase may have been due to the observed cellular toxicity associated with carcinogen treatment. Dietary PEITC down-regulated Casp3 in NMBA-treated rat esophagus, whereas it up-regulated GST gene expression. This might be protective because it would enhance the detoxification of the carcinogen and lead to a reduced rate of NMBA-induced cytotoxicity and apoptosis. Numerous studies have shown, however, that PEITC enhances Casp3 expression and apoptosis in human cancer cell lines and in transgenic animal tumor models (5, 46, 47). This is the opposite of what would be expected from our results. However, the effects of PEITC in tumor cell cultures and in transgenic animals may be different because in these systems, cell cycle events and rates of cell proliferation and apoptosis are markedly deregulated, and the induction of Casp3 and apoptosis by PEITC would be protective.
Considerable evidence suggests that the chemopreventive effects of a single compound are optimal when the compound is capable of modulating multiple cellular events involved in the carcinogenesis processes (48). In this regard, isothiocyanates, including PEITC, modulate carcinogen metabolism and inhibit tumor progression by causing cell cycle arrest, inhibiting cell growth, and stimulating apoptosis. Our studies suggest that short-term treatment with NMBA induces early changes in molecular events that likely play a crucial role in cellular cytotoxicity and, possibly, the initial development of esophageal tumorigenesis. Dietary PEITC almost completely blocked many of these NMBA-induced events, which is consistent with its remarkable inhibitory effect on NMBA-esophageal tumorigenesis (36, 49).
Supplementary Material
Acknowledgments
Grant support: NIH grants R01 CA103180 and R01CA96130 (G.D. Stoner). The microarray and bioinformatics work were facilitated by the Microarray and Bioinformatics Facility Core of the Environmental Health Sciences Center at Wayne State University (NIEHS Center grant P30 ES06639).
Footnotes
Note: Supplementary data for this article are available at Cancer Research Online (http://cancerres.aacrjournals.org/).
References
- 1.Blot WJ, McLaughlin JK. The changing epidemiology of esophageal cancer. Semin Oncol. 1999;26:2–8. [PubMed] [Google Scholar]
- 2.American Cancer Society. Cancer facts and figures, 2005. Atlanta, GA: American Cancer Society; 2005. [Google Scholar]
- 3.Beer DG, Stoner GD. Clinical models of chemoprevention for the esophagus. Hematol Oncol Clin North Am. 1998;12:1055–77. doi: 10.1016/s0889-8588(05)70041-1. [DOI] [PubMed] [Google Scholar]
- 4.Chemoprevention Working Group. Prevention of cancer in the next millennium: report of the Chemoprevention Working Group to the American Association for Cancer Research. Cancer Res. 1999;59:4743–58. [PubMed] [Google Scholar]
- 5.Surh YJ. Cancer chemoprevention with dietary phytochemicals. Nat Rev Cancer. 2003;3:768–80. doi: 10.1038/nrc1189. [DOI] [PubMed] [Google Scholar]
- 6.Manson MM. Cancer prevention—the potential for diet to modulate molecular signalling. Trends Mol Med. 2003;9:11–8. doi: 10.1016/s1471-4914(02)00002-3. [DOI] [PubMed] [Google Scholar]
- 7.Hecht SS. Inhibition of carcinogenesis by isothiocyanates. Drug Metab Rev. 2000;32:395–411. doi: 10.1081/dmr-100102342. [DOI] [PubMed] [Google Scholar]
- 8.Fenwick GR, Heaney RK, Maweson R. Glucosinolates. In: Cheeke PR, editor. Toxicants of plant origin. II. Boco Raton (FL): CRC Press; 1989. pp. 2–41. Glycosides. [Google Scholar]
- 9.Moreno RL, Kent UM, Hodge K, Hollenberg PF. Inactivation of cytochrome P450 2E1 by benzyl isothiocyanate. Chem Res Toxicol. 1999;12:582–7. doi: 10.1021/tx9900019. [DOI] [PubMed] [Google Scholar]
- 10.Weymarn L, Chun J, Hollenberg PF. Effects of benzyl and phenethyl isothiocyanate on P450s 2A6 and 2A13. Potential for chemoprevention in smokers Carcinogenesis. 2006;4:782–90. doi: 10.1093/carcin/bgi301. [DOI] [PubMed] [Google Scholar]
- 11.Hecht SS, Trushin N, Rigotty J, et al. Complete inhibition of 4-(methylnitrosamino)-1-(3-pyridyl)-1-butanone-induced rat lung tumorigenesis and favorable modification of biomarkers by phenethyl isothiocyanate. Cancer Epidemiol Biomarkers Prev. 1996;5:645–52. [PubMed] [Google Scholar]
- 12.Stoner GD, Morrissey DT, Heur YH, Daniel EM, Galati AJ, Wagner SA. Inhibitory effects of phenethyl isothiocyanate on N-nitrosobenzylmethylamine carcinogenesis in the rat esophagus. Cancer Res. 1991;51:2063–8. [PubMed] [Google Scholar]
- 13.Kresty LA, Morse MA, Morgan C, et al. Chemoprevention of esophageal tumorigenesis by dietary administration of lyophilized black raspberries. Cancer Res. 2001;61:6112–9. [PubMed] [Google Scholar]
- 14.Hecht SS. Biochemistry, biology and carcinogenicity of tobacco-specific N-nitrosamines. Chem Res Toxicol. 1998;11:559–603. doi: 10.1021/tx980005y. [DOI] [PubMed] [Google Scholar]
- 15.Jalas JR, Ding X, Murphy SE. Comparative metabolism of the tobacco-specific nitrosamines 4-(methylnitrosamino)-1-(3-pyridyl)-1-butanone and 4-(methylnitrosamino)-1-(3-pyridyl)-1-butanol by rat cytochrome P450 2A3 and human cytochrome P450 2A13. Drug Metab Dispos. 2003;3:1199–202. doi: 10.1124/dmd.31.10.1199. [DOI] [PubMed] [Google Scholar]
- 16.Gray MR, Donnelly RJ, Kingsnorth AN. The role of smoking and alcohol in metaplasia and cancer risk in Barrett’s columnar-lined oesophagus. Gut. 1993;34:727–31. doi: 10.1136/gut.34.6.727. [DOI] [PMC free article] [PubMed] [Google Scholar]
- 17.Menke-Pluymers MBE, Hop WCJ, Dees J, van Blankenstein M, Tilanus HW. Risk factors for the development of an adenocarcinoma in columnar-lined Barrett’s esophagus. Cancer. 1993;72:1155–8. doi: 10.1002/1097-0142(19930815)72:4<1155::aid-cncr2820720404>3.0.co;2-c. [DOI] [PubMed] [Google Scholar]
- 18.Mandard AM, Hainaut P, Hollstein M. Genetic steps in the development of squamous cell carcinoma of the esophagus. Mutat Res. 2000;462:335–42. doi: 10.1016/s1383-5742(00)00019-3. [DOI] [PubMed] [Google Scholar]
- 19.Stoner GD, Kresty LA, Carlton PS, Siglin JC, Morse MA. Isothiocyanates and freeze-dried strawberries as inhibitors of esophageal cancer. Toxicol Sci. 1999;52:95–100. doi: 10.1093/toxsci/52.2.95. [DOI] [PubMed] [Google Scholar]
- 20.Mandal S, Stoner GD. Inhibition of N-nitrosobenzylmethylamine induced esophageal tumorigenesis in rats by ellagic acid. Carcinogenesis. 1990;11:55–61. doi: 10.1093/carcin/11.1.55. [DOI] [PubMed] [Google Scholar]
- 21.Carlton PS, Kresty LA, Siglin JC, et al. Inhibition of N-nitrosomethylbenzylamine-induced tumorigenesis in the rat esophagus by dietary freeze-dried strawberries. Carcinogenesis. 2001;22:441–6. doi: 10.1093/carcin/22.3.441. [DOI] [PubMed] [Google Scholar]
- 22.Lubec GE, Archer MC. Esophageal and hepatic microsomal metabolism of N-nitrosomethylbenzylamine and N-nitrosodimethylamine in the rat. Cancer Res. 1982;42:3181–6. [PubMed] [Google Scholar]
- 23.Reen RK, Nines R, Stoner GD. Modulation of N-nitrosomethylbenzylamine metabolism by black raspberries in the esophagus and liver of Fischer 344 rats. Nutr Cancer. 2006;54:47–57. doi: 10.1207/s15327914nc5401_6. [DOI] [PMC free article] [PubMed] [Google Scholar]
- 24.Morse MA, Lu J, Stoner GD, Murphy SE, Peterson LA. Metabolism of N-nitrosobenzylmethylamine by human cytochrome P-450 enzymes. J Toxicol Environ Health A. 1999;58:397–411. doi: 10.1080/009841099157133. [DOI] [PubMed] [Google Scholar]
- 25.Stoner GD, Gupta A. Etiology and chemoprevention of esophageal squamous cell carcinoma. Carcinogenesis. 2001;22:1737–46. doi: 10.1093/carcin/22.11.1737. [DOI] [PubMed] [Google Scholar]
- 26.Jacob P, Kahrilas PJ, Desai T, et al. Natural history and significance of esophageal squamous cell dysplasia. Cancer. 1990;65:2731–9. doi: 10.1002/1097-0142(19900615)65:12<2731::aid-cncr2820651222>3.0.co;2-1. [DOI] [PubMed] [Google Scholar]
- 27.Kendziorski C, Irizarry RA, Chen KS, Haag JD, Gould MN. On the utility of pooling biological samples in microarray experiments. Proc Natl Acad Sci U S A. 2005;102:4252–7. doi: 10.1073/pnas.0500607102. [DOI] [PMC free article] [PubMed] [Google Scholar]
- 28.Quackenbush J. Computational analysis of microarray data. Nat Rev Genet. 2001;6:418–27. doi: 10.1038/35076576. [DOI] [PubMed] [Google Scholar]
- 29.Weng L, Dai H, Zhan Y, He Y, Stepaniants SB, Bassett DE. Rosetta error model for gene expression analysis. Bioinformatics. 2006;9:1111–21. doi: 10.1093/bioinformatics/btl045. [DOI] [PubMed] [Google Scholar]
- 30.Gene Ontology Consortium. The Gene Ontology (GO) database and informatics resource. Nucl Acids Res. 2004;32:D258–61. doi: 10.1093/nar/gkh036. [DOI] [PMC free article] [PubMed] [Google Scholar]
- 31.Dennis G, Jr, Sherman BT, Hosack DA, et al. DAVID: Database for annotation, visualization, and integrated discovery. Genome Biol. 2003;4:3. [PubMed] [Google Scholar]
- 32.Toledano-Katchalski H, Kraut J, Sines T, et al. Protein tyrosine phosphatase epsilon inhibits signaling by mitogen-activated protein kinases. Mol Cancer Res. 2003;7:541–50. [PubMed] [Google Scholar]
- 33.Yeung KY, Ruzzo WL. Principal component analysis for clustering gene expression data. Bioinformatics. 2001;17:763–74. doi: 10.1093/bioinformatics/17.9.763. [DOI] [PubMed] [Google Scholar]
- 34.Gopalakrishnan R, Morse MA, Lu J, et al. Expression of cytochrome P450 2A3 in rat esophagus: relevance to N-nitrosobenzylmethylamine. Carcinogenesis. 1999;20:885–91. doi: 10.1093/carcin/20.5.885. [DOI] [PubMed] [Google Scholar]
- 35.Pinto RL, Moraes E, Albano RM, et al. Rat esophageal cytochrome P450 (CYP) monooxygenase system: comparison to the liver and relevance in N-nitrosodiethylamine carcinogenesis. Carcinogenesis. 2001;22:1877–83. doi: 10.1093/carcin/22.11.1877. [DOI] [PubMed] [Google Scholar]
- 36.Morse MA, Zu H, Galati AJ, Schmidt CJ, Stoner GD. Dose-related inhibition by dietary phenethyl isothiocyanate of esophageal tumorigenesis and DNA methylation induced by N-nitrosobenzylmethylamine in rats. Cancer Lett. 1993;72:103–10. doi: 10.1016/0304-3835(93)90018-5. [DOI] [PubMed] [Google Scholar]
- 37.Wang H, Kawashima H, Strobel HW. cDNA cloning of a novel CYP3A from rat brain. Biochem Biophys Res Commun. 1996;221:157–62. doi: 10.1006/bbrc.1996.0562. [DOI] [PubMed] [Google Scholar]
- 38.Aiba T, Yoshinaga M, Ishida K, Takehara Y, Hashimoto Y. Intestinal expression and metabolic activity of the CYP3A subfamily in female rats. Biol Pharm Bull. 2005;28:311–5. doi: 10.1248/bpb.28.311. [DOI] [PubMed] [Google Scholar]
- 39.Guengerich FP. Metabolism of chemical carcinogens. Carcinogenesis. 2000;21:345–51. doi: 10.1093/carcin/21.3.345. [DOI] [PubMed] [Google Scholar]
- 40.Prestera T, Holtzclaw WD, Zhang Y, Talalay P. Chemical and molecular regulation of enzymes that detoxify carcinogens. Proc Natl Acad Sci U S A. 1993;90:2965–9. doi: 10.1073/pnas.90.7.2965. [DOI] [PMC free article] [PubMed] [Google Scholar]
- 41.Wiessler M, Rossnagel G. α-Glucuronides of N-nitrosomethylbenzylamine. IARC Sci Publ. 1987;84:170–2. [PubMed] [Google Scholar]
- 42.Jiang W, Zhang YJ, Kahn SM, et al. Altered expression of the cyclin D1 and retinoblastoma genes in human esophageal cancer. Proc Natl Acad Sci U S A. 1993;90:9026–30. doi: 10.1073/pnas.90.19.9026. [DOI] [PMC free article] [PubMed] [Google Scholar]
- 43.Okamoto A, Jiang W, Kim SJ, et al. Overexpression of human cyclin D1 reduces the transforming growth factor β (TGF-β) type II receptor and growth inhibition by TGF-β1 in an immortalized human esophageal epithelial cell line. Proc Natl Acad Sci U S A. 1994;91:11576–80. doi: 10.1073/pnas.91.24.11576. [DOI] [PMC free article] [PubMed] [Google Scholar]
- 44.Wang QS, Sabourin CL, Wang H, Stoner GD. Overexpression of cyclin D1 and cyclin E in N-nitrosomethylbenzylamine-induced rat esophageal tumorigenesis. Carcinogenesis. 1996;17:1583–8. doi: 10.1093/carcin/17.8.1583. [DOI] [PubMed] [Google Scholar]
- 45.Visanji JM, Duthie SJ, Pirie L, Thompson DG, Padfield PJ. Dietary isothiocyanates inhibit Caco-2 cell proliferation and induce G2/M phase cell cycle arrest, DNA damage, and G2/M checkpoint activation. J Nutr. 2004;134:3121–6. doi: 10.1093/jn/134.11.3121. [DOI] [PubMed] [Google Scholar]
- 46.Huang Q, Lawson TA, Chung FL, Morris CR, Mirvish SS. Inhibition by phenylethyl and phenylhexyl isothiocyanate on metabolism of and DNA methylation by N-nitrosomethylamylamine in rats. Carcinogenesis. 1993;14:749–54. doi: 10.1093/carcin/14.4.749. [DOI] [PubMed] [Google Scholar]
- 47.Hu R, Kong AN. Activation of MAP kinases, apoptosis and nutrigenomics of gene expression elicited by dietary cancer-prevention compounds. Nutrition. 2004;20:83–8. doi: 10.1016/j.nut.2003.09.015. [DOI] [PubMed] [Google Scholar]
- 48.Greenwald P, Clifford CK, Milner JA. Diet and cancer prevention. Eur J Cancer. 2001;37:948–65. doi: 10.1016/s0959-8049(01)00070-3. [DOI] [PubMed] [Google Scholar]
- 49.Conaway CC, Wang CX, Pittman B, et al. Phenethyl isothiocyanate and sulforaphane and their N-acetylcysteine conjugates inhibit malignant progression of lung adenomas induced by tobacco carcinogens in A/J mice. Cancer Res. 2005;65:8548–57. doi: 10.1158/0008-5472.CAN-05-0237. [DOI] [PubMed] [Google Scholar]
Associated Data
This section collects any data citations, data availability statements, or supplementary materials included in this article.