

Abstract
Salivary glands are potentially useful target sites for multiple clinical applications of gene transfer. Previously, we have shown that serotype 2 adeno-associated viral (AAV2) vectors lead to stable gene transfer in the parotid glands of rhesus macaques. As AAV5 vectors result in considerably greater transgene expression in murine salivary glands than do AAV2 vectors, herein we have examined the use of AAV5 vectors in macaques at two different doses (n = 3 per group; 1010 or 3 × 10¹¹ particles per gland). AAV5 vector delivery, as with AAV2 vectors, led to no untoward clinical, hematological or serum chemistry responses in macaques. The extent of AAV5-mediated expression of rhesus erythropoietin (RhEpo) was dose-dependent and similar to that seen with an AAV2 vector. However, unlike results with the AAV2 vector, AAV5 vector-mediated RhEpo expression was transient. Maximal expression peaked at day 56, was reduced by ~80% on day 84 and thereafter remained near background levels until day 182 (end of experiment). Quantitative PCR studies of high-dose vector biodistribution at this last time point showed much lower AAV5 copy numbers in the targeted parotid gland (~1.7%) than found with the same AAV2 vector dose. Molecular analysis of the conformation of vector DNA indicated a markedly lower level of concatamerization for the AAV5 vector compared with that of a similar AAV2 vector. In addition, cellular immunological studies suggest that host response differences may occur with AAV2 and AAV5 vector delivery at this mucosal site. The aggregate data indicate that results with AAV5 vectors in murine salivary glands apparently do not extend to macaque glands.
Keywords: AAV, serotype 5, non-human primates, salivary glands, gene therapeutics
Introduction
Salivary glands have several unique advantages as a target for gene delivery.1,2 Gene transfer to these tissues appears useful for repair of damaged salivary glands, as well as for the production of therapeutic proteins for local (upper gastrointestinal tract) and systemic use.3–5 A key step in developing any potential clinical gene transfer application is testing the adequacy of transgene expression from scaled doses of vector in large animal models.6,7 Previously, we showed that serotype 2 adeno-associated viral (AAV2) vectors lead to stable and reasonably proportional transgene expression after delivery to the submandibular glands of Balb/c mice and the parotid glands of rhesus macaques.5,8 However, other studies in Balb/c mice have shown that AAV5 vectors result in a more rapid and robust expression of transgenes in salivary glands than achieved with AAV2 vectors.9 To evaluate the transduction activity of AAV5 vectors in primate salivary glands, we conducted an extended (6-month) study in rhesus macaques and monitored transgene expression, and vector persistence, conformation and biodistribution.
Results
Previous research has demonstrated that AAV5 requires the expression of the platelet-derived growth factor receptor (PDGFR), either α or β, as a receptor for high transduction activity of a target cell.10 To assess the likelihood of AAV5 transduction of macaque parotid glands, we examined the distribution of PDGFRα in rhesus parotid glands. As shown in Figure 1a, PDGFRα immunostaining can be found in both acinar and duct cells in this tissue, albeit in different locales. In acinar cells, the staining was uniformly around the basolateral membrane, whereas in duct cells the staining predominated at the apical (luminal) membrane. This latter distribution would facilitate AAV5 vector transduction of duct cells following retrograde delivery as performed herein, and presumably would result in a transduction pattern comparable with that previously reported for murine submandibular glands.9 For comparison, we also determined the distribution of the primary receptor for AAV2 (heparan sulfate proteoglycan; HSPG) in macaque parotid glands. As can be seen in Figure 1b, HSPG is found primarily in duct cells, with strong immunostaining also visible on the luminal membrane. Acinar cells, however, show little HSPG expression. The distributions of PDGFRα and HSPG seen here in rhesus parotid glands are similar to their distributions in human parotid glands (AP Cotrim and WD Swaim, unpublished).
Figure 1.
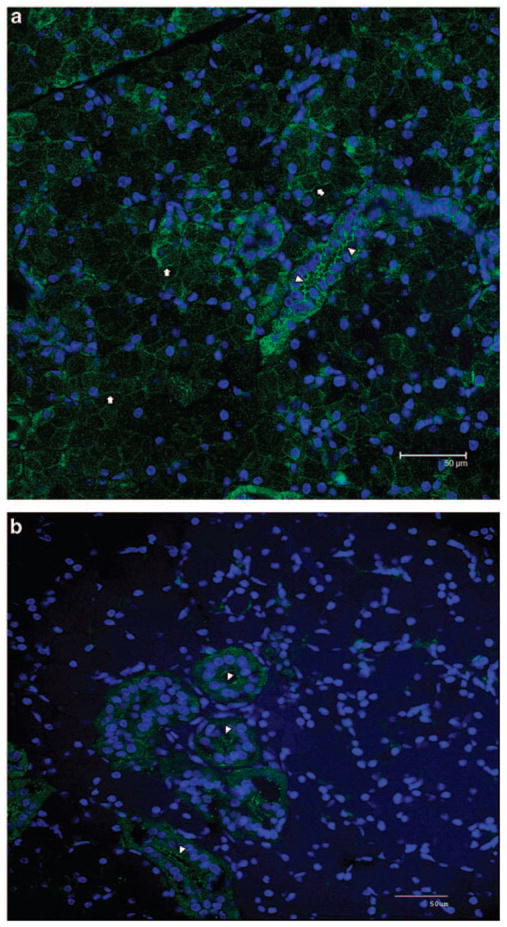
Location of receptors for AAV5 and AAV2 in macaque parotid glands. Portions of rhesus parotid glands were obtained at necropsy from an untreated animal and immunostained either for PDGFRα, the primary receptor for AAV5 (a), or HSPG, the primary receptor for AAV2 (b), as described in the Materials and methods section. Arrows indicate PDGFRα localization at the basolateral membrane of acinar cells, whereas arrowheads show immunostaining for this receptor at the apical (luminal) membrane of duct cells, in panel a. Heparan sulfate proteoglycan is mainly found in duct cells at the luminal membrane (arrowheads, b).
Administration of AAV5RhEpo to macaque parotid glands led to a dose-dependent increase in the detection of rhesus erythropoietin (RhEpo) in both saliva and serum. For example, in the high-dose animals (3 × 10¹¹ particles per gland) on day 56, the average salivary RhEpo level detected was 8.2 ± 3.2 mU ml−1 (mean ± s.e.) above background (0.24 mU ml−1), whereas in the low-dose group (1010 particles per gland) it was 1.05 ± 1.0 mU ml−1. Similarly, the serum levels detected were 3.8 ± 0.75 and 1.7 ± 0.8 mU ml−1, respectively, greater than background (0.52 mU ml−1). Although herein we are just using RhEpo as a reporter transgene, such an elevation in serum Epo levels theoretically could achieve a therapeutic effect in patients with chronic renal failure.11 The distribution of RhEpo between saliva and serum is comparable with what we have previously reported after AAV2 vector-mediated transfer of the RhEpo cDNA to macaque parotid glands.8 However, it is quite unlike the situation in mice, where most transgenic Epo is secreted into the bloodstream.8 As shown in Figure 2, for the AAV5RhEpo high-dose animals, on average clearly elevated RhEpo levels were detected in saliva and serum by day 28, with peak levels seen on day 56. By the next time point examined, day 84, salivary and serum RhEpo levels had dropped dramatically to ~20% of the peak levels and remained low until the study ended on day 182. The kinetics are quite different from those observed after AAV2RhEpo transduction of macaque parotid glands, that is, RhEpo secretion into serum and saliva was relatively stable from days 56 to 180.8 We also assayed RhEpo levels in aqueous extracts of macaque parotid glands obtained at necropsy (Table 1) and found ~25-fold higher levels of RhEpo from AAV2RhEpo-transduced glands (28.2 mU mg −1 protein) than found in AAV5RhEpo-transduced glands (1.1 mU mg−1 protein), consistent with the serum and salivary results. Note that both vectors have identical transgene cassettes (same promoter, transgene and poly-adenylation signal), and thus it is unlikely that any genetic information other than that related to the serotype-specific inverted terminal repeats (ITRs) could have influenced the RhEpo expression patterns observed.
Figure 2.

Salivary and serum erythropoietin levels in macaques after rAAV5RhEpo administration to parotid glands. Shown are the levels (mean ± s.e.) of rhesus erythropoietin (RhEpo) from the high dose (3× 10¹¹ particles per gland) group in (a) saliva and (b) serum. Changes in RhEpo levels from animals in the low dose (1010 particles per gland) group were small and are not presented (see text).
Table 1.
Rhesus erythropoietin (RhEpo) levels in aqueous extracts of macaque parotid glands
| Animal number → | AAV2RhEpo |
AAV5RhEpo |
||||
|---|---|---|---|---|---|---|
| 103 | 3559 | 4810 | 4727 | 4731 | 4798 | |
| RhEpo (mU mg−1 protein) | 26.9 | 37.6 | 20.2 | 0.7 | 0.8 | 1.7 |
Thirty–50 mg of parotid gland tissue from AAV5 (herein) and AAV28-vector transduced macaques were suspended in Cell Culture Lysis Reagent (Promega) and homogenized with an Omni TH 1 homogenizer to extract protein. Fifty μl of this extract were used to determine the presence of RhEpo protein with a human erythropoietin ELISA kit (StemCell Technologies, Vancouver, BC, Canada). The concentration of protein was determined using the BCA protein assay (Pierce, Rockford, Il, USA). Each gland sample, indicated by animal number and the vector administered, was tested in duplicate and average values are shown.
We next assessed vector biodistribution at the end point of the study, 182 days after vector administration when animals were necropzied (Table 2). We were able to detect vector in the targeted glands of all high-dose animals administered, but at very low levels. On average, in all portions of parotid glands analyzed, the number of AAV5RhEpo copies detected was 130 ± 32/105 cells. The vector copy numbers detected for most other tissues, including the contralateral parotid glands, were at or near background levels (~42 copies/105 cells; reported previously8), that is, those from genomic DNA obtained of non-treated macaque tissue. Note that for one high-dose animal 105 vector copies/105 cells were detected in one lung, likely the result of an accidental aspiration, as no vector copies above background were seen in the liver of this animal. Interestingly, as we previously reported, 6 months after AAV2 vector administration, the average number of vector copies detected in the targeted parotid glands was 7760 ± 2086/105 cells.8 This ~60-fold difference in vector copies detected was much greater than the difference observed in average peak levels of RhEpo measured between the two studies. Specifically, after AAV2RhEpo (3 × 10¹¹ particles per gland) delivery, the RhEpo values for saliva and serum, respectively, were ~14 and ~3.5 mU ml−1, an ~2-fold average difference at equivalent dosing. However, the difference in vector copy numbers was more similar to the RhEpo levels present in gland extracts (above). Although it is possible that AAV5RhEpo transduction of macaque parotid glands was less efficient than that of AAV2RhEpo, this seems unlikely given the comparable levels of serum and salivary RhEpo expression observed with both vectors at early time points. Thus, on balance, the data suggest that most cells that had been transduced originally by the AAV5RhEpo vector either were no longer present in the targeted glands or no longer contained vector DNA.
Table 2.
Number of vector genome copies in various tissues 182 days after high-dose rAAV5RhEPO gene transfer to the right parotid gland of rhesus macaquesa
| Tissue | High-dose group |
|---|---|
| Gonad right and left, kidney right and left, spleen, liver right and left, submandibular salivary gland right and left | ≤42 |
| Cervical nodes right and left | ≤42 |
| Heart right ventricle, heart left ventricle, heart septum | ≤53 |
| Parotid superior left, parotid middle left, parotid inferior left | ≤42 |
| Parotid superior portion right | 105 ± 18 |
| Parotid middle portion right | 84 ± 15 |
| Parotid inferior portion right | 200 ± 85 |
| Control parotid glands | ≤42 |
The data shown are the mean number of vector genome copies/105 cells ( ± s.e. where appropriate) determined with genomic DNA extracted from various rhesus macaque tissues 6 months after administration of 3 × 10¹¹ vector particles (high-dose group, n = 3). Note that samples of the right and left lung were also analyzed. Five samples showed ≤42 vector genome copies/105 cells, but the remaining sample from one macaque showed 105 vector genome copies/105 cells, which likely represents an aspiration.
Previously, it has been suggested that circularization of the AAV2 genome is an important first step in forming stable concatamers and persistent genomes within the nucleus, and in some studies this appears to be mediated through the ITRs.12 Other studies have suggested that concatamer formation can be tissue-specific and dependent on the level DNA-dependent protein kinase activity in the target cell.13 Experiments in HeLa cells suggest that AAV5 ITR-containing vectors may have a lower rate of circularization and intermolecular recombination compared with AAV2 ITR-containing vectors. However, the observed difference could also be the result of a lower rate of transduction of HeLa cells versus that with AAV2 vectors.14 To further investigate whether in addition to a difference in copy number, a difference in AAV2 and AAV5 genome structure or conformation exists in salivary glands, we carried out semiquantitative PCR measurements of AAV2 or AAV5 genomes using primer sets that would detect both total genomes and those linked in concatamers, and then compared the results (Figure 3).
Figure 3.

Assays to assess concatamer formation. (a) Design of PCR assays to detect concatamer formation with AAV2 and AAV5 DNA. (b) PCR assays to amplify 268 bp of RhEpo (white arrow). (c) PCR assays to amplify ~1 kb head–tail concatamer (black arrow). (d) Proportion of concatameric AAV genomes found in transduced parotid glands. The panel shows the ratios obtained from densitometric scans of the ~1 kb PCR bands from panel c to those of the 268 bp PCR bands from panel b, for AAV2RhEpo- and AAV5RhEpo-transduced glands. Given the PCR assay conditions used for panels b and c, these results should be viewed as semiquantitative, but clearly demonstrating a difference between the AAV2 and AAV5 samples. (e) Plasmid-Safe DNase assay for AAV2 vector samples. Two hundred ng of genomic DNA samples, with or without Plasmid-Safe DNase digestion, were loaded onto 1% agarose gels and subjected to electrophoresis. Under the experimental conditions, the amount of enzyme used should digest all 200 ng genomic DNA to mononucleotides after 16 h, if it was linear double-stranded DNA (see Zheng et al.32). (f) PCR assays to amplify 268 bp of RhEpo using DNA samples digested with and without Plasmid-Safe ATP-dependent DNase from the exact same samples as shown in panel e. This result shows that a small amount of circular (that is, undigested) DNA was present after the digestion shown in panel e, however, the amount was insufficient to be seen directly on the agarose gel and required amplification by this PCR reaction. See Materials and methods section for additional details. (g) Densitometric measurements of the results shown in panel f. Lanes for PCR photos are as follows, M: 1 kb DNA ladder; C: control, non-transduced parotid gland; 1–3: DNA samples from either AAV2RhEpo or AAV5RhEpo-transduced parotid gland.
The assay strategy is shown in Figure 3a. Initially, we generated a 268 bp product of the RhEpo cDNA to demonstrate vector presence in these samples. This product readily was amplified when 200 ng of genomic DNA was used from the AAV2RhEpo-transduced tissue obtained at necropsy8 (Figure 3b). However, in agreement with the above quantitative PCR (QPCR) analysis, to detect the AAV5 genomes it was necessary to use a 10-fold greater amount of genomic DNA in the assay, that is, 2 μg of genomic DNA, from AAV5RhEpo-transduced tissue (Figure 3b). The identity of this PCR product with that predicted (Figure 3a) was confirmed by sequencing (not shown). Thereafter, we evaluated the presence of concatamers in the transduced tissue. As shown in Figure 3c, the presence of head–tail AAV2 concatamers was readily detected in 200 ng of genomic DNA from all three high-dose macaque samples, indicated by the presence of an ~1 kb product (confirmed by sequencing). With 2 μg of genomic DNA from the three macaques administered AAV5RhEpo, however, we found only a faint band suggestive of head–tail concatamer formation. By comparing the intensity of the PCR product bands amplified with RhEpoBF3 and RHEpoFB1 (panel c; 1 kb) to that of the PCR bands amplified with RhEpoF1 and RhEpoB3 (panel B; 268 kb), it appears that ~75% of AAV2RhEpo vector formed head–tail concatamers in the gland, whereas only ~15% of AAV5RhEpo vector did so (panel d). Thus, the AAV5 genomes present in transduced salivary glands were considerably less likely to be found in a concatameric state compared with the AAV2 genomes present. This difference in conformation could affect both the overall transgene expression level as well as the persistence of the vector genome in the salivary gland cells. PCR assays to detect head–head and tail–tail concatamer formation were negative with samples from glands transduced with either serotype. Panels f and g in Figure 3 show that most (~67%) of the head–tail concatameric AAV2 DNA extracted from transduced glands was not digested by the Plasmid Safe ATP-dependent DNase, that is, it was circular. Thus, these findings suggest that the lack of sustained expression observed from the AAV5RhEpo vector may result from a structural difference in the AAV5 genome within the gland.
To further address the absence of AAV5RhEpo-transduced salivary cells, we first evaluated the effects of vector administration on multiple general clinical parameters. All macaques tolerated administration of the AAV5 vector well. Grossly, no untoward outcomes were observed. Saliva was of normal consistency, without purulence, and all animals ate normally and gained weight. In addition, there were no consistent negative effects of the AAV5 vector on any serum chemistry or hematology parameter measured, with the exception of a transient post-vector administration increase of creatine phosphokinase, which likely reflects minor muscle trauma resulting from experimental manipulations (see Table 3). Furthermore, necropsy and histopathological evaluations also revealed no adverse AAV5 vector-related changes (data not shown). Indeed, at necropsy, the only consistent pathological finding in the parotid glands was a mild inflammation of both the targeted and contralateral glands. This is exactly what was observed after administration of AAV2 vectors to macaques, as well as what was detected in the salivary glands of 11 control macaques.8
Table 3.
Representative complete blood count and serum chemistry parameters in rhesus macaques after rAAV5RhEPO gene transfera
| Day –21 | Day 1 | Day 7 | Day 56 | Day 112 | Day 182 | |
|---|---|---|---|---|---|---|
| WBC | 16.5 ± 3.9 | 7.1 ± 0.5 | 14.8 ± 10.8 | 13.3 ± 5.6 | 11.7 ± 4.6 | 6.7 ± 1.7 |
| RBC | 4.9 ± 0.2 | 5.1 ± 0.3 | 4.9 ± 0.2 | 5.2 ± 0.1 | 5.1 ± 0.1 | 5.1 ± 0.2 |
| HGB | 12.2 ± 0.1 | 12.6 ± 0.3 | 12.1 ± 0.1 | 13.3 ± 0.1 | 12.6 ± 0.2 | 12.5 ± 0.2 |
| HCT | 36.5 ± 0.6 | 37.5 ± 1.2 | 36.5 ± 0.6 | 38.9 ± 0.5 | 38.0 ± 0.1 | 37.8 ± 0.7 |
| PLAT | 406.3 ± 23.8 | 407.7 ± 33.5 | 431.7 ± 27.8 | 442.0 ± 28.3 | 417.0 ± 20.3 | 396.3 ± 15.9 |
| SEGS | 72.1 ± 10.2 | 63.1 ± 10.9 | 68.0 ± 15.2 | 60.9 ± 11.1 | 62.3 ± 13.5 | 44.4 ± 10.7 |
| LYMPHS | 24.1 ± 14.0 | 33.2 ± 9.9 | 28.2 ± 13.2 | 32.9 ± 10.2 | 31.2 ± 11.4 | 49.3 ± 8.8 |
| Na+ | 148.3 ± 0.3 | 155.7 ± 1.5 | 156.3 ± 0.7 | 154.0 ± 1.0 | 146.7 ± 0.3 | 143.0 ± 0.6 |
| Creatinine | 0.8 ± 0.07 | 0.9 ± 0.03 | 0.9 ± 0.07 | 0.9 ± 0.06 | 0.8 ± 0.06 | 0.9 ± 0.09 |
| SGOT | 57.3 ± 4.3 | 49.7 ± 4.9 | 36.7 ± 4.8 | 49.3 ± 5.5 | 38.0 ± 3.5 | 30.0 ± 2.5 |
| ALP | 710.3 ± 47.4 | 604.0 ± 49.5 | 481.0 ± 32.3 | 511.7 ± 34.7 | 534.3 ± 62.9 | 524.7 ± 80.4 |
| LDH | 710.3 ± 47.4 | 604.0 ± 49.5 | 481.0 ± 32.3 | 511.7 ± 34.7 | 534.3 ± 62.9 | 524.7 ± 80.4 |
| Albumin | 3.9 ± 0.3 | 4.4 ± 0.2 | 4.2 ± 0.1 | 4.5 ± 0.1 | 3.9 ± 0.1 | 3.8 ± 0.1 |
| CPK | 62.0 ± 12.0 | 213.3 ± 17.4 | 161.7 ± 22.4 | 170.0 ± 40.3 | 97.7 ± 35.0 | 88.3 ± 19.2 |
Abbreviations: WBC, white blood cell count as cells mm−3; RBC, red blood cell count as million cells mm−3; HGB, hemoglobin as g per 100 ml; HCT, hematocrit; PLAT, platelet count as × 103 mm−3; SEGS, segmented neutrophils as percent; LYMPHS, lymphocytes as percent; sodium as mEq l−1; creatinine as mg per 100 ml; SGOT, serum glutamic oxaloacetic transaminase as U l−1; ALP (alkaline phosphatase) as U l−1; LDH, lactate dehydrogenase as mg per 100 ml; albumin as g per 100 ml; CPK, creatine phosphokinase as U l−1.
Only the mean ± s.e. of the animals that belong to the high-dose group are presented (n = 3; 3 × 10¹¹ particles directly administered to the right parotid gland).
We next began to examine possible immunological reasons for the decline in RhEpo expression observed. First, circulating anti-AAV neutralizing antibodies were measured in all macaques both before and 28 days after vector administration. As depicted in Figure 4, all of the AAV5RhEpo-treated macaques studied showed a measurable elevation in their neutralizing antibody titer. Considering all five vector-treated animals together (three high dose; two low dose; one low dose animal died accidentally after the day 7 time point), the median pre-vector anti-AAV5 titer was <1:25 (that is, ‘not detectable’; lowest dilution tested), whereas at day 28 it was 1:1600. This finding is similar to previously published data on humoral responses after AAV2 and AAV5 vector delivery to mouse salivary glands, that is, the development of higher neutralizing antibody titers after delivery of an AAV5 vector versus an AAV2 vector.9 Although these results support an hypothesis that AAV5 vector delivery to macaque parotid glands may be more immunogenic than the delivery of AAV2 vectors, they do not provide the mechanistic explanation for the difference in persistence of expression observed following use of an AAV5 vector in rhesus versus mouse salivary glands.
Figure 4.
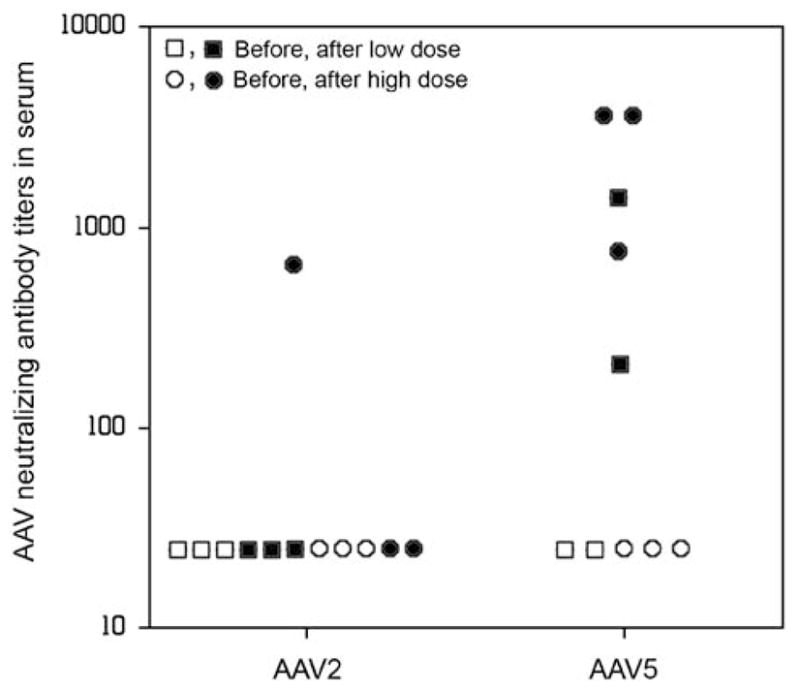
The presence of serum neutralizing antibodies against AAV vectors before and after vector administration. Blood samples were obtained as described in Figure 2. Samples from AAV2-treated macaques had been frozen and stored during an earlier study.8 Note that for the AAV2 vector samples, the animal showing the 1:800 titer after vector delivery was a high-dose animal. For the AAV5 vector-treated macaques, both animals showing a 1:3200 titer received a high dose, as did one animal with a 1:800 titer.
On the basis of the results with transduced hepato-cytes after intra-vascular AAV2 administration in a recent clinical trial,15,16 we speculated that a cytotoxic lymphocyte (CTL)-mediated destruction of transduced parotid epithelial cells possibly occurred. Although this study was not designed to test this, we took three separate, post hoc approaches to evaluate the hypothesis. Initially, we performed direct assays for the presence of CTLs using blood samples and fibroblasts obtained from animals at necropsy. Autologous fibroblasts were cultured in vitro and transduced with an AAV5 vector encoding a green fluorescence protein (5000 multiplicity of infection). Transduction was confirmed by fluorescence-activated cell sorting analysis. For the two high-dose macaques for which we had samples, we saw no consistent evidence for CTLs in the day 182 samples (Table 4).
Table 4.
IFN-γ production detected by ELISPOT after incubation of rhesus PMBCs with autologous fibroblasts
| Animal number | Treatment | Spots per well | Experiment –control |
|---|---|---|---|
| 4727 | PBMC alone | 0 | — |
| PBMC+control fibroblasts | 4 ± 3 | 4 | |
| PBMC+autologous fibroblasts | 3 ± 3 | 3 | |
| PBMC+ConA | 104 ± 18 | 104 | |
| 4731 | PBMC alone | 0 | — |
| PBMC+control fibroblasts | 2 ± 2 | 2 | |
| PBMC+autologous fibroblasts | 5 ± 2 | 5 | |
| PBMC+ConA | 148 ± 16 | 148 |
Abbreviations: Con A, concanavalin A; CTL, cytotoxic lymphocyte; IFNγ, interferon-γ; MOI, multiplicity of infection; PBMC, peripheral blood mononuclear cells; PVDF, polyvinylidene difluoride.
The data shown are mean values ( ± s.d.) for the results of ELISPOT assays for IFNγ secretion after incubation of PBMCs isolated from two high-dose monkeys (4727, 4731) with target cells (uninfected or AAV5-transduced autologous fibroblasts). Fibroblasts were transduced or not with ~5000 MOI of AAV5 vector encoding a green fluorescence protein. The number of AAV5-specific CTLs was determined by counting the IFNγ-positive spots per PVDF membrane.
Second, we used a peptide library approach comparable with that used following a clinical AAV2 vector study by Manno et al.15 Specifically, overlapping 15mer peptides spanning the whole capsid open reading frame of AAV5 were synthesized and divided into a matrix array of 24 pools with each peptide being present in two independent pools (Figure 5, top panel). Although a strong activation was seen upon concanavalin A and phytohemagglutinin stimulation (Figure 5, bottom panel), overall these studies revealed only a low AAV5 capsid-related response. For example, with peripheral blood mononuclear cells (PBMCs) from monkey no. 4798, pool 14 showed some reactivity, with lower reactivity in peptide pools 6, 8 and 20. Similarly, PBMCs from monkey no. 4727 also exhibited some reactivity with pools 6, 10 and 18, with lower, but measurable, reactivity in 11 other pools (Figure 5). PBMCs from the third monkey (no. 4731) displayed low level reactivity in 11 pools, most of which overlapped with those reactive with PBMCs from one or the other monkeys. Overall, however, the reactivity of PBMCs from the AAV5-treated monkeys with the AAV5 capsid library peptide pools was low and near background.
Figure 5.

ELISPOT assays for peptide-stimulated production of interferon (IFN)-γ by peripheral blood mononuclear cells (PBMCs) from AAV5-transduced macaques. Upper panel: peptide libraries consisting of 15-mers overlapping by 10 amino acids with the adjacent peptide were prepared for the AAV5 VP-1 capsid sequence. Two control peptides were also synthesized based on the AAV2 capsid VP-1 protein: AAV2-74 (PADVFMVPQYGYLTL) and AAV2-82 (GNNFTFSYTFEDVPF), which were reported to be active epitopes with AAV2 vectors15 (peptides 144, 145, respectively). Lower panel: secretion of IFN-γ from the PBMCs of monkeys administered the high dose of AAV5RhEpo after stimulation with 24 pools of peptides derived from the AAV5 capsid sequence. PBMCs were collected at the end of the experiment. Asterisks indicate that the resulting spots were too numerous to count. The number of IFN-γ-positive spots/1 × 106 cells was calculated by taking the well replicates plus antigen minus the average of the well replicates of PBMCs alone at 3 × 10⁵ cells per well and extrapolating to 1 × 10⁶ cells.
Finally, we examined saliva and serum samples obtained throughout the study for changes in the levels of six cytokines/chemokines that might be associated with a CTL response and compared them with similar samples that we had stored frozen from macaques treated with the AAV2RhEpo vector.8 For these assays, macrophage inflammatory protein (MIP1b, human), granulocyte macrophage colony-stimulating factor (human), interferon-γ (IFN-γ, primate), tumor necrosis factor-α (primate), interleukin-2 (IL-2, human) and IL-6 (primate) were measured commercially using SearchLight proteome arrays (Pierce Biotechnology, Woburn, MA, USA), which are multiplexed assays involving a sandwich enzyme-linked immunosorbent assay procedure.17 These results were equivocal (Figure 6). For example, in serum samples two of the three AAV5RhE-po-treated animals displayed elevations of MIP1b levels at multiple time points post-vector delivery, whereas none of the AAV2RhEpo-treated macaques did. However, the reverse was seen for MIP1b levels in saliva, that is, two of the three high-dose AAV2RhEpo-treated animals displayed elevations of MIP1b levels at several time points post-vector delivery, whereas none of the animals treated with AAV5RhEpo did. None of the serum or saliva samples exhibited a consistent pattern of responses for the all of the other cytokines measured (Figure 6). In addition to the data shown in Figure 6, all assays for the presence of tumor necrosis factor-α, IL-2 and IL-6 yielded results generally similar to those depicted in this figure.
Figure 6.

Cytokine evaluations in macaque serum and saliva samples. Samples were collected at the times indicated and the results shown are for granulocyte macrophage colony-stimulating factor (GMCSF; human protein assay), interferon-γ (rIFNγ; primate protein assay) and macrophage inflammatory protein 1b (MIP1b; human protein assay). All data are shown as mean values ± s.e., for three monkeys from the high-dose (3 × 10¹¹ particles per gland) group with each vector serotype. In addition, all serum (left panels) and saliva (right panels) samples were assayed for the presence of tumor necrosis factor-α (primate protein assay), interleukin-2 (IL-2, human protein assay) and IL-6 (human protein assay), all with results generally similar to those depicted in the figure.
Discussion
The results of this study show that an AAV5 vector encoding RhEpo as a reporter gene provides less stable gene transfer when administered to macaque parotid glands than a comparable AAV2 vector. Importantly, the kinetics of transgene expression directed by AAV5RhEpo were not predicted by the kinetics of reporter transgene expression observed in murine salivary glands.5,9 In mice, expression of AAV2 vector-directed expression increases slowly but steadily for 8–12 weeks before achieving a stable plateau,5 whereas AAV5-mediated transgene expression increases promptly within 1–2 weeks and is reasonably stable thereafter.9
Previous studies have demonstrated that long-term production of systemically secreted proteins is possible with AAV5 vectors after either intravenous delivery to the liver or transduction of the lung.18,19 In contrast to this study in which we used vectors with both an AAV5 capsid and ITRs, these earlier studies utilized pseudo-typed vectors containing AAV5 capsid and AAV2 ITRs. It is important to note that the AAV5 Rep gene and ITR are only ~50% similar to these same elements from other AAV serotypes. This leads to a failure of AAV5 to cross package ITRs from other serotypes.20 The AAV5 ITR has a unique terminal resolution site (TRS) only found in one other AAV serotype (BAAV), suggesting it may have distinctive biological activities.20–22 Indeed, only the AAV5 Rep is able to cleave the TRS site in the AAV5 ITR. Although the AAV5 ITRs are able to form concatamers in tissue culture,23 the structural analysis of the AAV5 ITR suggests that it lacks a small additional inverted repeat sequence surrounding the TRS that is conserved in the ITRs of AAV serotypes 2, 3, 4 and 6.24 It is possible that this difference in ITR sequence, or differences in the activity of enzymes involved in concatamer formation such as DNA-dependent protein kinase, results in a difference in genomic stability in the transduced salivary glands versus liver. Our results herein (Figure 3) clearly show that ~5-fold more AAV2 genomes exist in concatamers than AAV5 genomes, but what is not yet clear is how these differences in concatamerization may have impacted the transgene expression kinetics seen in mice9 and macaques.
In a previous gene transfer study with primate retina, it was shown that AAV5 vectors are able to transduce more photoreceptors when compared with AAV2 vectors and, by using distinct reporter genes, show that these two serotypes transduce different cell populations.25 In this study we were unable to test the latter directly, for example, by administering vectors encoding a suitable reporter gene, for example, green fluorescence protein, and determining its distribution after animal killing and immunocytochemistry of gland sections. Nonetheless, as is evident from the immunolocalization of PDGFα and HSPG shown in Figure 1, after retrograde ductal delivery both AAV5 and AAV2 vectors would have a similar tropism and target duct cells for transduction in macaque parotid glands. However, it is possible that the transduction of these glands was less efficacious with the AAV5 vectors, which might then have resulted in a distinct expression profile and the differences in concatamerization seen.
Although our data on genomic structure of the two AAV serotypes within macaque parotid gland identifies one possible mechanism for the lack of persistence of transgene expression seen herein, an alternative mechanism could be the macaque immunological response to the vectors or the vector-transduced cells. As we reported in murine studies, neutralizing antibodies increase more after AAV5 vector delivery than seen with AAV2.9 Although it was previously reported that antibody titers as low as 1:10 could inhibit vector transduction in vivo with a passive model of antibody transfer,26 it is unlikely that the low levels of pre-existing anti-viral antibodies measured herein resulted in the differences in transduction observed between AAV vector serotypes 2 and 5, as initially detectable RhEpo levels measured in saliva were fairly comparable (Figure 2; see also Voutetakis et al.8).
Because of study design, CTLs were not evaluated during the decline phase of RhEpo expression (Figure 2), but rather at the time of necropsy, 6 months after vector delivery. At this time point, only a minimal response was observed by stimulating PBMCs either with peptides or with transduced autologous fibroblasts (Figure 5, Table 4), but the actual responses seen were quite similar to those reported by Manno et al.15 at their 12-week time point. The cytokine levels measured in saliva and serum also indicated differential, albeit inconsistent, local and systemic responses after administration of the AAV5 and AAV2 vectors. Further studies will be required to establish if a cellular immune-mediated mechanism was also involved in the loss of AAV5 vector expression observed.
Although our observations are important for the anticipated future use of AAV vectors for clinical applications of salivary gland gene transfer, the findings are also likely of a more general interest to investigators utilizing different serotypes of AAV vectors for various mucosal tissues, as our results suggest that (i) mice and macaques may exhibit quite different transduction responses to comparable AAV vectors, (ii) the concatameric structure of the vector may affect its persistence in vivo and (iii) experimental planning for primate studies should include consideration of measuring real-time cellular immune responses.
Materials and methods
Immunolocalization of receptors for AAV5 and AAV2
Portions of rhesus parotid glands were obtained at necropsy from an untreated animal. Tissue was fixed in 10% formalin solution (Sigma-Aldrich, St Louis, MO, USA; HT50-1-1) processed, embedded in paraffin and 5 μ sections were cut. Sections were deparaffinized, rehy-drated and antigenic retrieval was performed with 1 mM EDTA and 0.05% Tween 20 for 10 min in a pressure cooker placed in a microwave oven. Nonspecific staining was avoided by blocking the tissue for 1 h at room temperature with a solution of 5% bovine serum albumin and 20% donkey serum, followed by incubation for 20 min with hydrogen peroxide. Tissue was then incubated with an antibody against PDGFRα (ab61219) raised in rabbit and obtained from Abcam (Cambridge, MA, USA), or a rabbit antibody against HSPG (SC H300) purchased from Santa Cruz Biotechnology (Santa Cruz, CA, USA), at a 1:100 dilution, overnight at 4 °C. PDGFRα is the primary receptor for AAV5 and HSPG is the primary receptor for AAV2.10,27 The secondary antibody used was Alexafluor-488 donkey anti-rabbit (Molecular Probes/Invitrogen; Carlsbad, CA, USA) at a 1:100 dilution, for 1 h at room temperature. Samples were imaged using a Leica TCS SP2 confocal system with a × 40 objective (Leica Microsystems, Exton, PA, USA).
In vivo macaque experiments, vector biodistribution and RhEpo assays
The NHLBI Animal Care and Use Committee and NIH Biosafety Committee approved these studies. Generation of the rAAV5RhEpo vector was performed using established methodology as previously described.8,9,20,21,28 VM Rivera (ARIAD Pharmaceuticals, Cambridge, MA, USA) generously provided the RhEpo cDNA, which was flanked by the AAV5 ITRs. Real-time QPCR was used to determine the vector titer. The sequences for the forward primer, reverse primer and probe were selected using Primer Express Primer Design software (PE Applied Biosystems; Foster City, CA, USA) based on the Rous Sarcoma Virus promoter.8 Two groups (n = 3 per dosage) of male macaques received either the low or high doses of rAAV5RhEpo through intraoral cannulation of the right parotid gland on day 0 as previously described.8 One macaque from the low-dose rAAV5RhEpo group died between days 7 and 28 because of an accident, and data from that animal are not reported. Macaques were housed in accordance with NIH and the Animal Care Unit policies, either singly or in compatible pairs. Animals had free access to water and received ~10–15 biscuits of Purina monkey chow 5038 (PMI Nutritional International, Brentwood, MO, USA) twice daily. For all experimental procedures, macaques were anesthetized with a dose of 3 mg kg−1 telazol, reconstituted with ketamine to a concentration of 100 mg ml−1.8 Blood (from the femoral vein) and whole saliva samples were obtained throughout the study, both before and after vector administration. For saliva collections, the animals were sedated with telazol/ketamine, and given 1 mg of pilocarpine intramuscularly.8
All macaques were killed 6 months after vector administration and a complete necropsy and pathology assessment were performed. Tissues (indicated below) were collected and a portion of each flash frozen and kept at −80 °C for measuring vector distribution by QPCR. Additional tissue samples were formalin fixed, sectioned, stained with hematoxylin and eosin, and then subjected to histopathological evaluation. To ensure the accuracy of the QPCR assay, all tissue samples were obtained using separate disposable scalpels to minimize contamination. Also, samples were obtained in the following specific order: the left and right testis, left and right lower lung, heart (left ventricle, right ventricle and septum), left and right kidney, spleen, liver (left and right side), left submandibular salivary gland, left cervical lymph nodes (that is, draining the left parotid), left parotid (from three sites: superior, middle and inferior section), right submandibular salivary gland, right cervical lymph nodes (that is, draining the right parotid) and finally the targeted right parotid (from three sites: superior, middle and inferior section), as in the AAV2 vector study.8 Thereafter, genomic DNA was extracted from frozen tissues using the Wizard Genomic DNA Purification kit (Promega, Madison, WI, USA). Detection of vector copies present in extracted genomic DNA samples was achieved by QPCR, as described previously.8 No reference gene was used in this assay. A total of 1 μg of genomic DNA was used per reaction, which contained 2 × TaqMan Universal PCR Master Mix (PE Applied Biosystems), 15 pmol of each of the PCR primers, 10 pmol TaqMan probe in a total volume of 50 μl. For each sample, amplification was performed in duplicate using an ABI PRISM 7700 sequence detection system (PE Applied Biosystems). The reaction mixture was incubated at 50 °C for 2 min, 95 °C for 10 min, then for 40 cycles of denaturation at 95 °C for 15 s, and finally for annealing and extension at 60 °C for 1 min. The data are reported as the mean number of vector genome copies/105 cells.29
Serum and salivary Epo levels were measured using a human Epo Elisa kit (StemCell Technologies, Vancouver, Canada) that crossreacts ~40% with rhesus RhEpo.30,31 At each indicated time point, a complete blood count and serum chemistry analysis were performed on all animals.
Assessment of concatamer formation
Genomic DNA from the middle portion of the parotid glands of the high dosage groups of AAV2- and AAV5-transduced monkeys was extracted with the Wizard Genomic DNA Purification kit (Promega). Two hundred ng DNA for AAV2 and 2 μg DNA for AAV5 were used for PCR reactions. The conditions used for the QPCR assays were as follows: 95 °C for 5 min, then 95 °C for 1 min, 60 °C for 1 min and 72 °C for 4 min for 40 cycles. The primers RhEpoF1 (5′-TATGCCTGGAAGAGGATGG AGGTC-3′) and RhEpoB3 (5′-CAGAAAGTGTCAGCAG TGATGGTTC-3′) were used to amplify a 268 bp product of the RhEpo cDNA (see Figure 3a). In the RhEpo gene these primers would yield a product that crosses two exons and thus results in different sized fragments obtained from genomic DNA and cDNA. The primers RhEpoBF3 (5′-GAACCATCACTGCTGACACTTTCTG-3′) and RhEpoFB1 (5′-GACCTCCATCCTCTTCCAGGCATA-3′) were used to amplify an ~1 kb product and would indicate formation of a head–tail concatamer if present. Primer RhEpo B3 alone was used to amplify an ~2 kb product that would indicate the formation of a head–head concatamer. Primer RhEpo F1 alone was used to amplify an ~1 kb product that would indicate the formation of a tail–tail concatamer. For Plasmid-Safe DNase assays, genomic DNA (400 ng), obtained as above, was digested with 10 μl of Plasmid-Safe ATP-dependent DNase (Epicentre, Madison, WI, USA) plus 20 μl of 25 mM ATP and 10 μl of buffer for 16 h. Thereafter, half of the digested DNA sample was subjected to electrophoresis in 1% agarose and the other half was used as a template for a PCR reaction using the primers RhEpoF1 and RhEpoB3 (see Figure 3).
Measurement of neutralizing antibodies
Neutralizing antibody assays were preformed essentially as described using Cos cells (7 × 10³) plated in each well of a flat-bottomed 96-well plate9 and incubated with an antibody-vector mixture containing a set amount of vector (AAV2 or AAV5 encoding β-galactosidase9) and serial dilutions of serum. The antibody-vector mixture was prepared by first heat inactivating the sera at 56 °C for 30 min. Then twofold serial dilutions of the sera were made starting at a 1:25 dilution using media with 1% fetal calf sera as the diluent. Diluted AAV2 or AAV5 vectors, sufficient to transduce 10–30 cells per well, were added to serum dilutions and incubated for 1 h at 37 °C. Thereafter, the antibody-vector mixture was placed on the cells, which were then incubated for 1 h. Next, the antibody-vector mixture was removed, complete media added, and the cells incubated for 30 h at 37 °C before fixing and assaying for AAV-transduction activity 24 h at 37 °C. Cells were fixed and stained for β-galactosidase activity 24 h at 37 °C with 5-bromo-4-chloro-3-indolyl-β-D-galactopyranoside (X-Gal; Gold BioTechnology, St Louis, MO, USA), and transduced cells were visually counted using a light microscope, as described.9 Neutralizing titers were calculated as the highest dilution that inhibited transduction by 50%. Any serum dilution that had a greater than 50% reduction in the number of positive cells compared with serum-free media was considered to be positive. All samples were assayed in triplicate.
Assessment of CTL responses
To screen for T-cell responses to AAV5 capsid antigen, we used ELISPOT assays for IFNγ secretion after stimulation of PBMCs isolated from two high-dose monkeys (4727, 4731) using different ratios of effectors (PBMC) to target cells (uninfected or AAV5-transduced autologous fibroblasts). Briefly, autologous skin fibro-blasts were obtained from the two macaques receiving the high vector dose. Fibroblasts were seeded in 24-well plates in 2 ml of complete RMPI 1640 medium containing 10% serum. The fibroblasts were transduced or not with ~5000 multiplicity of infection of AAV5 vector encoding green fluoresence protein, and transduction was confirmed by fluorescence-activated cell sorting analysis. After 24 h, fibroblasts were utilized as targets for autologous PBMCs in a IFNγ ELISPOT assay. The number of AAV5-specific CTLs was determined by counting the IFNγ spots per polyvinylidene difluoride membrane, which is proportional to the number of CTLs per well. Plates were analyzed using an imaging analysis system.
Peptide libraries consisting of 15-mers overlapping by 10 amino acids with the adjacent peptide were prepared for the AAV5 VP-1 capsid sequence (724 amino acids, 143 peptides) (Mimotopes, Raleigh, NC, USA). Two control peptides were also synthesized based on the AAV2 capsid VP-1 protein: AAV2-74 (PADVFMVPQYGYLTL) and AAV2-82 (GNNFTFSYTFEDVPF), which were reported to be active epitopes with AAV2 vectors15 (peptides 144, 145, respectively). All peptides were dissolved in 50% acetonitrile at a concentration of 3 mg ml−1 (stock solution), and arrayed in pools, each containing 12–13 peptides, such that the stimulatory peptide would be identified when two orthogonal pools were positive. Wells were plated with 3 × 10⁵ PBMCs per well into a 96-well ELISPOT plate, and incubated in the presence or absence of peptide (each peptide at 2 mg ml−1) for 24 h at 37 °C. Pools were assayed in triplicate and assays were repeated with relevant peptides. Medium alone served as a negative control, and phytohemagglutinin and concanavalin A served as a positive controls. PBMCs were isolated from the blood of each monkey and purified by buoyant density centrifugation over Ficoll-Paque (Pharmacia, Piscataway, NJ, USA). Aliquots of PBMCs were cryopreserved in the vapor phase of liquid nitrogen in RPMI 1640 supplemented with 10% fetal bovine serum (Hyclone, Logan, UT, USA), 2 mM L-glutamine, 25 mM HEPES (Invitrogen) and 7.5% dimethyl sulfoxide (Fisher Chemical, Fair Lawn, NJ, USA).
Cytokine profiling
Serum and saliva samples were obtained at each indicated time point from AAV5RhEpo-transduced macaques, as described in Figure 2. Similarly, as previously reported,8 samples were obtained from AAV2RhEpo-transduced macaques. All samples were analyzed using Searchlight protein array analyses (Pierce Biotechnology) to determine the levels of the following cytokines: granulocyte macrophage colony-stimulating factor (human protein assay), rIFNγ (primate protein assay) and MIP1b (human protein assay), tumor necrosis factor-α (primate protein assay), IL-2 (human protein assay) and IL-6 (human protein assay).
Acknowledgments
These studies were supported by the Divisions of Intramural Research of the National Institute of Dental and Craniofacial Research and the National, Heart, Lung, and Blood Institute, National Institutes of Health. We thank the animal care staff and technicians for their excellent care and handling of the animals in Building 102 of the NIH Animal Facility in Poolesville, MD, USA.
Footnotes
Conflict of interest
The authors declare no conflict of interest.
References
- 1.Zufferey R, Aebischer P. Salivary glands and gene therapy: the mouth waters. Gene Therapy. 2004;11:1425–1426. doi: 10.1038/sj.gt.3302321. [DOI] [PubMed] [Google Scholar]
- 2.Baum BJ, Voutetakis A, Wang J. Salivary glands: novel target sites for gene therapeutics. Trends Mol Med. 2004;10:585–590. doi: 10.1016/j.molmed.2004.10.003. [DOI] [PubMed] [Google Scholar]
- 3.Shan Z, Li J, Zheng C, Liu X, Zhang C, Goldsmith CM, et al. Increased fluid secretion after adenoviral-mediated transfer of the human aquaporin-1 cDNA to irradiated miniature pig parotid glands. Mol Ther. 2005;11:444–451. doi: 10.1016/j.ymthe.2004.11.007. [DOI] [PubMed] [Google Scholar]
- 4.Wang J, Voutetakis A, Zheng C, Baum BJ. Rapamycin control of exocrine protein levels in saliva after adenoviral vector-mediated gene transfer. Gene Therapy. 2004;11:729–733. doi: 10.1038/sj.gt.3302225. [DOI] [PubMed] [Google Scholar]
- 5.Voutetakis A, Kok MR, Zheng C, Bossis I, Wang J, Cotrim AP, et al. Reengineered salivary glands are stable endogenous bioreactors for systemic gene therapeutics. Proc Natl Acad Sci USA. 2004;101:3053–3058. doi: 10.1073/pnas.0400136101. [DOI] [PMC free article] [PubMed] [Google Scholar]
- 6.Ferber D. Gene therapy: safer and virus free? Science. 2001;294:1638–1642. doi: 10.1126/science.294.5547.1638. [DOI] [PubMed] [Google Scholar]
- 7.Casals M, Haskins M. Large animal models and gene therapy. Eur J Hum Genet. 2006;14:266–272. doi: 10.1038/sj.ejhg.5201535. [DOI] [PubMed] [Google Scholar]
- 8.Voutetakis A, Zheng C, Mineshiba F, Cotrim AP, Goldsmith CM, Schmidt M, et al. Adeno-associated virus serotype 2-mediated gene transfer to the parotid glands of nonhuman primates. Hum Gene Ther. 2007;18:142–150. doi: 10.1089/hum.2006.154. [DOI] [PubMed] [Google Scholar]
- 9.Katano H, Kok MR, Cotrim AP, Yamano S, Schmidt M, Afione S, et al. Enhanced transduction of mouse salivary glands with AAV5-based vectors. Gene Therapy. 2006;13:594–601. doi: 10.1038/sj.gt.3302691. [DOI] [PubMed] [Google Scholar]
- 10.Di Pasquale G, Davidson BL, Stein CS, Martins I, Scudiero D, Monks A, et al. Identification of PDGFR as a receptor for AAV-5 transduction. Nat Med. 2003;9:849–855. doi: 10.1038/nm929. [DOI] [PubMed] [Google Scholar]
- 11.Kampf D, Eckardt KU, Fischer HC, Schmalisch CB, Schostak M. Pharmacokinetics of recombinant erythropoietin in dialysis patients after single and multiple subcutaneous administrations. Nephron. 1992;61:393–398. doi: 10.1159/000186955. [DOI] [PubMed] [Google Scholar]
- 12.Duan D, Sharma P, Yang J, Yue Y, Dudus L, Zhang Y, et al. Circular intermediates of recombinant adeno-associated virus have defined structural characteristics responsible for long-term episomal persistence in muscle tissue. J Virol. 1998;73:8568–8577. doi: 10.1128/jvi.72.11.8568-8577.1998. [DOI] [PMC free article] [PubMed] [Google Scholar]
- 13.Song S, Laipis PJ, Berns KI, Flotte TR. Effect of DNA-dependent protein kinase on the molecular fate of the rAAV2 genome in skeletal muscle. Proc Natl Acad Sci USA. 2001;98:4084–4088. doi: 10.1073/pnas.061014598. [DOI] [PMC free article] [PubMed] [Google Scholar]
- 14.Yan Z, Zak R, Zhang Y, Engelhardt JF. Inverted terminal repeat sequences are important for intermolecular recombination and circularization of adeno-associated virus genomes. J Virol. 2005;79 :364–379. doi: 10.1128/JVI.79.1.364-379.2005. [DOI] [PMC free article] [PubMed] [Google Scholar]
- 15.Manno CS, Pierce GF, Arruda VR, Glader B, Ragni M, Rasko JJE, et al. Successful transduction of liver in hemophilia by AAV-Factor IX and limitations imposed by the host immune response. Nat Med. 2006;12:342–347. doi: 10.1038/nm1358. [DOI] [PubMed] [Google Scholar]
- 16.Mingozzi F, Maus MV, Hui DJ, Sabatino DE, Murphy SL, Rasko JE, et al. CD8+ T-cell responses to adeno-associated virus capsid in humans. Nat Med. 2007;13:419–422. doi: 10.1038/nm1549. [DOI] [PubMed] [Google Scholar]
- 17.Kok MR, Yamano S, Lodde BM, Wang J, Couwenhoven RI, Yakar S, et al. Local adeno-associated virus-mediated interleukin 10 gene transfer has disease-modifying effects in a murine model of Sjogren’s syndrome. Hum Gene Ther. 2003;14:1605–1618. doi: 10.1089/104303403322542257. [DOI] [PubMed] [Google Scholar]
- 18.Nathwani AC, Gray JT, McIntosh J, Ng CYC, Zhou J, Spence Y, et al. Safe and efficient transduction of the liver after peripheral vein infusion of self-complementary AAV vector results in stable therapeutic expression of human Factor IX in non-human primates. Blood. 2007;109:1414–1421. doi: 10.1182/blood-2006-03-010181. [DOI] [PMC free article] [PubMed] [Google Scholar]
- 19.Auricchio A, O’Connor E, Weiner D, Gao GP, Hildinger M, Wang L, et al. Noninvasive gene transfer to the lung for systemic delivery of therapeutic proteins. J Clin Invest. 2002;110:499–504. doi: 10.1172/JCI15780. [DOI] [PMC free article] [PubMed] [Google Scholar]
- 20.Chiorini JA, Kim F, Yang L, Kotin RM. Cloning and characterization of adeno-associated virus type 5. J Virol. 1999;73:1309–1319. doi: 10.1128/jvi.73.2.1309-1319.1999. [DOI] [PMC free article] [PubMed] [Google Scholar]
- 21.Chiorini JA, Afione S, Kotin RM. Adeno-associated virus (AAV) type 5 Rep protein cleaves a unique terminal resolution site compared with other AAV serotypes. J Virol. 1999;73:4293–4298. doi: 10.1128/jvi.73.5.4293-4298.1999. [DOI] [PMC free article] [PubMed] [Google Scholar]
- 22.Schmidt M, Katano H, Bossis I, Chiorini JA. Cloning and characterization of a bovine adeno-associated virus. J Virol. 2004;78 :6509–6516. doi: 10.1128/JVI.78.12.6509-6516.2004. [DOI] [PMC free article] [PubMed] [Google Scholar]
- 23.Yan Z, Lei-Butters DC, Zhang Y, Zak R, Engelhardt JF. Hybrid adeno-associated virus bearing nonhomologous inverted terminal repeats enhances dual-vector reconstruction of minigenes in vivo. Hum Gene Ther. 2007;18:81–87. doi: 10.1089/hum.2006.128. [DOI] [PMC free article] [PubMed] [Google Scholar]
- 24.Brister JR, Muzyczka N. Rep-mediated nicking of the adeno-associated virus origin requires two biochemical activities, DNA helicase activity and transesterification. J Virol. 1999;73:9325–9336. doi: 10.1128/jvi.73.11.9325-9336.1999. [DOI] [PMC free article] [PubMed] [Google Scholar]
- 25.Lotery AJ, Yang GS, Mullins RF, Russell SR, Schmidt M, Stone EM, et al. Adeno-associated virus type 5: transduction efficiency and cell-type specificity in the primate retina. Hum Gene Ther. 2003;14:1663–1671. doi: 10.1089/104303403322542301. [DOI] [PubMed] [Google Scholar]
- 26.Scallan CD, Jiang H, Liu T, Patarroyo-White S, Sommer JM, Zhou S, et al. Human immunoglobulin inhibits liver transduction by AAV vectors at low AAV2 neutralizing titers in SCID mice. Blood. 2006;107:1810–1817. doi: 10.1182/blood-2005-08-3229. [DOI] [PubMed] [Google Scholar]
- 27.Summerford C, Samulski RJ. Membrane-associated heparan sulfate proteoglycan is a receptor for adeno-associated virus type 2 virions. J Virol. 1998;72:1438–1445. doi: 10.1128/jvi.72.2.1438-1445.1998. [DOI] [PMC free article] [PubMed] [Google Scholar]
- 28.Kaludov N, Handelman B, Chiorini JA. Scalable purification of adeno-associated virus type 2, 4, or 5 using ion-exchange chromatography. Hum Gene Ther. 2002;13:1235–1243. doi: 10.1089/104303402320139014. [DOI] [PubMed] [Google Scholar]
- 29.Lee GM, Thornwaite JT, Rasch EM. Picogram per cell determination of DNA by flow cytofluorometry. Analyt Biochem. 1984;137:221–226. doi: 10.1016/0003-2697(84)90374-9. [DOI] [PubMed] [Google Scholar]
- 30.Rivera VM, Gao GP, Grant RL, Schnell MA, Zoltick PW, Rozamus LW, et al. Long-term pharmacologically regulated expression of erythropoietin in primates following AAV-mediated gene transfer. Blood. 2005;105:1424–1430. doi: 10.1182/blood-2004-06-2501. [DOI] [PubMed] [Google Scholar]
- 31.Voutetakis A, Zheng C, Metzger M, Cotrim AP, Donahue RE, Dunbar CE, et al. Sorting of transgenic secretory proteins in rhesus macaque parotid glands following adenoviral mediated gene transfer. Hum Gene Ther. 2008;19:1401–1405. doi: 10.1089/hum.2008.034. [DOI] [PMC free article] [PubMed] [Google Scholar]
- 32.Zheng C, Vitolo JM, Zhang W, Mineshiba F, Chiorini JA, Baum BJ. Extended transgene expression from a nonintegrating adenoviral vector containing retroviral elements. Mol Ther. 2008;16:1089–1097. doi: 10.1038/mt.2008.56. [DOI] [PMC free article] [PubMed] [Google Scholar]