

Abstract
Background
Market or audience segmentation is widely used in social marketing efforts to help planners identify segments of a population to target for tailored program interventions. Market-based segments are typically defined by behaviors, attitudes, knowledge, opinions, or lifestyles. They are more helpful to health communication and marketing planning than epidemiologically-defined groups because market-based segments are similar in respect to how they behave or might react to marketing and communication efforts. However, market segmentation has rarely been used in alcohol research. As an illustration of its utility, we employed commercial data that describes the sociodemographic characteristics of high-risk drinkers as an audience segment; where they tend to live, lifestyles, interests, consumer behaviors, alcohol consumption behaviors, other health-related behaviors, and cultural values. Such information can be extremely valuable in targeting and planning public health campaigns, targeted mailings, prevention interventions and research efforts.
Methods
We describe the results of a segmentation analysis of those individuals who self-report consuming five or more drinks per drinking episode at least twice in the last 30-days. The study used the proprietary PRIZM™ audience segmentation database merged with Center for Disease Control and Prevention's (CDC) Behavioral Risk Factor Surveillance System (BRFSS) database. The top ten of the 66 PRIZM™ audience segments for this risky drinking pattern are described. For five of these segments we provide additional in-depth details about consumer behavior and the estimates of the market areas where these risky drinkers reside.
Results
The top ten audience segments (PRIZM clusters) most likely to engage in high-risk drinking are described. The cluster with the highest concentration of binge drinking behavior is referred to as the “Cyber Millenials.” This cluster is characterized as “the nation's tech-savvy singles and couples living in fashionable neighborhoods on the urban fringe. Almost 65% of Cyber Millenials households are found in the Pacific and Middle Atlantic regions of the U.S. Additional consumer behaviors of the Cyber Millenials and other segments are also described.
Conclusions
Audience segmentation can assist in identifying and describing target audience segments, as well as identifying places where segments congregate on- or offline. This information can be helpful for recruiting subjects for alcohol prevention research, as well as planning health promotion campaigns. Through commercial data about high-risk drinkers as “consumers,” planners can develop interventions that have heightened salience in terms of opportunities, perceptions, and motivations, and have better media channel identification.
Audience segmentation has its origins in marketing research (Smith, 1956). Segmentation is a marketing technique which involves grouping audiences into segments or relatively homogeneous groupings, and treating each segment separately for product development, distribution, promotional, or communications purposes. The segments are usually derived from survey data, using techniques such as cluster analysis or latent class analysis to create relatively homogenous subgroups. Segmentation studies are based on the premise that audiences differ from one another, have different lifestyles, motivations and attitudes, and follow different patterns of behavior. In the product marketing world, these data are used to identify audience groups or segments of greatest opportunity.
Market or audience segmentation is used widely as a tool in social marketing efforts. Social marketing uses marketing principles and techniques to “influence a target audience to voluntarily accept, reject, modify or abandon a behavior for the benefit of individuals, groups, or society as a whole” (Kotler et al., 2002). Thus, it is frequently employed for public health, environmental and social causes. By grouping audiences into segments that share similar attitudes and behave in similar ways, it allows social marketers to develop communications strategies, interventions or services that closely match with the characteristics, requirements, and needs of individual segments (Slater and Flora, 1991). Despite the ubiquity of audience segmentation approaches in the business, communications, and public health world (Fridinger 2002, Dutta-Bergman 2004, Lyon-Daniel 2004, Pollard 2002, Robert 2004, and McDermott 2005) this typological method has rarely been employed in alcohol research. Yet, audience segmentation methodology provides insights into the behaviors, locations, social norms, lifestyle characteristics, cultural values and other traits of high-risk populations of drinkers with whom we would most like to intervene.
In this paper, we describe, as an illustrative example, the results of a segmentation analysis of high-risk drinkers using the proprietary PRIZM™ database merged with Center for Disease Controls' (CDC) Behavioral Risk Factor Surveillance System (BRFSS) database, as conducted by a marketing research company under contract to the National Institute on Alcohol Abuse and Alcoholism (NIAAA). PRIZM™ data is drawn from multiple data sources ranging from mailing lists, total census tract and postal data, household financial and insurance data, telecommunications, internet and satellite information, actual consumer purchasing (scanner) data, consumer marketing surveys and audience measurement systems, and existing proprietary marketing databases such as AC Nielsen, Gallup, IRI, JD Power, Mediamark, Nielsen Media Research, NFO, NPD, Polk Automotive, Scarborough and Simmons. These data are then typically aggregated into clusters that characterize various subgroups (i.e. segments) within the U.S.
Having reviewed a range of available audience segmentation databases with Kirby Marketing Solutions, we understood that each product offered valuable audience research information. However, considering our mission and the limited resources available for this purchase, we determined that Medstat's BRFSS/PRIZM merged dataset offered us the most valuable information to meet our most immediate needs at a reasonable cost. By integrating geographic, lifestyle and health information from a number of credible sources (BRFSS survey, census data, credit card purchases, DMV and other public records, etc.) this product provided information on lifestyle clusters, drinking habits, and geodemographic trends that could best inform current NIAAA activities, such as media campaigns, distribution of materials, constituent and congressional relations, and liaison partner selection. It also provided a context for any future NIAAA publications that may address binge drinking and/or young adults.
It is noteworthy that these audience data are not substitutes for more precise population rates of various attributes or conditions, such as NHIS or BRFSS studies of incidence or prevalence of high risk drinking. These data are however good approximations of more precise data (Pollard, 2002) and provide the extra benefit of describing the sociodemographic characteristics of high-risk drinkers as an audience; where they tend to live, their lifestyles, their interests, their consumer behavior, their alcohol consumption behavior, their other health-related behaviors, cultural values, and describe their relative size in the U.S. population. The richness of these data characterizing high-risk drinkers clearly lends itself to the generation of hypotheses concerning putative public health interventions that might target specific populations or locations in order to attenuate this pattern of risky alcohol consumption, and reduce its associated public health burden. In addition, the results are informative from the perspective of research subject recruitment by describing those settings where problem drinkers are most likely to be found, and informing on how to best reach this audience.
Material and Methods
Data Sources
These analyses was conducted using the proprietary PRIZM™ (Claritas, Inc., San Diego, California) syndicated audience segmentation system merged with the CDC's BRFSS database purchased from Thomson Medstat, Inc. (Ann Arbor, MI). The analyses were conducted by Kirby Marketing Solutions (SDK). PRIZM™ segmentation divides all U.S. households into 66 clusters; starting with stratification by three affluence levels (high, middle and low), then layering on population density based upon four distinct categories (urban, suburbs, 2nd cities, and town & country), resulting in 12 social groups. The geographic nature of the data enables users to identify clusters at the national, state, country, city, zip code and block group (∼300 households). Thus, users can identify where their target audiences live, where they work, shop, received medical care, as well as characterizing the communities in which they live.
Consumer information is merged with the demographic dataset. PRIZM™ integrates proprietary data from the Simmons Market Research Bureau (Ft. Lauderdale, Fla). Simmons measures over 30,000 American consumers each year using statistically projectable samples. Simmons' samples include the largest representation of all Americans, including, Hispanic, African American, Asian and other consumers and are used by over 500 clients worldwide to provide the most complete picture available on America's consumers. PRIZM™ provides a core database of all U.S. census demographic data, public records (such as Department of Motor Vehicle data), private sector purchasing databases (such as credit card and store scanner data), and Simmons consumer data. PRIZM™ then categorizes all U.S. households into 66 clusters based on based upon affluence, geography, population density, and consumer and lifestyle data. Clusters account for 93% of the variance in the data, and are identified with folksy nick-names. Detailed descriptions of the characteristics of these 66 clusters may be found on the Claritas, Inc. website: http://www.claritas.com/MyBestSegments/Default.jsp. The authors have changed the proprietary names of the Claritas clusters in accordance with licensing requirements.
The Behavioral Risk Factor Surveillance System (BRFSS) is a state-based system of health telephone surveys that collects information on health risk behaviors, preventive health practices, and health care access primarily related to chronic disease and injury. It was started by the Center for Disease Control in 1984. Currently, data are collected monthly in all 50 states, the District of Columbia, Puerto Rico, the U.S. Virgin Islands, and Guam. More than 350,000 adults are interviewed each year for the BRFSS.
Methods
For the analyses reported herein, the 2004 BRFSS national data (based on the 2004 U.S. census) on high-risk drinking was merged with the PRIZM™ cluster database. PRIZM™ and BRFSS data were merged using a proprietary algorithm based on the demographics of each PRIZM™ cluster, which is then “reverse engineered” from BRFSS to a cluster assignment using detailed respondent demographics. The model was tested multiple times with multiple similar items between datasets to ascertain the best matching algorithm. The algorithm itself is proprietary and unavailable for dissemination but is a process used successfully and widely by the vendor to merge private sector datasets that do not provide a direct street address for importing into PRIZM™.
We utilized the BRFSS question “considering all types of alcoholic beverages, how many times during the past 30 days did you have 5 or more drinks on one occasion” as the index measure of high-risk drinking. This measure was chosen because it reflects the level of ethanol intake at which impairment in psychomotor and cognitive functioning is significantly increased (Dawson et al., 1996) and numerous adverse social, medical, occupational, and legal outcomes of drinking increase (e.g. Greenfield, 2001; Rehm et al., 2005; Wechsler and Nelson, 2006), as the frequency of consuming 5+ drinks rises. In addition, it is a standard BRFSS consumption measure, has multiple years of data, has been reliability and validity tested, and was available to be merged into the PRIZM™ dataset. The Claritas PRIZM™ cluster provided a framework into which all clusters were placed. This framework consists of Lifestage, age and presence of children, as well as Social Groups, a measure of urbanization. The first step in cluster assignment is the designation of the Social Group and Lifestage for each survey respondent contained in the BRFSS dataset.
The additional characteristics used to further differentiate clusters were:
Income
Education
Race
Ethnicity (Hispanic or non-Hispanic)
An analysis of the national averages of the cluster demographics was used to determine the cut points for the variables used to determine the final cluster assignments. Each record was then assigned a cluster based on its own particular combination of Lifestage, Social Group, income, education, race and ethnicity.
Our initial evaluation demonstrated that 14.9% of the BRFSS sample responded affirmatively to having a heavy drinking episode once in the last thirty days. In order to focus on a higher-risk drinking grouping, we used a threshold of having at least two such 5+ drinking episodes in the last 30 days, as endorsed by 6.1% of the BRFSS sample. This better serves our purpose of identifying characteristics of individuals at greatest risk for the consequences of heavy drinking.
We report herein on the audience clusters that are 50% or more likely than the US average to engage in high-risk drinking at least twice in the last 30 days. This metric is based on the calculation of a proprietary index of concentration (IOC) measure. Such concentration measures are widely used tool in marketing research, although no universally accepted market concentration measure exists (Xu, 2005). In this case, the IOC is a cluster's relative propensity to engage in a behavior, compared to all other clusters. The procedure is as follows. The number of people within a cluster who self-report a behavior is divided by the total number of people within that cluster. This provides a proportion of those behaving versus the entire cluster. For example, Cyber Millenials consisted of 2,538,595 people in 2004 and 314,219 (12.4%) Cyber Millenials reported binge drinking at least twice in the last 30 days. The IOC then compares binge drinking for a cluster to the US average. In the U.S. 6.1% of all respondents reported binge drinking in 2004 and 12.4% of Cyber Millenials reported binge drinking, thus the IOC is 203 (12.4%/6.1%). Cyber Millenials members are therefore 2.03 times more likely to be binge drinkers than the US average. In this sense, the IOC acts much like a relative risk measure in public health.
NIAAA staff then selected a subset of five of the ten clusters for more in-depth analysis. We selected this subset primarily due to cost constraints of purchasing full PRIZM™ profiles for all ten clusters that reported binge drinking at 150% or more of the US average. We began the process by selecting clusters that had a youth focus because 1) a youth focus is consistent with NIAAA programming and 2) youth represent an important time period in which to intervene to minimize the most damage done by excessive alcohol intake. In addition, 3) these 5 clusters represent 20% of all binge drinkers (a sizeable group to reach), and these five clusters have one and half to two times the average propensity to have members who are binge drinkers. We also reasoned that NIAAA could more cost-effectively plan for the purchase of mass media, social media, or community-based outreach if there were common communication channels among a subset of clusters. This is not to suggest that the messages might be the same for all of the clusters in the subset, only that common channels might offer some economies of scale.
Results
Top High-Risk Drinking Market Segments
Table 1 displays the top ten market segments wherein individuals have endorsed having 5 or more drinks on one occasion at least twice in the last 30 days ranked according to IOC scores. These top ten high-risk drinking clusters, in order of endorsement rates and IOC scores, are described as follows:
Table 1.
Top ten PRIZM™ lifestyle clusters for having consumed 5 or more drinks on one occasion twice in the last 30 days ranked according to Index of Concentration (IOC) scores. Data are presented for the total cluster size (based on 2004 18+ U.S. Census), its percentage of the total U.S. Census, the number of endorsements within each cluster, and the percentage of respondents within each cluster endorsing this drinking question, and the respective IOC (IOC indexes response prevalence within a cluster relative to the U.S. at large).
| Cluster “Nickname” | Cluster Size | Percentage of Total 2004 U.S. Census | Number of Endorsements | Percent of Cluster | Index of Concentration (IOC) |
|---|---|---|---|---|---|
| Cyber Millenials | 2,538,595 | 1.2% | 314,219 | 12.4% | 203 |
| Laid Back Towners | 3,282,146 | 1.5% | 393,209 | 12.0% | 196 |
| City Producers | 3,459,313 | 1.6% | 399,658 | 11.6% | 189 |
| Metro Newbies | 2,923,832 | 1.3% | 333,740 | 11.4% | 187 |
| Avant-Garde Mix | 3,890,783 | 1.8% | 409,626 | 10.5% | 172 |
| Mobile Ladder Climbers | 2,460,703 | 1.1% | 258,145 | 10.5% | 172 |
| Movers & Shakers | 3,574,848 | 1.6% | 357,822 | 10.0% | 164 |
| City Backyarders | 3,241,704 | 1.5% | 319,034 | 9.8% | 161 |
| Content Suburbanites | 3,792,853 | 1.7% | 355,847 | 9.4% | 154 |
| Stable Burbans | 2,686,919 | 1.2% | 248,816 | 9.3% | 152 |
The cluster with the highest concentration of endorsements of this high-risk behavior is referred to as the “Cyber Millenials”. Among those in “Cyber Millenials,”12.4% have endorsed this harmful pattern of drinking (IOC= 203). According to Claritas, Inc., this cluster is characterized as “the nation's tech-savvy singles and couples living in fashionable neighborhoods on the urban fringe. Affluent, highly educated and ethnically mixed, Cyber Millenials communities are typically filled with trendy apartments and condos, fitness clubs and clothing boutiques, casual restaurants and all types of bars-from juice to coffee to microbrew.” Their age ranges from 25-44 years. Their median household income is $79,151. They are likely to be married with a spouse present in the household. Members of this cluster are likely to be White, Asian or Hispanic. People in this cluster are more likely to have professional degrees, doctorates, masters, and bachelors. They are most likely to be employed in the scientific and manufacturing professions. Almost 65% of Cyber Millenials households are found in the Pacific and Middle Atlantic regions of the U.S.
The next cluster with an elevated high-risk drinking rate is called “Laid Back Towners”, with 12% endorsing this behavior (IOC = 196). According to Claritas, Inc, this cluster is characterized as “a collection of middle-aged, upper-middle-class households that have started to empty-nest. Workers here- and most households boast two earners-have well-paying blue- or white collar jobs, or own small businesses. Today these Baby-Boom couples have the disposable income to enjoy traveling, owning timeshares and going out to eat“. Their ages range from 35-54 years. Their median household income is $68,708. They are likely to be married and white. People in this cluster are likely to have graduated high school and have at least some college. They tend to be employed in management positions, and live in towns and rural areas.
Next, is a cluster referred to as “City Producers” with 11.6% endorsing high-risk drinking (IOC= 189). It is noted that “City Producers is often the first stop for up-and-coming immigrants from Asia, South America and Europe. These young singles and couples are typically college-educated and ethnically diverse: about a third are foreign-born, and even more speak a language other than English. City Producers are concentrated in the nation's port cities. Their ages range from 25-54 years. Their median household income is $ 34,157. They tend to be renters rather than home owners. People in this cluster tend to have some college or be college graduates. Their employment pattern is varied.
Claritas defines “Metro Newbies” as “young, multi-ethnic singles have settled in neighborhoods filled with cheap apartments and a commercial base of cafes, bars, laundromats, and clubs that cater to “twenty-somethings”. One of the youngest segments in America-with ten times as many college students as the national average-these neighborhoods feature low incomes and high concentrations of Hispanics and African-Americans. Their ages are typically under 35 years. Their median household income is $22,891. They tend to be renters, and have some college education since many are still in school. When employed, they are found in sales and technical positions. 11.4% of “Metro Newbies” endorse high risk drinking (IOC= 187).
The next cluster is referred to as “Avant-Garde Mix”. They define this cluster as “a collection of young, mobile and liberal urbanites. Its residents are a progressive mix of young singles and couples, students and professionals, Hispanics, Asians, African-Americans and whites. Frequently living in row houses and apartments, Avant-Garde Mixers are the early adopters who are quick to check out the latest movie, nightclub, laptop and microbrew.” Their ages are typically between 25 and 54 years. Their median income is $49,806. They are more likely to have bachelor's degrees or some college. They tend to be employed in retail, healthcare, professional scientific and technical and manufacturing sectors. Among “Avant-Garde Mixers”, 10.5% endorse high risk drinking (IOC =172).
A similar level of high risk drinking may be found among the “Mobile Ladder Climbers” (IOC=172). Claritas defines this cluster as “a stopover for young, midscale singles before they marry, have families and establish more deskbound lifestyles. Found in second-tier cities, these mobile” twenty-somethings” include a disproportionate number of recent college graduates who are into athletic activities, the latest technology and nightlife entertainment.” Their age tends to be between 25 and 54 years. Their median household income is $47,044. People in this cluster tend to have high school diplomas, some college or a bachelor's degree. They tend to be employed in retail or manufacturing positions.
The next cluster is the “Urban Upstarts”. Ten percent of these individuals endorse high-risk drinking practices (IOC = 164). They are defined as “home to America's up-and-coming business class: a wealthy suburban world of dual-income couples who are highly educated, typically between the ages of 35 and 54 and often with children. Given its high percentage of executives and white-collar professionals, there's a decided business bent to this segment: “Urban Upstarts” rank number-one for owning a small business and having a home office.” Median household income is reported to be $98,031. People tend to be college graduates employed in management positions.
“City Backyarders” is a group defined as “well-off, middle-aged couples settled in the nation's satellite cities. Residents of these typical “DINK” (double income, no kids) households have college educations, well-paying business and professional careers and swank homes filled with the latest technology.” The median household income for this group is reported to be $69,005. This cluster tends to be predominantly white or Asian. The index level of high-risk drinking is endorsed by 9.8 % (IOC =161).
The residents of “Content Suburbanites” are described as tending to be “upper-middle-class married couples living in mid-sized homes with few children in predominantly suburban surroundings. The adults in the segment, mostly between the ages of 25 and 54, have gone to college and hold professional and white-collar jobs. With their upscale incomes and small families, these folks have fashioned comfortable lifestyles, filling their homes with toys, TV sets and pets.” High-risk drinking is endorsed by 9.4% (IOC= 154).
“Stable Burbans” represents a collection of mid-scale, middle-aged singles and couples living in the heart of suburbia. High-risk drinking is endorsed by 9.3% (IOC= 152). Typically members of the Baby Boom generation, they hold decent jobs, own older homes and condos, and actively pursue the American Dream. They tend to be conservative. Among their favorite activities are jogging on treadmills, playing trivia games and renting videos. The median household income for this group is $49,535. Their ethnic makeup tends to be black, white, Asian and mixed.
In-Depth Description of Five Youth-Oriented High-Risk Drinking Segments
As discussed previously, NIAAA has an interest in youth-oriented outreach, has research to suggest that youth benefit the most from early outreach, and youth behaviors are less entrenched than adults, so more amenable to change. NIAAA was also keenly aware that funding for tailored outreach for each of the five youth-oriented PRIZM™ clusters was unlikely. It was more likely that funding would be available to support one or two programs. Therefore an analysis of common factors across the five youth clusters was conducted to identify potential opportunities for aggregating PRIZM™ clusters into larger but similar target groups. Specifically, we selected the “Cyber Millenials”, “Avant-Garde Mix”, “City Producers”, “Metro Newbies” and “Mobile Ladder Climbers” for further study. The predominant demographic and geographic characteristics of these five market segments are displayed in Table 2. See Figure 1 for a diagram of the decision making process.
Table 2.
Predominant demographic and geographic characteristics of those market segments selected for further descriptive analysis. Two of the clusters have members predominantly under age 35 and three have members predominantly up to age 44. Most of the clusters are predominantly occupied by singles, but three clusters also have some young couples. Most of the clusters' members have high school or some college education, while two have college graduates and advanced degreed members. Four of the clusters have jobs in White Collar industries, while three also work in a Professional occupation. Two clusters also have members who hold occupations in the Service industry.
| Aggregate Predominant Demographic and Geographic Characteristics | |||||
|---|---|---|---|---|---|
| Cyber Millenials | Avant-Garde Mix | City Producer | Metro Newbies | Mobile Ladder Climbers | |
| Ethnic Diversity IOC | Asian – 366 | Asian – 320 | Asian – 299 | Black - 139 | Asian – 139 |
| Pac. Is -171 | Hisp. - 198 | Multi - 203 | Asian – 125 | Pac. Is. 156 | |
| Multi - 139 | Multi - 196 | Hisp. – 181 | Multi - 139 | Multi - 134 | |
| Hisp – 107 | Black - 111 | Black -154 | Am. Ind. 118 | White - 101 | |
| Dominant Ages | 25-44 | 18-44 | 25-44 | 18-34 | 18-34 |
| Family Type | Singles Couples |
Singles Couples |
Singles Couples |
Singles | Singles |
| Education | College Grad + |
College Grad+ |
H.S./Coll.. | H.S./Coll. | H.S./Coll. |
| Employment | Prof. | Prof., White Collar | White Collar, Service | White Collar, Service | Prof., White Collar |
| Urbanicity (urban, suburban, towns, rural) | Urban | Urban | Urban Suburban | Towns, Suburb Fringe, Urban Fringe | Towns, Suburb Fringe, Urban Fringe |
| Dominant Region | Pacific, Mid-Atlantic | Pacific, Mid-Atlantic | Pacific, Mid-Atlantic | Nationwide | South-Atlantic, Pacific |
| Median Income | $79,151 | $49,806 | $32,686 | $22,349 | $47,044 |
| # Households | 1,386,243 | 2,041,592 | 1,873,577 | 1,366,001 | 1,351,726 |
| Other Factors | Most tech-savvy, highly educated, ethnically mixed | Most liberal lifestyles, & entertainment early adopters | Large immigrant pop., 1/3 are bilingual | 10 times No. of College students | Many are recent college graduates into the nightlife |
| High-Risk Drinking IOC | 203 | 172 | 189 | 187 | 172 |
Figure 1.
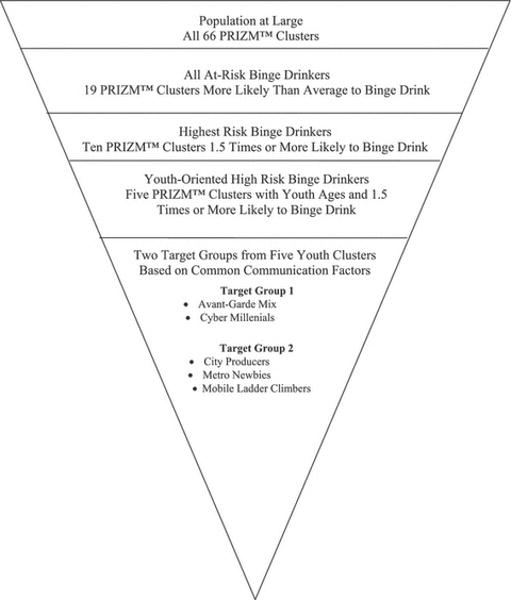
The “Avant-Garde Mix” and “Cyber Millenials” share similar education, occupation, geography, ethnic mix, life stage, social group, income factors, and a myriad of consumer and lifestyle behaviors. The remaining three clusters, “City Producers”, “Metro Newbies”, and “Mobile Ladder Climbers” share similar education, life stage, occupation, geography, incomes, and consumer and lifestyle behaviors. As can be seen, two of the clusters have members predominantly under age 35 and three have members predominantly up to age 44. All five clusters represent urban environments in varying degrees, with two also encompassing towns and suburban fringe areas. Four of the clusters are geographically located in Pacific, Mid-Atlantic, East-Central, and South-Pacific coastal regions, while one cluster has no specific geographic attributes. Although each of the five selected clusters has a predominance of White members, the clusters are also overrepresented by ethnically diverse populations.
Media Markets
In the media marketing world, Designated Market Areas (DMA) are large geographic coverage areas for mass media markets. Specifically, they are regions where the population can receive the same or similar television, radio station offerings and may include newspapers and internet content. As can be seen in Table 3, there are eleven DMAs that cover 47% of all of the five high-risk drinking clusters (3,776,029 individuals). These 11 DMAs can provide an efficient and focused approach to reaching target populations. These large urban DMAs provide reach to high-risk drinking clusters in the following proportions:
Table 3.
Designated Market Areas (DMAs) that are shared in common by the high-risk drinking clusters identified herein. These 11 DMAs offer 47% coverage of all of the five high-risk drinking clusters.
| DMA Representation by Multiple Clusters: (Cyber Millenials (CM), Avant-Garde Mix (AGM), City Producers (CP), Metro Newbies (MN), Mobile Ladder Climbers (MLC) | |||
|---|---|---|---|
| Eleven DMAs with high proportion of cluster population: | Cluster Represented at High Rate | Combined Cluster Population within DMA | |
| 1. Austin, TX | AGM, CP | 55,416 | |
| 2. Boston, MA | CM, AGM | 185,104 | |
| 3. Charlottesville, VA | MN, MLC | 9,087 | |
| 4. Chicago, IL | CM, AGM, CP | 429,140 | |
| 5. Lafayette, IN | MN,MLC | 12,199 | |
| 6. Las Vegas, NV | CM, AGM | 28,962 | |
| 7. Los Angeles, Ca. | AGM, CP, CM | 830,856 | |
| 8. New York, NY | CM, AGM, CP | 1,248,406 | |
| 9. San Diego, California. | AGM,CP,MLC | 107,292 | |
| 10. San Francisco, Ca. | AGM, CM, CP | 669,123 | |
| 11. Washington DC | AGM, CM | 200,444 | |
| Total Coverage | 3,776,029 (47% potential reach) | ||
Cyber Millenials (83% reach)
Avant-Garde Mix (83% reach)
City Producers (53% reach)
Mobile Ladder Climbers (25% reach)
Metro Newbies (10% reach)
These geographic regions could be suitable venues for transit ads, DMA-specific magazine, radio, and cable advertising, community prevention campaigns, research recruitment, or even identifying high potential areas for health agency collaboration.
Media Usage
PRIZM™ data also provides mass media usage information for cable and network TV usage, specific TV show viewership, radio format and time of day listening, and newspaper and magazine readership. Table 4 shows the 2004 activities with the high Index of Concentration (IOC > 150) and double digit proportions of the cluster usage for each media source for the high-risk drinking segments. The common activities row in the Table indicates media activities that are common to two or more clusters, representing an opportunity to reach multiple clusters with the same mass media elements.
Table 4.
Mass media usage information for cable and network TV usage, specific TV show viewership, radio format and time of day listening, and newspaper and magazine readership for the high-risk drinking clusters in 2004. The common activities row in the Table indicates activities that are common to two or more clusters, representing an opportunity to reach multiple clusters with the same media activities.
| High Concentration and High Participation in Media Activities Among High-Risk Drinking Clusters (2004) | ||||
|---|---|---|---|---|
| Cable and Network TV Watched | TV Shows Watched | Print Media Read (magazines and newspapers) | Radio Station Type Listened to | |
| Cyber Millenials | MTV BET Travel Channel E! Men's Pro Basketball |
Smallville MTV-Road Rules Tour de France US Open Men's |
LA Times NY Times Scientific American Fortune Travel & Leisure Sunset |
Jazz Alternative Radio Classical All News News/Talk |
|
Types of Magazines: Science/Tech Mags Travel Mags |
Listen When Weekdays 10am-7pm (2+ hours) |
|||
|
Read Newspaper Sections: Entertainment Sports Movie Listings | ||||
| Avant-Garde Mix | BET MTV E! VH-1 Game Show Network Food Network Cinemax Bravo Showtime Starz TV Land HBO Evening Animation |
MTV-Road Rules Bernie Mac Mad TV Seinfeld Reruns BET Comic View Great Hotels MTV- Real World |
Specific Print NY Times LA Times New Yorker Harper's Bazaar Vibe Vogue Men's Health Essence |
Easy Listening Soft Contemporary Rock Urban Contemporary MLB & Sports Playoffs Adult Contemporary |
|
Types of Magazines: Science/Tech Mags Travel Mags Women's Fashion Mags Food |
Listen When Weekends 10a-3p |
|||
|
Read Newspaper Sections: Travel | ||||
| City Producers | MLS Soccer BET Evening Animation VH1 MTV Prof. Basketball Cartoon Network Showtime |
Malcolm in the Middle BET, 106 & Park Fear Factor |
NY Times, Sunday GQ Elle Essence Vogue |
Urban Contemporary |
|
Types of Magazines Women's Fashion |
Listen When | |||
| Metro Newbies | Indy Car Racing Pay-per-View Sports Movie Channel Showtime Primetime period All Day viewing |
ESPY Awards Chapelle Show Nascar South Park |
ESPN magazine Maxim Playboy Jet Vogue Ebony Use Yellow Pages 1-3/wk |
College Basketball Nascar Racing Alternative Radio College Football |
| Mobile Ladder Climbers | MTV VH-1 Cartoon Network Evening Animation |
Discovery-Monster House Joe Millionaire Whose Line Is It Travel – World's Best |
Men's Health Entertainment Weekly Cosmopolitan National Enquirer |
Contemporary Hits |
| Watch:Saturdays 12-1pm |
Listen When Weekdays 3p-7p |
|||
Alcoholic Beverage and Tobacco Preferences
The alcoholic beverage preferences for all five high-risk drinking clusters were also examined. We selected beverage preferences that were high in concentration (>150) and high in participation (>10%). The beverage choices common to two or more high-risk drinking clusters are displayed in Table 5 along with cluster specific preferences. Knowing the actual beverage preferences of high-risk drinking clusters can provide data that can be used for targeted communication, community outreach, and even possibly industry partnerships.
Table 5.
Beer, wine, liquor preferences and tobacco smoking rates are displayed for high-risk drinking clusters. The final rows display beer, wine and liquor preferences common to two or more clusters.
| High-Risk Drinking Cluster Beverage Preferences and Tobacco Usage (IOC >150 and Participation > 10%) | ||||
|---|---|---|---|---|
| Cluster Name | Beverages | Tobacco | ||
| Cyber Millenials |
Beer Bass Corona Micro Brew Sam Adams Sierra Nevada |
Wine Dom. Red (5-13 /mo.) Imported Red Imported White Imported Port/Sherry Wine |
Liquor Bailey's Gin Kahlua Vodka (5-13/mo.) |
11.9% smoking rate, lower than US average |
| Avant-Garde Mix |
Beer Bass Beer Corona Guinness Ale Heineken Lager |
Wine Imported Imported Red Imported White Sutter Home Dom. |
Liquor Cognac Rum (5-7/mo.) |
U.S. average smoking rate |
| City Producers |
Beer Corona Heineken Lager Micro Brew |
Wine Imported White Imported Red |
Liquor None with high IOC |
U.S. average smoking rate |
| Metro Newbies |
Beer Budweiser Heineken Lager Imported Beer (11-29/mo.) Michelob Light Micro Brew Yuengling |
Wine None with high IOC |
Liquor Bailey's Bourbon (5-13/ mo.) Canadian Wh (5-13/ mo.) Kahlua |
Newport 2 times average smoking rate |
| Mobile Ladder Climbers |
Beer None with high IOC |
Wine Wine Cooler |
Liquor None with high IOC |
More likely than US to be smoker More likely than US to have tried to stop smoking and without patch |
| Common Pref. |
Beer Bass Corona Heineken Lager Micro Brew Beer |
Wine Imported Wine Imported Red Wine Imported White Wine |
Liquor Bailey's Kahlua |
|
It is noteworthy that “Metro Newbies” and “Mobile Ladder Climbers” have elevated rates of tobacco smoking beyond that of the U.S. population, while “Cyber Millenials” have lower smoking rates than the U.S. population. “Mobile Ladder Climbers” are also more likely than the U.S. average to have tried to quit smoking using multiple methods. These data also suggest that for some high-risk drinking segments, prevention communications could address drinking and smoking behavior simultaneously.
Digital Communications
Members of these high-risk drinking clusters use the Internet at higher rate than the US average. While the Cyber Millenials are the most tech-savvy cluster, the other clusters also use the Internet for connecting with people, searching for information, reading magazines, and shopping at high rates. The common behaviors are listed in the last row of Table 6. These data suggest that prevention outreach strategies or subject recruitment efforts should include an Internet component.
Table 6.
The utilization of digital communications by high-risk drinking clusters is displayed in this table. It is noteworthy that substantial internet use is a common theme across high-risk clusters suggesting that internet-based interventions might be well-received by these clusters of high-risk drinkers.
| Digital Communications (IOC >150 and Participation > 10%) | |
|---|---|
| Cluster Name | Behavior or Activity |
| Cyber Millenials |
|
| Avant-Garde Mix | |
| City Producers |
|
| Metro Newbies |
|
| Mobile Ladder Climbers |
|
| Common Themes |
|
Sports and Leisure Activities
The high-risk drinking clusters do not appear to participate in sports in large numbers, but some clusters do watch/listen to sports coverage (basketball, MLB, and NASCAR). As can be seen in Table 7, one common denominator among three of the clusters is having a liberal outlook at rates much higher than the US average. Buying music and books is also another common leisure behavior. Finally two of these clusters share an interest in Yoga and exercising at a health club. These leisure activities suggest that outreach to favorite musical artists and self-help book authors may prove effective as spokespeople for a high-risk drinking reduction campaign or other prevention activities.
Table 7.
High-risk drinking cluster members do not appear to participate at significant levels in organized sports. However, exercising at a health club and doing yoga for exercise seem to be common elements for two of these clusters. Another common denominator among three of the clusters is having a liberal outlook at rates much higher than the US average. Buying music and books is also another common leisure behavior.
| Sports and Leisure Activities (IOC >150 and Participation > 10%) | |
|---|---|
| Cluster Name | Sports and Leisure |
| Cyber Millenials | Buy Latin and Jazz Music |
| Rent/Buy Music DVDs | |
| Buy travel books, self-help and other books online | |
| Belong to Civic Club | |
| Buy electronic dolls | |
| Own snow boots/skis | |
| Exercise at Club | |
| Have liberal outlook | |
| Buy books, music, video by mail/telephone | |
| Go to Yoga, for exercise | |
| Avant-Garde Mix | Have liberal outlook |
| Exercise at Club | |
| Buy CDs (10+ yr) | |
| Buy self-help books and online | |
| Go to movies (6× in 3 mo.) | |
| Rent/Buy Music DVD | |
| Belong to CD Club | |
| City Producers | Have liberal outlook |
| Buy Rap music | |
| Buy CDs (10+/yr) | |
| Metro Newbies | Go to Yoga, for exercise |
| Go jogging or running | |
| Buy books online | |
| Mobile Ladder Climbers | Buy alternative music |
| Rent/Buy Music DVD | |
| Go camping | |
| Do painting, drawing, sculpting | |
| Common Themes | Have liberal outlook |
| Exercise at Club | |
| Buy self-help book and online | |
| Rent/Buy Music DVD | |
| Buy CDs (10+/yr) | |
| Go to Yoga, for exercise | |
Discussion
In this report, we have demonstrated how proprietary audience segmentation data can be linked to publicly-accessible epidemiological survey data to inform about the demographics, location, and consumer behaviors of individuals who engage in high-risk drinking practices or other risky behaviors. Such information could then be used as the basis for a health communications campaign, targeted distribution of informational material, public health outreach activities, community-based prevention interventions, prevention research venue selection, and even research subject recruitment strategies. Using a definition of high-risk drinking behavior (e.g. more than 5 drinks per occasion at least twice in the last 30 days), we have described the sociodemographic characteristics of these high-risk drinkers as an audience segment; where they tend to live, their lifestyles, their interests, their media preferences, their consumer behavior, their leisure activities and their other health-related behaviors. The results have allowed us to hypothesize about components of a public health intervention that might target these specific populations (i.e. audience segments) in order to reach these populations and intervene in a manner that might attenuate their pattern of risky alcohol consumption.
The utility of this approach lies in its efficiency from a cost and effort perspective. Comprehensive, community-based approaches have emerged as the most viable way of reducing the risk of alcohol and other drug use (Aguirre-Molina and Gorman, 1996; Dryfoos, 1993). Rather than engaging in a broad general prevention intervention, audience segmentation permits focusing on those subpopulations within communities at greatest risk, while it simultaneously affords useful consumer market data to tactically penetrate those high-risk sectors. While unitary media interventions in the past appeared to have had little impact on the use of alcohol, drugs and cigarettes (Flynn et al., 2006), successful media campaigns have been demonstrated to have greatest utility when integrated into broad-brush community-based prevention interventions (Aguirre-Molina and Gorman, 1996; Bryant et al., 2007) (Johnson et al., 1990) (Brannon et al., 1989) (Flay, 1986).
The incorporation of audience market information into prevention and health promotion efforts is a component of “social marketing”. Social marketing, as defined by Kotler and Andreasen (1991) (Kotler and Andreasen, 1991) “seeks to influence social behaviors not to benefit the marketer, but to benefit the target audience and the general society.” This concept has been extended to the marketing of positive health behaviors as public health interventions (Lefebvre and Flora, 1988). Important concepts in social marketing approaches include (Hastings and Haywood, 1991): consumer orientation; market segmentation and the identification of target markets; objective setting, the formulation, implementation monitoring and evaluation of the “marketing mix” (i.e. the health product, its cost, its promotion and distribution). In this report, we have only identified the target market (i.e. high-risk drinkers) employing the “consumer” perspective. The market objective of a reduction in high-risk drinking behavior has only been alluded to, and we have hypothesized a formulation based upon market information. The implementation of such a health promotion initiative is beyond the scope of this manuscript.
There are several limitations of this market segmentation approach. First, it emphasizes the use of established and proprietary market segments. Due to the proprietary nature of the databases employed, their formulation is not open to public scrutiny or scientific validation in the concurrent or predictive domains. Thus, we cannot comment on the validity of the clusters, the matching procedures or other technical points that represent the “black box” of purchased proprietary services. Second, the market segment is the unit of analysis, not the high-risk drinker within that segment. Thus, our capacity to identify characteristics of the high-risk drinker is limited to descriptions of the segment or cluster in which he or she is subsumed. Likewise, changes produced by an intervention will only be reflected in group drinking behavior, not individual differences. The third limitation is the cross-sectional nature of this approach. We employed a single index year (2004) of BRFSS data for our analyses. Thus, demographic and behavior changes since that year may reduce the accuracy of our market segmentation approach. Likewise, the characterization of audience segments by the PRIZM™ database may be markedly different in 2008. Despite these challenges and issues, we believe this process hold promise for the future because mass marketing has proven to be substantially less effective than targeted marketing, such as this example.
We hope this report has demonstrated how audience segmentation can assist in targeting venues and populations for alcohol prevention research, as well as health promotion campaigns. Through insights about the behavior of high-risk drinker as “consumer”, one can craft interventions that have heightened salience in terms of opportunities, perceptions, and motivations.
Acknowledgments
This research was supported by internal NIAAA funds.
References
- Aguirre-Molina M, Gorman DM. Community-based approaches for the prevention of alcohol, tobacco, and other drug use. Annu Rev Public Health. 1996;17:337–58. doi: 10.1146/annurev.pu.17.050196.002005. [DOI] [PubMed] [Google Scholar]
- Brannon BR, Dent CW, Flay BR, Smith G, Sussman S, Pentz MA, Johnson CA, Hansen WB. The television, school, and family project. V. The impact of curriculum delivery format on program acceptance. Prev Med. 1989;18(4):492–502. doi: 10.1016/0091-7435(89)90008-x. [DOI] [PubMed] [Google Scholar]
- Bryant CA, Brown KR, McDermott RJ, Forthofer MS, Bumpus EC, Calkins SA, Zapata LB. Community-based prevention marketing: organizing a community for health behavior intervention. Health Promot Pract. 2007;8(2):154–63. doi: 10.1177/1524839906290089. [DOI] [PubMed] [Google Scholar]
- Dawson DA, Archer LD, Grant BF. Reducing alcohol-use disorders via decreased consumption: a comparison of population and high-risk strategies. Drug Alcohol Depend. 1996;42:39–47. doi: 10.1016/0376-8716(96)01260-4. [DOI] [PubMed] [Google Scholar]
- Dryfoos JG. Preventing substance use: rethinking strategies. Am J Public Health. 1993;83(6):793–5. doi: 10.2105/ajph.83.6.793. [DOI] [PMC free article] [PubMed] [Google Scholar]
- Flay BR. Mass media linkages with school-based programs for drug abuse prevention. J Sch Health. 1986;56(9):402–6. doi: 10.1111/j.1746-1561.1986.tb05782.x. [DOI] [PubMed] [Google Scholar]
- Flynn BS, Worden JK, Bunn JY, Dorwaldt AL, Dana GS, Callas PW. Mass media and community interventions to reduce alcohol use by early adolescents. J Stud Alcohol. 2006;67(1):66–74. doi: 10.15288/jsa.2006.67.66. [DOI] [PubMed] [Google Scholar]
- Fridinger F, Macera C, Cordell K. The Use of Surveillance Data and Market Research to Promote Physical Activity. Am J Prev Med. 2002;23 doi: 10.1016/s0749-3797(02)00474-9. [DOI] [PubMed] [Google Scholar]
- Greenfield TK. Individual risk of alcohol-related diseases and problems. In: Heather N, Peters TJ, Stockwell T, editors. International Handbook of Alcohol Dependence and Problems. John Wiley and Sons; Chichester, UK: 2001. pp. 413–437. [Google Scholar]
- Hastings G, Haywood A. Social marketing and communication in health promotion. Health Promot Int. 1991;6(2):135–145. [Google Scholar]
- Johnson CA, Pentz MA, Weber MD, Dwyer JH, Baer N, MacKinnon DP, Hansen WB, Flay BR. Relative effectiveness of comprehensive community programming for drug abuse prevention with high-risk and low-risk adolescents. J Consult Clin Psychol. 1990;58(4):447–56. doi: 10.1037//0022-006x.58.4.447. [DOI] [PubMed] [Google Scholar]
- Kotler P, Andreasen A. Strategic Marketing for Nonprofit Organizations. 4th. Prentiss Hall; Saddle River, NJ: 1991. [Google Scholar]
- Kotler P, Roberto N, Lee N. Social Marketing Improving the Quality of Life. Second. Sage Publications; Thousand Oaks, California: 2002. [Google Scholar]
- Lefebvre RC, Flora JA. Social marketing and public health intervention. Health Educ Q. 1988;15(3):299–315. doi: 10.1177/109019818801500305. [DOI] [PubMed] [Google Scholar]
- Lyon-Daniel K, Honein MA, Moore C. Sharing medication among teenage girls: Potential danger to unplanned/undiagnosed pregnancies. Pediatrics. 2003;111(5 Supplement Pt 2):1167–1170. [PubMed] [Google Scholar]
- McDermott R, et al. Impact of the California Project LEAN School Board Member Social Marketing Campaign Social Marketing Quarterly. 2005;11(2):18–40. [Google Scholar]
- Dutta-Bergman Mohan J. Health Attitudes, Health Cognitions, and Health Behaviors among Internet Health Information Seekers: Population-Based Survey. Journal of Medical Internet Research. 2004;6(2):e15. doi: 10.2196/jmir.6.2.e15. URL: http://www.jmir.org/2004/2/e15/>. [DOI] [PMC free article] [PubMed]
- Pollard WE. Use of consumer panel survey data for public health communication planning: An evaluation of survey results. American Statistical Association 2002 Proceedings of the Section on Health Policy Statistics. 2002:2720–2724. [Google Scholar]
- Rehm J, Monga N, Adlaf E, Taylor B, Bondy SJ, Fallu JS. School matters: drinking dimensions and their effects on alcohol-related problems among Ontario school students. Alcohol Alcohol. 2005;40:569–574. doi: 10.1093/alcalc/agh212. [DOI] [PubMed] [Google Scholar]
- Robert J, Kerby D, Landers P. A market segmentation approach to nutrition education among low-income individuals. Social Marketing Quarterly. 2004;10(3):24–38. [Google Scholar]
- Slater MD, Flora JA. Health lifestyles: audience segmentation analysis for public health interventions. Health Educ Q. 1991;18(2):221–33. doi: 10.1177/109019819101800207. [DOI] [PubMed] [Google Scholar]
- Smith W. Product differentiation and market segmentation as alternative marketing strategies. Journal of Marketing. 1956;21:3–8. [Google Scholar]
- Wechsler H, Nelson TF. Relationship between levels of consumption and harms in assessing drink cut points for alcohol research: commentary on “many college freshmen drinking at levels far beyond the binge threshold: by White et al. Alcohol Clin Exp Res. 2006;30:922–937. doi: 10.1111/j.1530-0277.2006.00124.x. [DOI] [PubMed] [Google Scholar]
- Xu Jie. Market Research Handbook: Measurement, Approach and Practice. iUniverse; Bloomington, Indiana: 2005. pp. 87–91. [Google Scholar]