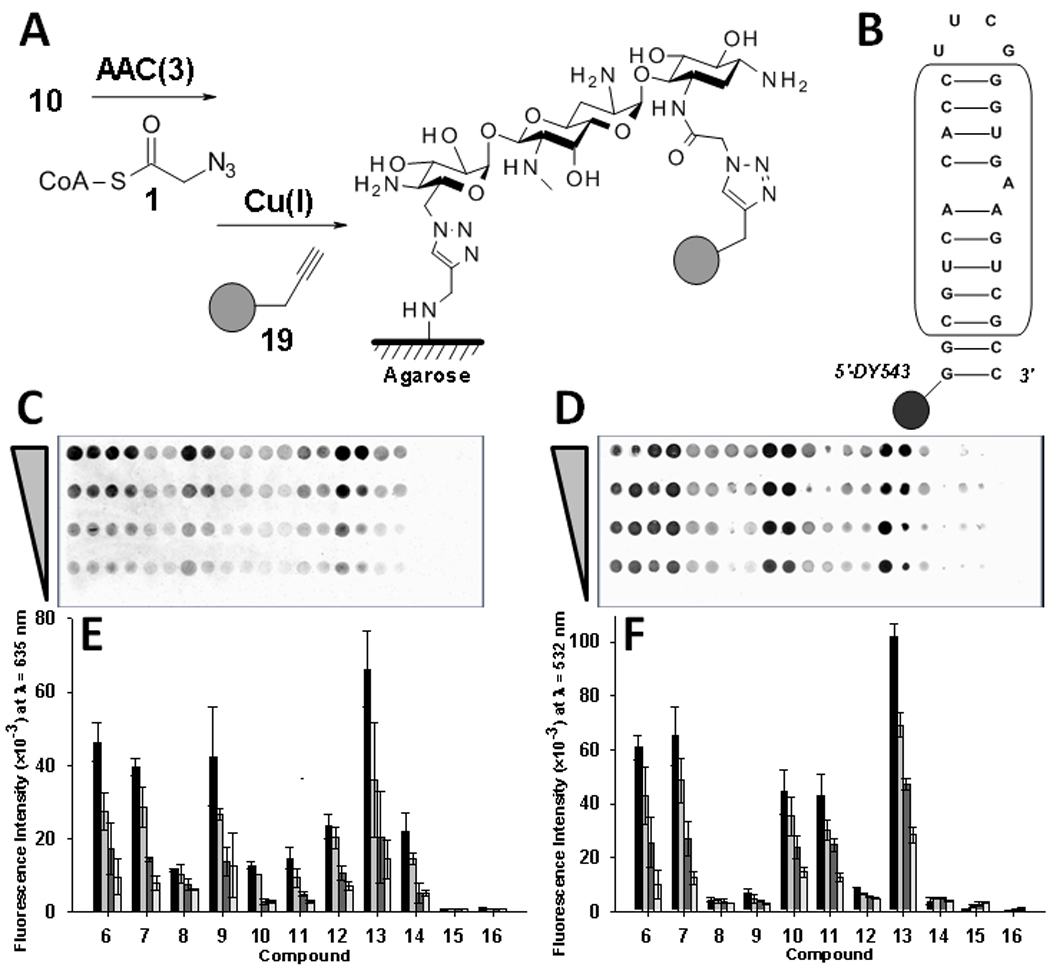
Figure 4.

Probing aminoglycoside recognition via microarray. A, Scheme for the labeling reaction. B, Secondary structure of the bacterial rRNA A-site mimic (boxed nucleotides represent those derived from the native sequence). C, Image of a microarray to study AAC(3) modification of aminoglycosides. D, Image of a microarray to study binding of an oligonucleotide mimic of the bacterial rRNA A-site. E, Representative plot of data for AAC(3) modification. F, Representative plot of data for binding of the rRNA A-site mimic. Each group of bars in the plots from left to right corresponds to delivery of 500, 250, 125, 62, and 0 picomoles of material to an array surface.
