

Abstract
Background
Transcriptional networks play a central role in cancer development. Here we describe a systems biology approach to cancer classification based on the reverse engineering of the transcriptional network surrounding the two most common types of lung cancer: adenocarcinomas (AC) and squamous cell carcinomas (SCC).
Methods
A transcriptional network classifier is inferred from the molecular profiles of 111 human lung carcinomas. We tested its classification accuracy in seven independent cohorts, for a total of 422 subjects of Caucasian, African and Asian descent.
Results
The model for distinguishing AC from SCC is a 25-gene network signature. Its performance on the seven independent cohorts achieves 95.2% classification accuracy. Even more surprisingly, 95% of this accuracy is explained by the interplay of three genes (KRT6A, KRT6B, KRT6C) on a narrow cytoband of chromosome 12. The role of this chromosomal region in distinguishing AC and SCC was further confirmed by the analysis of another group of 28 independent subjects assayed by DNA copy number changes. The copy number variations of bands 12q12, 12q13, and 12q12-13 discriminates these samples with 84% accuracy.
Conclusion
These results suggest the existence of a robust signature localized in a relatively small area of the genome, and show the clinical potential of reverse engineering transcriptional networks from molecular profiles.
Keywords: Transcriptional networks, Gene expression, Disease diagnosis, Lung cancer
INTRODUCTION
Lung cancer is the leading cause of cancer mortality, with over 1.3 million deaths a year worldwide1. Over 80% of lung cancers are non-small cell lung carcinomas (NSCLC). Adenocarcinoamas (AC) and Squamous Cell Carcinoamas (SCC) are the two most common subtypes of NSCLC and, together, account for more than 60% of lung cancer cases2. AC and SCC are categorized together in NSCLC because of the similar microscopic appearance of their tumour cells and their similar treatment options in clinics. Nonetheless, AC and SCC are heterogeneous in many clinical aspects. AC responds to chemotherapy better than SCC3 but it has greater tendency to relapse in the form of distant metastases than SCC4. After surgical resection, AC has higher rates in recurrence and mortality than SCC5 in Western countries, but in East Asia AC has better prognosis6. Unfortunately, the histological identification of tumour cells with a recognizable morphological pattern is partly subjective7, and can become particularly difficult for small-sized tumor in early stage8 or for patients that suffer from multiple types of primary lung carcinomas9. Even more importantly, the emergence of individualized therapeutic strategies for NSCLC based on defect-targeted drugs, such as Gefitinib10, requires the creation of molecular profiles to categorize tumours according to their underlying molecular characteristics rather than their histology or location. Targeted therapy in Asian non-smoking women has been shown more effective for AC than for SCC6, and personalized medicine is expected to develop more therapeutic strategies specific to these carcinomas11.
Over the last decade, high-throughput gene expression analysis has delivered on its promise to revolutionize our understanding of cancer12 through the identification of new tumour classes, the development of genomic prognostic models, and the discovery of new therapeutic targets. In more recent years, advances in systems biology have used the comprehensive transcriptional landscape offered by microarrays to go beyond the phenomenological signatures of cancer tissues and to identify the transcriptional networks that coordinate the expression of tumour genes 13–14. These transcriptional networks capture regulatory interactions between genes and explain the processes underpinning tumourigenesis15–16, rather than revealing signatures of a particular phenotype. But the two approaches are not antithetic as they may appear. Here we reconcile the two approaches by describing how transcriptional network can be used to discriminate between AC and SCC. Here we describe a systems biology approach to cancer classification based on the reverse engineering of the transcriptional network discriminating AC and SCC. Intuitively, we can regard these transcriptional network classifiers (TNC) as a gene network perturbed by the presence of the phenotype. The phenotype is treated as a binary perturbation of the overall transcriptional network so that, to reconstruct its TNC from expression profiles, we just need to infer the transcriptional network surrounding it.
To model this classifier, we use a multivariate analysis method known as Bayesian networks. Bayesian networks have been extensively used to analyze several types of genomic data, including gene regulation17–18, protein-protein interactions19–20, SNPs21, pedigrees22. The application of our network classifier to clinical data will show its superior performance in classifying lung AC and SCC.
MATERIALS and METHODS
Gene Expression Data
This research considered the gene expression data of primary lung tumors for analysis. The training data was comprised of 58 ACs and 53 SCCs (GEO: GSE3141). The independent validation data consisted of the following data: (i) 58 AC samples from Italy (GEO: GSE10072); (ii) 27 AC samples of Taiwanese origin (GEO: GSE7670); (iii) five American populations (GEO: GSE12667, GSE4824, GSE2109, GSE4573, GSE6253) in a total of 147 ACs (132 Caucasians, 9 African descent, 2 Asian descent, 4 other) and 190 SCCs (167 Caucasians, 3 African descent, 20 other). Except the Michigan data which had only preprocessed intensity levels available, other data had raw CEL files available. We adopted Affymetrix MAS 5.0 algorithm to process the CEL files. The raw expression intensities were scaled to 500 and log transformed. The data sets from Duke, WU, and expO were collected with Affymetrix HG-U133Plus2.0 platform, while the remaining data sets were collected with Affymetrix HG-U133A platform. We treated HG-U133A platform as the basis and used the batch query tool provided by Affymetrix to match the probe identifiers of HG-U133Plus2.0 platform to those of HG-U133A.
Transcriptional Network Construction
We modeled the TNC by the Bayesian networks framework23, which started with gene selection followed by gene network learning. The gene selection was realized by a statistical score, called Bayes factor, which evaluated for each gene the ratio of its likelihood of being dependent on the phenotype to its likelihood of being independent of the phenotype. When the Bayes factor was greater than one, the gene was selected because it is more likely to be dependent on the phenotype than to be independent of the phenotype. The step of gene network learning searched the most likely modulators of the genes, where each gene is modulated by another gene or the phenotype. Figure 1 depicts the resulting network representing the training data, where the rectangle node denotes the subtype variable, the elliptic nodes denote genes, and the directed arcs encode the conditional probabilities of the target nodes dependent on the source nodes.
Figure 1.

The Bayesian network model encoding the dependence relation among the subtype variable and genes is shown. For each gene, its likelihood of dependence on the subtype variable or another gene were evaluated, and then its parent node was determined by the highest likelihood. The subtype variable’s first tier child nodes, which are colored in green, are under its Markov blanket and assemble a signature to discriminate between adenocarcinoma (AC) and squamous cell carcinoma (SCC).
Subtype Recognition by the TNC
In terms of the transcriptional network shown in Figure 1, the signature genes are the first tier children nodes directly modulated by the subtype variable. Given a tumor sample’s expression levels of the signature genes, we can compute the probability of being AC or SCC by the network model and then assign to the sample the subtype with higher probability.
Statistical Differential Analysis
We used the Limma package24 in the R programming language and environment (www.r-project.org) to conduct the differential analysis.
Classification Accuracy
The discrimination accuracy of the model was determined by calculating the receiver operator characteristic (ROC) curves. The estimation of each ROC curve started with creating the convex hulls using the Qhull algorithm, followed by optimally smoothing the curve. We adopted the area under ROC curve (AUROC) as the measure of classification accuracy.
Cross Validation
To assess the robustness of the network to sampling variability, we used 10-fold cross validation in which the original training data was partitioned into 10 non-overlapping subsets that were used for learning the network dependency and re-estimating the model parameters. Each network was then used to classify the lung carcinoma subtypes of the individuals not included in the learning process.
Comparisons of Classification Performance with Other Methods
We further contrasted our classification results with three other popular methods: Principal Component Analysis with Linear Discriminant Analysis (PCA-LDA), Prediction Analysis for Microarray (PAM) which utilizes nearest shrunken centroid for tissue classification, and Weighted Voting (WV) which weighs the significance of genes by signal-to-noise ratios to classify samples. PCA-LDA carried out a smaller signature with 13 genes but produced only 91.2% accuracy. PAM resulted in 77 genes in the signature and generated 91.0% accuracy. These analyses show that the superiority of our method to PCA-LDA and PAM is statistically significant (p=0.0047 and 0.0014, respectively). The classification by WV reached 93.4%; although the difference between our TNC and WV is not statistically significant (p=0.6240), our TNC achieved higher accuracy with a much more compact signature than WV with a huge signature of 800 genes.
Comparative Genomic Hybridization (CGH)Data and Processing
The CGH data in our study was available from Gene Expression Omnibus with accession number GSE7878, which included 13 ACs and 15 SCCs. On chromosome 12, the CGH data contained 25, 207 and 18 genes occupying bands q12, q13 and q12-q13, whose average copy number changes were considered as three individual features of each tissue sample. Each feature is modelled by a Gaussian distribution. We built up a Naïve Bayes classifier by treating the features conditional only on the subtype variable and by learning from the data the parameters of the conditional probabilities. When classifying a sample, we evaluated its probability of being AC or SCC using Bayes theorem and then assigned to the sample the subtype with higher probability.
RESULTS
Lung Carcinomas Classification
Figure 1 shows the transcriptional network inferred from a set of 111 tumour samples (58 ACs and 53 SCCs) from Duke University25. Of the 22,283 gene probes in the microarray, 77 probes are dependent, directly or indirectly, on the carcinoma subtypes. Of these 77 genes, 25 are directly modulated by the cancer subtype and they are per se sufficient to identify it. Enrichment study shows that there are 23 unique genes in this signature, listed in Table 1. All the 25 genes are differentially expressed across AC and SCC with high statistical significance (p<10−5) and fold change over 2. Notably, 18 genes have fold change over 5. False discovery rates for the 25 genes are less than 10−5.
Table 1.
The signature of 25 genes in the network classification model. Enrichment shows that there are 23 unique genes in the signature.
| Gene symbol | Gene title | Cytoband | Pathway |
|---|---|---|---|
| ABCC3 | ATP-binding cassette, sub-family C (CFTR/MRP), member 3 | 17q22 | ABC transporters |
| BICD2 | bicaudal D homolog 2 (Drosophila) | 9q22.31 | |
| CDA | cytidine deaminase | 1p36.2-p35 | Pyrimidine metabolism, Drug metabolism |
| CLDN3 | claudin 3 | 7q11.23 | Cell adhesion molecules, Tight junction, Leukocyte transendothelial migration |
| DPP4 | dipeptidyl-peptidase 4 | 2q24.3 | |
| HGD | homogentisate 1,2-dioxygenase (homogentisate oxidase) | 3q13.33 | Tyrosine metabolism, Styrene degradation |
| ITPKA | inositol 1,4,5-trisphosphate 3- kinase A | 15q14-q21 | Inositol phosphate metabolism, Calcium signaling pathway, Phosphatidylinositol signaling system |
| KRT14 | keratin 14 (epidermolysis bullosa simplex, Dowling-Meara, Koebner) | 17q12-q21 | Cell communication |
| KRT6A, KRT6B, KRT6C | keratin 6A, keratin 6B, keratin 6C, | 12q12-q13 | Cell communication |
| MUC3B | mucin 3B, cell surface associated | 7q22 | |
| MUC5B | mucin 5B, oligomeric mucus/gel- forming | 11p15.5 | |
| NMNAT2 | nicotinamide nucleotide adenylyltransferase 2 | 1q25 | Nicotinate and nicotinamide metabolism |
| NTRK2 | neurotrophic tyrosine kinase, receptor, type 2 | 9q22.1 | MAPK signaling pathway |
| RHCG | Rh family, C glycoprotein | 15q25 | |
| SERPINB13 | serpin peptidase inhibitor, clade B (ovalbumin), member 13 | 18q21.3-q22 | |
| SOX2 | SRY (sex determining region Y)- box 2 | 3q26.3-q27 | |
| SPINK1 | serine peptidase inhibitor, Kazal type 1 | 5q32 | |
| SPRR1A | small proline-rich protein 1A | 1q21-q22 | |
| TJP3 | tight junction protein 3 (zona occludens 3) | 19p13.3 | Tight junction |
| TOX3 | TOX high mobility group box family member 3 | 16q12.1 | |
| VSNL1 | visinin-like 1 | 2p24.3 |
We tested the classification accuracy of the network on seven independent study populations, for a total of 422 samples, 232 AC and 190 SCC, from subjects of Caucasian, Asian and African descent representing 84.6%, 6.9%, and 2.8% of the data, respectively. On these independent samples, the TNC achieved an accuracy of 95.2%.
Uniqueness of the 25-Gene Signature
To confirm that the set of 25 signature genes cannot be exchanged with other downstream genes, we performed a stochastic analysis by randomly selecting 25 genes in the data to construct a TNC. After 10,000 random trials, the mean classification accuracy on the independent samples was 64.7% (sd 9.7). We further investigated if any single signature gene can on its own make good classification. None of the signature genes by itself can reach accuracy greater than 90.0% in both cross validation and the independent samples.
Discrimination by Chromosome 12q12-13
It is worth noting that KRT6A, KRT6B and KRT6C together represent a narrow cytoband on chromosome 12q12-q13. Surprisingly enough, these genes alone were able to achieve a classification accuracy of 90.2%, accounting for 95% of the accuracy of the entire signature. To understand the interplay of the expression levels of these three genes impacting AC-SCC discrimination, we assembled them in a signature and simulate their possible expression values using our network model. Figure 2 shows that the discriminative surface generated by these three genes is nonlinear and concave, and it accurately discriminates AC and SCC in all the eight populations considered in this study.
Figure 2.
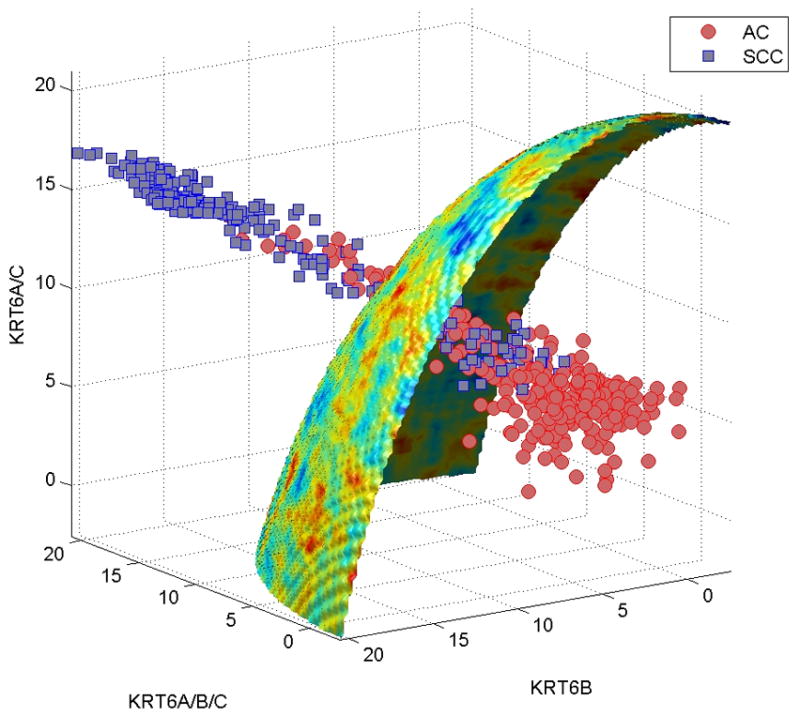
The adenocarcinoma (AC)-squamous cell carcinoma (SCC) discriminative surface in the use of KRT6A, KRT6B, and KRT6C as a signature is shown. The classification accuracy achieved by this signature was 90.2%, accounting for 95% of the accuracy of the entire 25-gene signature. Simulating the possible expression levels of the 3 genes generated a nonlinear discriminative surface, in which the region below it belonged to AC, and the region above belonged to SCC
To test the structural role of this region, we analyzed the copy number variations of another independent group of 25 subjects, assayed by CGH microarrays. We found copy number variations of bands 12q12, 12q13, and 12q12-13 define a nonlinear surface (Figure 3) that discriminates these new 28 samples with at 83.9% accuracy. These findings are consistent with the results of recent analysis of DNA copy number alterations in a large number of AC and SCC samples evaluated by CGH arrays, which showed that a gain of 12q13 appears more frequently in SCC than in AC26.
Figure 3.
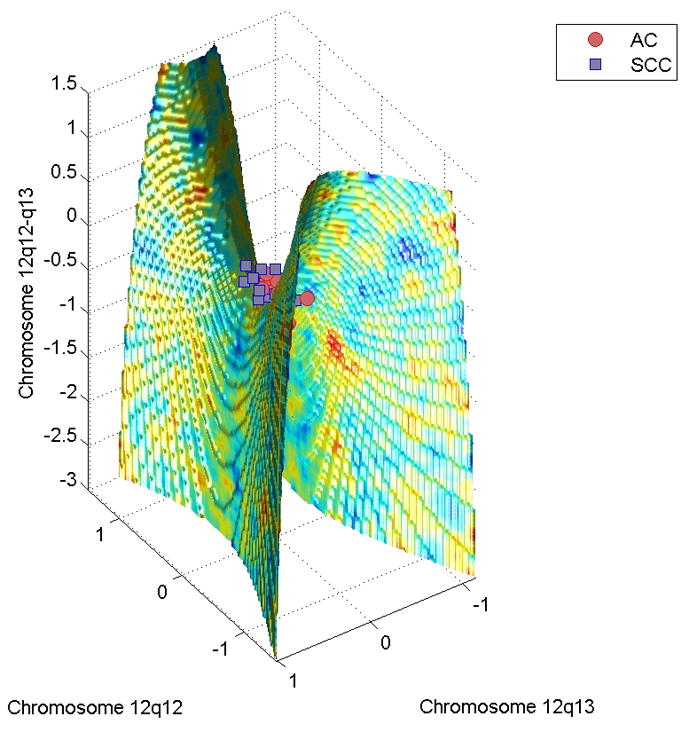
The adenocarcinoma (AC)-squamous cell carcinoma (SCC) discriminative surface generated by the comparative genomic hybridization data is shown. The discriminative surface is a saddle, in which the region below it belongs to AC, and the region above belongs to SCC. This surface can recognize the lung cancer samples with 83.9% accuracy.
DISCUSSION
The 25-gene signature identified by the TNC is unique to discriminate AC and SCC with high accuracy. Furthermore, most of these genes are consistent with what the literature has reported. In the signature, ABCC3, CLDN3, DPP4, MUC3B, MUC5B, NTRK2, SPINK1, TJP3 are specific markers of lung AC. The role of ABCC3 is to mediate the elimination of toxic compounds, for example carcinogens in tobacco smoke27, and a recent discovery revealed that ABCC3 is one of few genes up-regulated in early lung AC28. CLDN3 and TJP3 are involved in tight junction, and are found preferentially expressed in AC29. DPP4 functions as a tumor suppressor, and its down-regulation may result in the progression of cancer. Among all the lung cancer subtypes, only AC remains the same level of expression as normal tissue, so DPP4 is a good marker to recognize AC30. MUC3B and MUC5B are in the family of mucins that are important for tumor invasiveness and metastasis. An intestinal mucin, MUC3B is absent in normal lung but exhibits an increased mRNA level particularly in AC31. MUC5B is abundant naturally in lung and airway tissues, and its presence elevates in AC32. A tyrosine kinase gene, NTRK2 is a newly identified proto-oncogene due to its mutations in lung AC33. SPINK1 has been associated with prostate and pancreatic cancers, but it is found highly expressed in lung AC34.
KRT6A, KRT6B, KRT6C, KRT17, RHCG, SPRR1A, and VSNL1 are unique to squamous cells. KRT6A, KRT6B, KRT6C, and KRT17 are members in keratin proteins family and are related to epidermalization of squamous epithelium, so their expression surges in SCC35–36. RHCG is specific to squamous epithelia in many organs37, and our classifier utilizes its high expression in lung SCC to discriminate from AC. SPRR1A is frequently amplified in SCC and predominantly expressed in squamous epithelium where it contributes to the formation of the insoluble cornified crosslinked envelope that limits permeability and provides structural integrity35. VSNL1, also known as VILIP-1, acts as a tumor suppressor gene specific to SCC, with higher expression in early stage than in advanced stage; in contrast, its expression pattern in AC is mild38.
BICD2, CDA, NMNAT2, SERPINB13, and TOX3 have no specificity to either AC or SCC but to lung cancer. BICD2 is found involved in epidermal growth factor receptor (EGFR) signalling pathway 39. Since the percent of EGFR amplification in SCC is about twice in AC2, it is not surprisingly that our analysis utilizes the higher expression of BICD2 in SCC to distinguish from AC. CDA has been associated with alterations in enzymatic activity and may change sensitivity to the widely used chemotherapy drugs40. Since the NSCLC subtypes have different responses to chemotherapy, our study exploits the different expression levels of CDA to characterize AC and SCC. NMNAT2 is shown up-regulated in current smokers41, so it is correlated to both AC and SCC. SERPINB13 is found over-expressed in both AC and SCC42, but our study infers that its higher expression in SCC than in AC can distinguish these NSCLC subtypes. TOX3 has been shown a biomarker for breast cancer43, and a recent study suggests it a good prognostic marker for NSCLC44.
The remaining genes (HGD, ITPKA, SOX2) have not been reported their roles in lung carcinomas. HGD is involved in tyrosine metabolism, whose alteration is involved in lung carcinoma progression. ITPKA regulates inositol phosphate metabolism, and SOX2 is in the SOX family of transcription factors crucial for cell differentiation. These two genes have been reported their linkage with breast cancer45.
Lung tumor subtypes exhibit diversity in the molecular physiology46. Although molecular markers have been proposed their association with tumor subtypes, there is currently no widely accepted molecular-based tool to help identify the different histological subtypes. Two markers, thyroid transcription factor-1 (TTF1) and TP63, are regularly used by the surgical pathologist as an adjunct to morphological diagnosis. TTF1 stains tumors with adeno differentiation, while TP63 stains SCC47–49. However, TTF1 and TP63 together have a low sensitivity for a particular histological type as they are not necessarily specific to AC and SCC. TTF1 has been reported in a minority of SCC, and TP63 has been noted to be expressed in a minority of AC, resulting in these markers in combination often both staining a single tumor or not staining at all, and therefore failing to classify a large fraction of lung carcinomas50–52. Our analysis confirmed these reports: unlike the 25-gene signature whose expression levels differ between AC and SCC by 13-fold in average, TTF1 and TP63 differ by only 7-fold so they were excluded from the signature in the transcriptional network model. On the other hand, our 25-gene signature along with the computational model was evaluated by its sensitivity and specificity, achieving 95.2% classification accuracy. The high accuracy suggests that a new combination of multiple molecular markers is necessary to accurately discriminate lung tumor subtypes.
The actual subtypes of the NSCLC samples used in this research were identified by histology. The high AC-SCC discrimination accuracy resulting from our gene expression microarray analysis suggests that gene expression profiling is a powerful alternative to histology. When the morphological patterns of tumor cells are not recognizable, when small-sized tumors in early stage are difficult to be distinguished, or when patients present both primary AC and SCC, a microarray assay focused on the limited number of signature genes defined in the present study could be devised to objectively subclassify NSCLC samples.
An interested topic for future research is to interrogate the impact of races in the gene signature. In this paper, our data consisted of more than 90% of Caucasians. The small sample sizes of African descent and Asian descent made it infeasible to investigate how race plays a role in AC-SCC recognition. However, if additional African and Asian patients can be recruited, this analysis can be extended to identify race-specific signature genes.
In summary, this study shows the existence of a small functional network modulating the differences between the two most common types of lung cancer, confirmed by the high predictive accuracy of this network on a very large number of subjects. The ability of this small functional network to pinpoint a small region of chromosome 12 accounting for a large proportion of the differences between AC and SSC suggests the possibility of developing high-throughput screening methods to identify candidates for defect-targeted drugs. At the same time, the reliability of this network signature also suggests the potential of these network analyses to develop systemic molecular profiles for personalized therapeutic strategies.
Acknowledgments
Research support: This research is supported in part by NIH/NHGRI (R01HG003354)
Footnotes
Financial disclosures: All authors have no financial disclosures.
References
- 1.WHO. Fact Sheet N 207. Feb, 2009. Cancer. [Google Scholar]
- 2.Herbst RS, Heymach JV, Lippman SM. Lung cancer. N Engl J Med. 2008;359(13):1367–80. doi: 10.1056/NEJMra0802714. [DOI] [PMC free article] [PubMed] [Google Scholar]
- 3.Kato H, Ichinose Y, Ohta M, Hata E, Tsubota N, Tada H, et al. A randomized trial of adjuvant chemotherapy with uracil-tegafur for adenocarcinoma of the lung. N Engl J Med. 2004;350(17):1713–21. doi: 10.1056/NEJMoa032792. [DOI] [PubMed] [Google Scholar]
- 4.Yu CJ, Shih JY, Lee YC, Shun CT, Yuan A, Yang PC. Sialyl Lewis antigens: association with MUC5AC protein and correlation with post-operative recurrence of non-small cell lung cancer. Lung Cancer. 2005;47(1):59–67. doi: 10.1016/j.lungcan.2004.05.018. [DOI] [PubMed] [Google Scholar]
- 5.Nesbitt JC, Putnam JB, Jr, Walsh GL, Roth JA, Mountain CF. Survival in early-stage non-small cell lung cancer. Ann Thorac Surg. 1995;60(2):466–72. doi: 10.1016/0003-4975(95)00169-l. [DOI] [PubMed] [Google Scholar]
- 6.Giaccone G. Epidermal growth factor receptor inhibitors in the treatment of non-small-cell lung cancer. J Clin Oncol. 2005;23(14):3235–42. doi: 10.1200/JCO.2005.08.409. [DOI] [PubMed] [Google Scholar]
- 7.Jamieson LA, Carey FA. Pathology of lung tumours. SURGERY. 2005;23(11):389–93. [Google Scholar]
- 8.Wistuba, Gazdar AF. Lung cancer preneoplasia. Annu Rev Pathol. 2006;1:331–48. doi: 10.1146/annurev.pathol.1.110304.100103. [DOI] [PubMed] [Google Scholar]
- 9.Nonami Y, Ohtuki Y, Sasaguri S. Study of the diagnostic difference between the clinical diagnostic criteria and results of immunohistochemical staining of multiple primary lung cancers. J Cardiovasc Surg (Torino) 2003;44(5):661–5. [PubMed] [Google Scholar]
- 10.Sridhar SS, Seymour L, Shepherd FA. Inhibitors of epidermal-growth-factor receptors: a review of clinical research with a focus on non-small-cell lung cancer. Lancet Oncol. 2003;4(7):397–406. doi: 10.1016/s1470-2045(03)01137-9. [DOI] [PubMed] [Google Scholar]
- 11.Hirsch FR, Spreafico A, Novello S, Wood MD, Simms L, Papotti M. The prognostic and predictive role of histology in advanced non-small cell lung cancer: a literature review. J Thorac Oncol. 2008;3(12):1468–81. doi: 10.1097/JTO.0b013e318189f551. [DOI] [PubMed] [Google Scholar]
- 12.Lander ES. Array of hope. Nat Genet. 1999;21(1 Suppl):3–4. doi: 10.1038/4427. [DOI] [PubMed] [Google Scholar]
- 13.Huang E, Ishida S, Pittman J, Dressman H, Bild A, Kloos M, et al. Gene expression phenotypic models that predict the activity of oncogenic pathways. Nat Genet. 2003;34(2):226–30. doi: 10.1038/ng1167. [DOI] [PubMed] [Google Scholar]
- 14.Wu X, Jiang R, Zhang MQ, Li S. Network-based global inference of human disease genes. Mol Syst Biol. 2008;4:189. doi: 10.1038/msb.2008.27. [DOI] [PMC free article] [PubMed] [Google Scholar]
- 15.Segal E, Friedman N, Kaminski N, Regev A, Koller D. From signatures to models: understanding cancer using microarrays. Nat Genet. 2005;37 (Suppl):S38–45. doi: 10.1038/ng1561. [DOI] [PubMed] [Google Scholar]
- 16.Bossi A, Lehner B. Tissue specificity and the human protein interaction network. Mol Syst Biol. 2009;5:260. doi: 10.1038/msb.2009.17. [DOI] [PMC free article] [PubMed] [Google Scholar]
- 17.Friedman N. Inferring cellular networks using probabilistic graphical models. Science. 2004;303:799–805. doi: 10.1126/science.1094068. [DOI] [PubMed] [Google Scholar]
- 18.Huttenhower C, Haley EM, Hibbs MA, Dumeaux V, Barrett DR, Coller HA, et al. Exploring the human genome with functional maps. Genome Res. 2009;19(6):1093–106. doi: 10.1101/gr.082214.108. [DOI] [PMC free article] [PubMed] [Google Scholar]
- 19.Burger L, van Nimwegen E. Accurate prediction of protein-protein interactions from sequence alignments using a Bayesian method. Mol Syst Biol. 2008;4:165. doi: 10.1038/msb4100203. [DOI] [PMC free article] [PubMed] [Google Scholar]
- 20.Yu H, Zhu S, Zhou B, Xue H, Han JD. Inferring causal relationships among different histone modifications and gene expression. Genome Res. 2008;18(8):1314–24. doi: 10.1101/gr.073080.107. [DOI] [PMC free article] [PubMed] [Google Scholar]
- 21.Sebastiani P, Ramoni MF, Nolan V, Baldwin CT, Steinberg MH. Genetic dissection and prognostic modeling of overt stroke in sickle cell anemia. Nat Genet. 2005;37(4):435–40. doi: 10.1038/ng1533. [DOI] [PMC free article] [PubMed] [Google Scholar]
- 22.Lauritzen SL, Sheehan NA. Graphical models for genetic analysis. Statist Sci. 2004;18(4):489–514. [Google Scholar]
- 23.Chang HH, Ramoni MF. Transcriptional network classifiers. BMC Bioinformatics. 2009;10 (Suppl 9):S1. doi: 10.1186/1471-2105-10-S9-S1. [DOI] [PMC free article] [PubMed] [Google Scholar]
- 24.Smyth GK. Linear models and empirical bayes methods for assessing differential expression in microarray experiments. Stat Appl Genet Mol Biol. 2004;3 doi: 10.2202/1544-6115.1027. Article3. [DOI] [PubMed] [Google Scholar]
- 25.Bild A, Yao G, Chang J, Wang Q, Potti A, Chasse D, et al. Oncogenic pathway signatures in human cancers as a guide to targeted therapies. Nature. 2006;439(7074):353–7. doi: 10.1038/nature04296. [DOI] [PubMed] [Google Scholar]
- 26.Shen H, Gao W, Wu YJ, Qiu HR, Shu YQ. Multicolor fluorescence insitu hybridization and comparative genomic hybridization reveal molecular events in lung adenocarcinomas and squamous cell lung carcinomas. Biomed Pharmacother. 2008 doi: 10.1016/j.biopha.2008.08.010. [DOI] [PubMed] [Google Scholar]
- 27.Leslie EM, Ghibellini G, Nezasa K, Brouwer KL. Biotransformation and transport of the tobacco-specific carcinogen 4-(methylnitrosamino)-1-(3-pyridyl)-1-butanone (NNK) in bile duct-cannulated wild-type and Mrp2/Abcc2-deficient (TR ) Wistar rats. Carcinogenesis. 2007;28(12):2650–6. doi: 10.1093/carcin/bgm187. [DOI] [PubMed] [Google Scholar]
- 28.Hanada S, Maeshima A, Matsuno Y, Ohta T, Ohki M, Yoshida T, et al. Expression profile of early lung adenocarcinoma: identification of MRP3 as a molecular marker for early progression. J Pathol. 2008;216(1):75–82. doi: 10.1002/path.2383. [DOI] [PubMed] [Google Scholar]
- 29.Kuner R, Muley T, Meister M, Ruschhaupt M, Buness A, Xu EC, et al. Global gene expression analysis reveals specific patterns of cell junctions in non-small cell lung cancer subtypes. Lung Cancer. 2009;63(1):32–8. doi: 10.1016/j.lungcan.2008.03.033. [DOI] [PubMed] [Google Scholar]
- 30.Wesley UV, Tiwari S, Houghton AN. Role for dipeptidyl peptidase IV in tumor suppression of human non small cell lung carcinoma cells. Int J Cancer. 2004;109(6):855–66. doi: 10.1002/ijc.20091. [DOI] [PubMed] [Google Scholar]
- 31.Nguyen PL, Niehans GA, Cherwitz DL, Kim YS, Ho SB. Membrane-bound (MUC1) and secretory (MUC2, MUC3, and MUC4) mucin gene expression in human lung cancer. Tumour Biol. 1996;17(3):176–92. doi: 10.1159/000217980. [DOI] [PubMed] [Google Scholar]
- 32.Copin M, Buisine M, Leteurtre E, Marquette C, Porte H, Aubert J, et al. Mucinous bronchioloalveolar carcinomas display a specific pattern of mucin gene expression among primary lung adenocarcinomas. Hum Pathol. 2001;32(3):274–81. doi: 10.1053/hupa.2001.22752. [DOI] [PubMed] [Google Scholar]
- 33.Ding L, Getz G, Wheeler DA, Mardis ER, McLellan MD, Cibulskis K, et al. Somatic mutations affect key pathways in lung adenocarcinoma. Nature. 2008;455(7216):1069–75. doi: 10.1038/nature07423. [DOI] [PMC free article] [PubMed] [Google Scholar]
- 34.Borczuk A, Kim H, Yegen H, Friedman R, Powell C. Lung adenocarcinoma global profiling identifies type II transforming growth factor-beta receptor as a repressor of invasiveness. Am J Respir Crit Care Med. 2005;172(6):729–37. doi: 10.1164/rccm.200504-615OC. [DOI] [PMC free article] [PubMed] [Google Scholar]
- 35.Hawthorn L, Stein L, Panzarella J, Loewen G, Baumann H. Characterization of cell-type specific profiles in tissues and isolated cells from squamous cell carcinomas of the lung. Lung Cancer. 2006;53(2):129–42. doi: 10.1016/j.lungcan.2006.04.015. [DOI] [PubMed] [Google Scholar]
- 36.Fujii T, Dracheva T, Player A, Chacko S, Clifford R, Strausberg R, et al. A preliminary transcriptome map of non-small cell lung cancer. Cancer Res. 2002;62(12):3340–6. [PubMed] [Google Scholar]
- 37.Chen BS, Xu ZX, Xu X, Cai Y, Han YL, Wang J, et al. RhCG is downregulated in oesophageal squamous cell carcinomas, but expressed in multiple squamous epithelia. Eur J Cancer. 2002;38(14):1927–36. doi: 10.1016/s0959-8049(02)00190-9. [DOI] [PubMed] [Google Scholar]
- 38.Fu J, Fong K, Bellacosa A, Ross E, Apostolou S, Bassi DE, et al. VILIP-1 downregulation in non-small cell lung carcinomas: mechanisms and prediction of survival. PLoS ONE. 2008;3(2):e1698. doi: 10.1371/journal.pone.0001698. [DOI] [PMC free article] [PubMed] [Google Scholar]
- 39.Guha U, Chaerkady R, Marimuthu A, Patterson AS, Kashyap MK, Harsha HC, et al. Comparisons of tyrosine phosphorylated proteins in cells expressing lung cancer-specific alleles of EGFR and KRAS. Proc Natl Acad Sci U S A. 2008;105(37):14112–7. doi: 10.1073/pnas.0806158105. [DOI] [PMC free article] [PubMed] [Google Scholar]
- 40.Tibaldi C, Giovannetti E, Vasile E, Mey V, Laan AC, Nannizzi S, et al. Correlation of CDA, ERCC1, and XPD polymorphisms with response and survival in gemcitabine/cisplatin-treated advanced non-small cell lung cancer patients. Clin Cancer Res. 2008;14(6):1797–803. doi: 10.1158/1078-0432.CCR-07-1364. [DOI] [PubMed] [Google Scholar]
- 41.Chari R, Lonergan KM, Ng RT, MacAulay C, Lam WL, Lam S. Effect of active smoking on the human bronchial epithelium transcriptome. BMC Genomics. 2007;8:297. doi: 10.1186/1471-2164-8-297. [DOI] [PMC free article] [PubMed] [Google Scholar]
- 42.Heighway J, Knapp T, Boyce L, Brennand S, Field JK, Betticher DC, et al. Expression profiling of primary non-small cell lung cancer for target identification. Oncogene. 2002;21(50):7749–63. doi: 10.1038/sj.onc.1205979. [DOI] [PubMed] [Google Scholar]
- 43.Easton DF, Pooley KA, Dunning AM, Pharoah PD, Thompson D, Ballinger DG, et al. Genome-wide association study identifies novel breast cancer susceptibility loci. Nature. 2007;447(7148):1087–93. doi: 10.1038/nature05887. [DOI] [PMC free article] [PubMed] [Google Scholar]
- 44.Hu Z, Chen J, Tian T, Zhou X, Gu H, Xu L, et al. Genetic variants of miRNA sequences and non-small cell lung cancer survival. J Clin Invest. 2008;118(7):2600–8. doi: 10.1172/JCI34934. [DOI] [PMC free article] [PubMed] [Google Scholar]
- 45.Leo JC, Wang SM, Guo CH, Aw SE, Zhao Y, Li JM, et al. Gene regulation profile reveals consistent anticancer properties of progesterone in hormone-independent breast cancer cells transfected with progesterone receptor. Int J Cancer. 2005;117(4):561–8. doi: 10.1002/ijc.21186. [DOI] [PubMed] [Google Scholar]
- 46.Garber ME, Troyanskaya OG, Schluens K, Petersen S, Thaesler Z, Pacyna-Gengelbach M, et al. Diversity of gene expression in adenocarcinoma of the lung. Proc Natl Acad Sci U S A. 2001;98(24):13784–9. doi: 10.1073/pnas.241500798. [DOI] [PMC free article] [PubMed] [Google Scholar]
- 47.Kargi A, Gurel D, Tuna B. The diagnostic value of TTF-1, CK 5/6, and p63 immunostaining in classification of lung carcinomas. Appl Immunohistochem Mol Morphol. 2007;15(4):415–20. doi: 10.1097/PAI.0b013e31802fab75. [DOI] [PubMed] [Google Scholar]
- 48.Wu M, Szporn AH, Zhang D, Wasserman P, Gan L, Miller L, et al. Cytology applications of p63 and TTF-1 immunostaining in differential diagnosis of lung cancers. Diagn Cytopathol. 2005;33(4):223–7. doi: 10.1002/dc.20337. [DOI] [PubMed] [Google Scholar]
- 49.Wu M, Wang B, Gil J, Sabo E, Miller L, Gan L, et al. p63 and TTF-1 immunostaining. A useful marker panel for distinguishing small cell carcinoma of lung from poorly differentiated squamous cell carcinoma of lung. Am J Clin Pathol. 2003;119(5):696–702. doi: 10.1309/P5AB-R5KQ-89RN-JTFH. [DOI] [PubMed] [Google Scholar]
- 50.Ring BZ, Seitz RS, Beck RA, Shasteen WJ, Soltermann A, Arbogast S, et al. A novel five-antibody immunohistochemical test for subclassification of lung carcinoma. Mod Pathol. 2009;22(8):1032–43. doi: 10.1038/modpathol.2009.60. [DOI] [PubMed] [Google Scholar]
- 51.Pelosi G, Fraggetta F, Pasini F, Maisonneuve P, Sonzogni A, Iannucci A, et al. Immunoreactivity for thyroid transcription factor-1 in stage I non-small cell carcinomas of the lung. Am J Surg Pathol. 2001;25(3):363–72. doi: 10.1097/00000478-200103000-00011. [DOI] [PubMed] [Google Scholar]
- 52.Au NH, Gown AM, Cheang M, Huntsman D, Yorida E, Elliott WM, et al. P63 expression in lung carcinoma: a tissue microarray study of 408 cases. Appl Immunohistochem Mol Morphol. 2004;12(3):240–7. doi: 10.1097/00129039-200409000-00010. [DOI] [PubMed] [Google Scholar]
- 53.Myong NH. Thyroid transcription factor-1 (TTF-1) expression in human lung carcinomas: its prognostic implication and relationship with wxpressions of p53 and Ki-67 proteins. J Korean Med Sci. 2003;18(4):494–500. doi: 10.3346/jkms.2003.18.4.494. [DOI] [PMC free article] [PubMed] [Google Scholar]