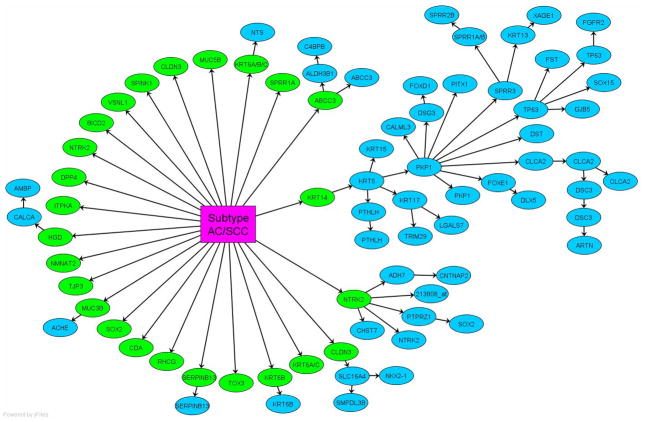
Figure 1.
The Bayesian network model encoding the dependence relation among the subtype variable and genes is shown. For each gene, its likelihood of dependence on the subtype variable or another gene were evaluated, and then its parent node was determined by the highest likelihood. The subtype variable’s first tier child nodes, which are colored in green, are under its Markov blanket and assemble a signature to discriminate between adenocarcinoma (AC) and squamous cell carcinoma (SCC).

