

Abstract
4-Hydroxynonenal (HNE) is produced from arachidonic acid or linoleic acid during oxidative stress. Although HNE is formed in tissues as a racemate, enantiospecific HNE effects have not been widely documented, nor considered. Therefore, a panel of cellular responses was compared after treatment with (R)-HNE, (S)-HNE, or racemic HNE. The phosphorylation status of Jun kinase (JNK) or Akt increased 28-fold or 2-3-fold, respectively, after treatment with 100 μM (S)-HNE and racemic HNE compared to (R)-HNE. In contrast, the increase in phosphorylation of MAPK was greatest for (R)-HNE. caspase-3-dependent cleavage of glutamate cysteine ligase (GCL) catalytic subunit and focal adhesion kinase (FAK) were greater in cells treated with (S)-HNE at 48 hrs. (S)-HNE also caused a greater number of subG1 nuclei, a hallmark of apoptosis, at 30 hours after treatment. Together, the results demonstrate different dose- and time-dependent responses to (R)-HNE and (S)-HNE. The results further suggest that HNE enantiomers could differentially contribute to the progression of different diseases or contribute by different mechanisms.
Introduction
Oxidative stress-induced lipid peroxidation leads to formation of 4-hydroxynonenal (HNE1). At high concentrations HNE reacts covalently with nucleophilic sites on proteins with subsequent dysregulation of numerous homeostatic pathways, which can alter cellular control of the balance between proliferation and apoptosis. At low concentrations, HNE is a ‘second messenger’ that contributes to homeostatic regulation of these or related pathways through covalent or reversible interactions. The details of these effects depend on cell type and status, so it has been difficult to elucidate specific biochemical events that result from HNE exposure, which lead to dysregulation. Such effects of HNE are likely, in some cases, to contribute causally to several diseases that include an oxidative stress component such as atherosclerosis, Alzheimer’s and Parkinsons diseases, asthma, and aging (1-3). HNE formed in vivo is a racemic mixture of enantiomers distinguished by their configuration at the hydroxyl-bearing carbon, C-4. However, the potential for stereoselective HNE effects in cells has been considered in only a few studies. Although stereoselective HNE effects have been largely ignored, a few studies suggest their importance. Differential interactions of HNE enantiomers with isolated proteins or cultured cells have been demonstrated in vitro, including in a colorectal carcinoma cell line, where modest enantiospecific effects of HNE on caspase activation were observed (4) Also, (S)-HNE inhibits glyceraldehyde 3-phosphate dehydrogenase more potently than (R)-HNE in vitro (5), and Wakita and co-workers recently demonstrated that different cysteine side chains in human thioredoxin are differentially adducted by (R)-HNE vs. (S)-HNE (6). By extension, it is reasonable to hypothesize that (R)-HNE and (S)-HNE would have different biological effects. However, such effects have not been well documented.
In addition, Ramana and co-workers have demonstrated that a major metabolite of HNE, the glutathione conjugate (GS-HNE), modulates signal transduction pathways and acts as a homeostatic regulatory component of cell proliferation (7). The glutathione conjugate, which undergoes non-enzymatic, but rapid, cyclization, contains three chiral centers. Presumably, the resulting eight diastereomers have different effects on regulatory pathways, given that they have significantly different solution conformations (8). The chirality of the HNE that affords the GS-HNEs may be a critical feature of their individual biological properties, but this has not been explored.
In light of the previous results that suggest stereoselective effects of HNE, and the near certainty that the diastereomeric GS-HNEs would exhibit stereoselective interactions with proteins, we hypothesize that (R)-HNE and (S)-HNE differentially affect cellular pathways that mediate their effects on proliferation and apoptosis. Clearly, comparison of the effects of (R)-HNE vs. (S)-HNE is not intended to model HNE biology or to mimic the combined effects of the enantiomers that are formed naturally. Rather, differentiation of enantiospecific effects could provide mechanistic insight if they could be correlated with specific disease states. The strategy of our initial studies was to screen several markers of apoptosis, proliferation, and cell status upon exposure to the individual HNE enantiomers, which might reveal pathway-dependent stereoselective effects. Here we demonstrate that (R)-HNE and (S)-HNE differentially alter cell cycle regulation and caspase-dependent activity in cultured mouse hepatocytes in a time-dependent manner. These results confirm that the HNE enantiomers, or diastereomers of their metabolites, differentially interact with cellular components. These differences could be used to probe the contributions of specific pathways to diseases that have an oxidative stress component.
Experimental Procedures
Separation of (R)-HNE and (S)-HNE
Racemic HNE (purchased from Cayman Chemicals, Ann Arbor, MI) was dried at room temperature and reconstituted in a mixture of 98:2 n-hexane:isopropanol. The enantiomers were separated by normal phase-HPLC on a chiral column (Chiralcel OB; 250 × 4.6 mm, 10 micron particle size; Chiral Technologies, West Chester, PA) eluted with an isocratic mobile phase of n-hexane/isopropanol 98.7/1.3 (v/v) at a flow rate of 1 ml/min (8). The (S)- and (R)-HNE enantiomers eluting at 19 and 22 minutes, respectively, were collected, evaporated in a dark fume hood, and reconstituted in absolute ethyl alcohol (USP grade). The fractions were checked for purity by re-injection and concentrations were determined from the absorption at 224 nm using ε = 13750 M−1 cm−1 for HNE in water. Stock solutions were stored in ethanol at −80°C.
Cell Culture
Hepa-1c1c7 murine hepatoma cells (Hepa-1) were grown in DMEM/F12 (Invitrogen, Carlsbad, CA) medium supplemented with 10% Nu-serum (Hyclone) and 1% Penicillin-Streptomycin (Invitrogen) at 37°C in a humidified, 5% CO2/95% air environment. All treatments were performed in serum-free DMEM/F12 and at 80% confluency. Medium and any detached cells were collected from each sample following treatment, and any remaining attached cells were trypsinized and combined with their respective medium fractions in order to harvest all cells for downstream analysis.
Colony Formation Assay
Approximately 100 cells were plated per 35mm cell culture dish and allowed to attach for 4 hours under standard incubation conditions. Medium was removed and replaced with serum-free DMEM/F12 containing the appropriate concentration of HNE. A series of 100X HNE stocks were prepared, in EtOH, such that each dish received 10 μl/ml of the respective HNE concentration. Cells were treated with 0.1, 0.5, 1.0, 2.5, 5.0 and 10 μM racemic, (R)- or (S)-HNE. Controls were no treatment or EtOH carrier alone. Following a seven-day incubation period, the medium was removed and dishes gently washed with 1X PBS, and colonies were stained and fixed for 1 minute with 1% Crystal Violet dissolved in 20% methanol/80% PBS (Sigma/Aldrich, St. Louis, MO). Dishes were then rinsed with H2O and air-dried. Dishes were digitally photographed and collected images were subsequently stacked, a uniform threshold applied and an average densitometry measurement calculated using NIH Image-J software. Data were collected from a minimum of three independent experiments performed in triplicate.
Phospho-protein and total protein level measurements using a 3-Plex Panel
A triplicate series of six-well plates were prepared and cells grown to 80% confluency. Medium was removed and replaced with fresh, serum-free DMEM/F12 containing 100 μM of racemic, (R)- or (S)-HNE and incubated for an additional 1, 6, 12, 18 and 24 hours. Untreated controls were prepared for each time-point. Following treatment, cells were harvested as above, centrifuged and pellets resuspended in NP-40 lysis buffer (BioSource) supplemented with protease inhibitors (Complete, mini, Roche Applied Science, Indianapolis, IN) and phosphatase inhibitors (Sigma/Aldrich) and stored at −80°C for further analysis. The levels of phosphorylated Akt, JNK1/2 and p38MAPK were measured simultaneously using the Akt, JNK1/2, p38MAPK Phospho 3-Plex Panel kit (Invitrogen) according to the manufacturer’s instructions. Briefly, samples were pre-treated with a 2-fold dilution of the manufacturer’s sample treatment buffer and an 8-fold dilution of assay diluent. Then, 100 μL of each standard from a series of 2-fold dilutions and treated samples were incubated with target capturing beads in a 96-well plate for two hours, followed by a one hour incubation with specific biotinylated detection antibodies. Next, Goat Anti-Rabbit IgG-RPE was added to each well and incubated for 30 minutes. Filtration and washing were incorporated after each incubation step with wash buffer using a vacuum manifold. The sample plates were incubated at room temperature with shaking. Samples were re-suspended in wash buffer prior to reading using the Luminex 100™ (Austin, TX) suspension array reader. Each sample was analyzed in duplicate. Total protein levels of Akt, JNK1/2 and p38MAPK were measured simultaneously with the same procedure described above using antibodies supplied in the kit. Results are representative of two independent experiments performed in triplicate.
Immunoblots
Cells, both attached and detached, were harvested after treatment and resuspended in 500 μl of lysis buffer (20 mM HEPES (pH 7.4), 1% Triton X-100 and 0.2 mM EDTA) supplemented with protease inhibitors, sonicated briefly and centrifuged at 10,000xg to clear the lysates. Protein concentrations were determined using protein assay reagents from BioRad (Hercules, CA). Equal concentrations of protein lysates were resolved on 12.5% SDS-PAGE Ready gels (BioRad), transferred to Immobilon PVDF membranes (Millipore, Billerica, MA) and blocked overnight in PBST with 5% non-fat dry milk, BSA or FBS according to manufacturer’s recommendations. Blots were washed with PBST and incubated overnight at 4°C with appropriate primary antibodies at 1:1000 dilutions in PBST. Primary antibodies used in these studies were against glutamate cysteine ligase catalytic (GCLC) or glutamyl-modifier (GCLM) subunits (9), caspase-3 and focal adhesion kinase (FAK; BD Biosciences, San Jose, CA). Membranes were washed extensively with PBST and incubated with a 1:10,000 dilution of the corresponding horseradish peroxidase-conjugated secondary antibodies and complexes detected using enhanced chemiluminescence (ECL) reagents (Amersham/GE Healthcare Biosciences, Pittsburgh, PA). Densitometry measurements were calculated using NIH Image-J software.
Flow Cytometry and Cell Cycle Analysis
Cells undergoing apoptosis can be identified by measuring their hypodiploid DNA content. Those cells which fall below the DNA content of those in G1 phase of the cell cycle (sub-G1) are a result of DNA fragmentation and are assumed apoptotic (10). In order to determine the percentage of cells in the sub-G1 phase following HNE treatment, both attached and detached cells were harvested, centrifuged and resuspended in 500 μl of 1X PBS. Cells were fixed by the drop-wise addition, with gentle vortexing, of 5 mls ice-cold 70% EtOH/30%PBS solution. The cells were incubated at 4°C for a minimum of 1 hour, centrifuged and washed twice with PBS. Cells were resuspended in PBS supplemented with 50 μg/ml propidium iodide (PI, Molecular Probes/Invitrogen), 200 μg/ml RNase A (Sigma/Aldrich) and 0.1% NP-40 (Sigma/Aldrich) and the samples stored at 4°C, in the dark, until analyzed by flow cytometry. Cell cycle analysis using PI-stained nuclei was carried out as previously described (11). Nuclei were analyzed using a FACScan flow cytometer (Becton Dickinson) equipped with a 488 nm argon-ion laser. Forward and side scatter (FSC and SSC, respectively) measurements were gated to eliminate debris. PI fluorescence was measured in the FL-2 channel in linear mode using a 585/42 nm filter, and gated to remove doublets. A minimum of 10,000 events were acquired for each sample, and cell cycle analysis was conducted using FlowJo (Tree Star Inc.). Quantification of apoptotic nuclei within each sample was carried out by measuring the sub-G1 peak that was present below the G0/G1 peak in the FL-2 channel. All time points were repeated over at least three independent experiments, performed in triplicate.
NAD(P)H cellular redox status
Mammalian cells contain a variety of endogenous fluorescent molecules including aromatic amino acids, flavins and the reduced pyridine nucleotides NADH and NADPH. While NAD(P)H molecules are fluorescent, their oxidized forms NAD+ and NAD+P are non fluorescent. As such, the level of NAD(P)H autofluorescence serves as a monitor of cellular pyridine nucleotide redox status. Exitation of NAD(P)H at ~360 nm gives rise to a blue fluorescent emission signal with a peak at 450 nm. NAD(P)H autofluorescence intensities were measured on a Beckman/Coulter EPICS Elite flow cytometer using a 355 nm (UV) excitation wavelength and the resulting blue emission signals were collected using a 450 ± 35 nm band pass filter.
Cell Vitality
Cell vitality was measured using the LIVE/DEAD Vitality Assay Kit (Molecular Probes/Invitrogen). In this two-color assay, metabolically active cells convert reduced, non-fluorescent C12-reazurin to red-fluorescent C12-resorufin, while injured or dead cells exhibit an increased uptake of the cell-impermeant, green fluorescent nucleic acid stain SYTOX-Green. Cell vitality dye intensities were measured on a Beckman/Coulter EPICS Elite flow cytometer using a 488 nm excitation wavelength and the resulting green and red emission signals were collected at 530 and 575 nm, respectively. Cell populations were separated on bivariate plots and gated accordingly.
Statistical analysis
All data were analyzed by one-way ANOVA with Tukey’s multiple comparison post-test, conducted using Prism (GraphPad Software).
Results
Differential Effects of Racemic, (R)- and (S)-HNE on Cell Growth and Proliferation
It is well established that HNE can affect a diverse array of cellular processes in a time and concentration dependent manner (1, 12-17). At low concentrations, HNE has been shown to influence cell proliferation, differentiation and signal transduction, while at higher concentrations it induces apoptosis. In an attempt to ascertain whether the (R)- and (S)-HNE act differentially on cell growth, we performed a series of colony formation assays. Hepa-1 cells were exposed to either (R)-HNE, (S)-HNE or a racemic mix of HNE in the concentration range of 0.1 – 10 μM and the mean densities of Crystal Violet staining patterns were compared to an untreated control (Figure 1). As seen in Panel A, (R)-HNE exhibited a near 3-fold decrease in mean density (26.1% ± 5.3) compared to (S)-HNE (65.3 ± 6.9%) at 0.5 μM treatment. Although less dramatic, (R)-HNE also exhibited a greater reduction in mean density than (S)-HNE at the 0.1 and 1.0 μM concentrations. All treatments with (R)-, (S)- and racemic HNE above 1.0 μM showed similar cytotoxicity. Panel B verifies that a 1:1 mixture reconstituted from isolated enantiomers generated similar results when compared to a commercial racemic mixture.
Fig. 1.

Differential effects of racemic, (R)- and (S)-HNE on colony formation. Following a 4 hour attachment period, cells were treated with 0.1, 0.5, 1.0, 2.5, 5.0 and 10.0 μM of racemic, (R)- or (S)-HNE in serum-free media Complete protocol is described in “Experimental Procedures”. Controls were no treatment (closed triangles) and EtOH carrier alone (No effect, data not shown). Data have been separated into two graphs for clarity. Panel A. (R)-HNE (closed circles) generated a 3-fold decrease in colony formation in comparison to (S)-HNE (open circles) at 0.5 μM (R = 26.1 ±5.3 and S = 65.3 ± 6.9.). Panel B. Colony formation results were comparable in cells treated with either a commercial stock of HNE (open squares) or a 1:1 mixture of purified isomers (closed squares). Mean densities were calculated from Crystal Violet staining results and are expressed relative to untreated control. Results are representative of three independent experiments performed in triplicate.
Enantiomeric Differences in Protein Phosphorylation Levels via 3-Plex Panel
HNE has been shown to modulate proteins involved in cell signaling and signal transduction pathways, affecting cell proliferation and apoptosis in a time and concentration dependent manner (12-17). Therefore, we assayed the time dependent effect of 100 μM racemic, (R)-HNE and (S)-HNE on the phosphorylation status of Akt, JNK and MAPK over a 24 hour time period. The maximal level of phosphorylation for all three proteins was observed 6 hours post treatment (Figure 2). Interestingly, the R and S enantiomers displayed significantly different phosphorylation patterns at this time point. Most dramatically, (S)-HNE showed a > 30-fold increase in phosphorylation of JNK (51.5 ± 18.5) relative to (R)-HNE (1.1 ± 0.1). It should be noted that treatment with racemic HNE resulted in phosphorylation of JNK to levels similar to (S)-HNE at 6 hours (55.0 ± 3.0). In contrast, (R)-HNE showed a 2-3-fold increase (31.0 ± 4.5) over (S)- or racemic HNE (14.5 ± 1.1 and 17.1 ± 1.0 respectively) in MAPK phosphorylation at 6 hours. The phosphorylation of Akt was 2-3-fold higher in (S)-HNE treated cells (36.6 ± 1.6) when compared to (R)-HNE (20.6 ± 1.8) or racemic HNE (25.7 ± 5.7) treatment. Control cells shown in Figure 2 represent the phosphorylation status of untreated cells at 6 hours.
Fig 2.

Phosphorylation status of Akt, JNK and MAPK in (R)-, (S)- and racemic HNE treated hepatocytes. Racemic HNE (open squares), (R)-HNE (closed circles), (S)-HNE (open circles) and untreated control (closed triangles). Panel A. Akt was phosphorylated approximately 2-fold higher in the presence of (S)- and racemic HNE in comparison to (R)-HNE treated cells at 6 hours. Panel B. JNK phosphorylation was increased nearly 30-fold in the presence of (S)- and racemic HNE in comparison to (R)-HNE treatment, which showed minimal phosphorylation after 6 hours. Panel C. In contrast to these Akt and JNK results, MAPK phosphorylation was increased 2-fold by (R)-HNE in comparison to (S)- and racemic HNE treatment for 6 hours. RFU, relative fluorescent units. Results are representative of two independent experiments performed in triplicate.
Immunoblot Analysis
The Bioplex assay results discussed above identified HNE enantiomer-dependent differences in the phosphorylation status of proteins involved in pro-survival and pro-apoptotic pathways. To further confirm these results we used Western analysis of proteins associated with these pathways and known to regulate cellular morphology or oxidative stress responses. This was prompted by our observation that the extent of cell rounding and detachment from culture plates was markedly different for treatment with (R)-HNE vs. (S)-HNE. Proteins analyzed via Western blot included GCLC and GCLM subunits, which are involved in GSH synthesis and ultimately GS-HNE conjugation and clearance. GCLC has previously been shown to be cleaved by caspase- 3 (18) and can serve as a marker for apoptosis. In addition we monitored FAK, which is involved in cell adhesion and cytoskeleton structure, and which is also cleaved by caspase-3 (19, 20). Western data presented in Figure 3 indicate a series of correlated events that are enantiomer-specific. The level of GCLC cleavage is approximately 2-fold higher in (S)-HNE treated cells (72.0 ± 5.0) when compared to racemic (44.5 ± 1.5) or (R)-HNE treatment (46.0 ± 1.0). Interestingly, there is a concomitant, 2-fold increase in caspase-3 activation observed in cells treated with (S)-HNE (50.5 ± 2.5) when compared to those treated with racemic (26.0 ± 1.0) or (R)-HNE (27.5 ± 1.5). In addition, GCLM expression is reduced significantly following exposure to (S)-HNE (52.0 ± 1.0) in comparison to (R)-HNE (72.5 ± 4.5). Cells treated with (S)-HNE also produced a subtle, though significant, increase in lower molecular weight cleavage products (109 ± 3.0) than cells exposed to either (R)- (97.2 ± 2.0) or racemic HNE (87.2 ± 2.0).
Fig. 3.

Immunoblot analysis reveals differential effects on several proteins related to apoptosis 48 hours after treatment with 100 μM racemic, (R)- or (S)-HNE. TNFα/ActD was used as a control. Immunoblots were performed as described in “Experimental Procedures”. Bar graphs represent mean densities of corresponding immunoblots. Arrows indicate cleavage product or protein level analyzed. Panel A. TNFα/ActD caused near total cleavage of GCLC 48 hours after treatment. (S)-HNE generated significantly more cleavage of GCLC in relation to untreated control, racemic and (R)-HNE. Panel B. TNFα/ActD caused the greatest reduction in GCLM protein levels 48 hours post treatment. Racemic or (S)-HNE generated similar reductions in GCLM levels, both of which were significantly lower than the level following treatment with (R)-HNE. Panel C. TNFα/ActD caused near total cleavage of pro-caspase to its active form. (S)-HNE generated significantly more activation of caspase-3 after 48 hours in relation to racemic and (R)-HNE treatments. Panel D. (S)-HNE generated a significantly greater amount of low molecular weight FAK cleavage product in relation to control, racemic and (R)-HNE… Results are representative of three independent experiments. Densitometry results were calculated using Image J and statistical analysis was performed using Prism. * p < 0.01
Analysis of Redox Status and Cell Vitality
HNE is a potent electrophile that has been shown to affect cellular redox status. The reduced pyridine nucleotides NADH and NADPH (collectively referred to as NAD(P)H) are two of a variety of endogenous fluorescent molecules found in mammalian cells. NADH and NADPH lose their fluorescence upon oxidation to NAD and NADP+, thereby serving as effective monitors of the pyridine nucleotide redox status of the cell. The level of NAD(P)H autofluorescence was measured by flow cytometry 24 hours post treatment with 100 μM racemic, (R)- or (S)-HNE and compared to untreated cells and those exposed to 7 ng/ml tumor necrosis factor alpha and 0.25 ng/ml actinomycin D (TNFα/ActD). The results of these experiments (Figure 4), reveal that cells treated with (S)-HNE (17.38 ± 4.3) showed a 2-fold reduction in NAD(P)H levels in comparison to either HNE (38.8 ± 3.9) or (R)-HNE (33.5 ± 3.9). These data correlate well with the cell vitality assay results shown in Figure 5. Measuring the level of cell death by the uptake of cell impermeant SYTOX Green, the greatest cellular damage occurred in cells treated with (S)-HNE (61.6 ± 8.4) when compared with either (R)-HNE (36.6 ± 4.7) or racemic HNE (26.9 ± 1.4).
Fig. 4.
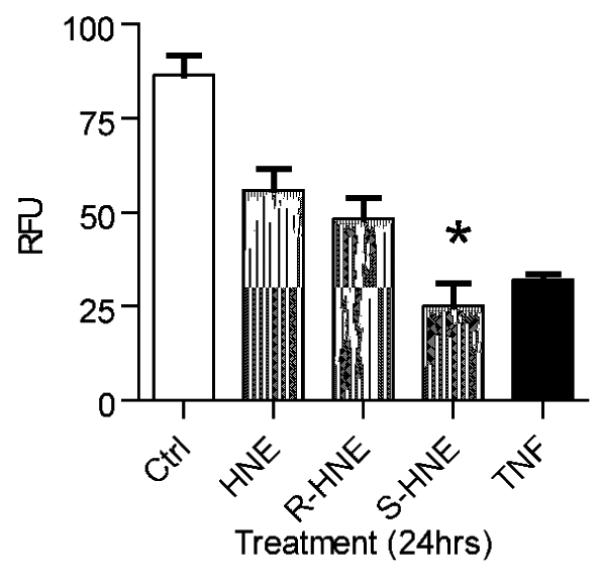
(S)-HNE enantiomer significantly affects the redox status in cultured hepatocytes. Flow cytometric analysis of cellular pyridine nucleotide redox status was performed as described in “Experimental Procedures”. NAD(P)H levels, used as an indicator of intracellular redox status, were 2-fold lower in (S)-HNE treated cells 24 hours after exposure, relative to racemic and (R)-HNE. Results are representative of three independent experiments. Statistical analysis was performed using Prism. * p < 0.01
Fig. 5.

Effects on cell vitality 24 hours after treatment with racemic, (R)- or (S)-HNE. Assay and flow cytometric parameters were as described in “Experimental Procedures”. Cells populations, 24 hours after treatment, were gated as live (white bars), dead (black bars) or injured (gray bars) based on their fluorescent properties. Cells treated with (S)-HNE generated a nearly 2-fold increase in cell death when compared to either (R)- or racemic HNE. Results are representative of three independent experiments. Statistical analysis was performed using Prism.
Analysis of Apoptotic Nuclei by Flow Cytometry
The appearance of a sub-G1 peak, in which the cell nuclei have a lower DNA content than in G0/G1 cells, is indicative of cell death by apoptosis (11) (Figure 6). The proportion of nuclei exhibiting a sub-G1 peak was measured over a time course of 18-48 hours following treatments with 100 μM (R)-, (S)-, or racemic HNE, and compared to untreated cells, or those exposed to TNFα/ActD, a known inducer of apoptosis (21). Interestingly, as shown in Figure 6, all four treatments had a distinct effect upon the cells. TNFα/ActD treatment produced the earliest and most severe response, with 40.4 ± 4.9% sub-G1 nuclei 18 hours following treatment, rising to 94.2 ± 1.9% sub-G1 nuclei at 48 hours. Cells treated with the (S)-HNE enantiomer showed a rapid increase in the number of apoptotic cells, rising from 9.6 ± 1.8% at 18 hours post-treatment to 62.8 ± 1.6% at 30 hours before reaching a plateau wherein the proportion of sub-G1 nuclei at 36 and 48 hours was 65.5 ± 1.6% and 76.3 ± 2.2%, respectively. In contrast, treatment with the (R)-HNE diastereomer produced a more modest induction of apoptosis, with the proportion of sub-G1 nuclei in this group rising from 15.6 ± 1.2% at 18 hours post-treatment to 52.2 ± 4.1% at 36 hours. Interestingly, cells exposed to racemic HNE were found to have fewer sub-G1 nuclei compared to those treated with an equivalent concentration of either enantiomer. The proportion of sub-G1 cells in this group rose slowly from 10.1 ± 2.0% at 24 hours to 50.3 ± 3.5% after 48 hours. The proportion of sub-G1 cells in the untreated control population remained relatively unchanged at 7-13%.
Fig. 6.

Sub-G1 analysis of cells treated with HNE. Panel A. Nuclei isolated from cells 18-48 hours following treatment with 100 μM (R)-HNE (closed, blue circles), 100 μM (S)-HNE (open, green circles), 100 μM racemic HNE (open, red squares), TNFα/ActD (closed, orange squares), and an untreated control (black triangles) population were stained for DNA content using propidium iodide and analyzed by flow cytometry. Cells undergoing apoptosis can be quantified by measuring the percentage of nuclei with a DNA content that is less than G0/G1 cells (sub-G1 nuclei). All points are the mean ± S.E.M. from at least three independent experiments..Panel B. Histograms used for flow cytometric cell cycle analysis of PI-stained nuclei. DNA content within isolated nuclei from untreated cells after 48 hours was determined by measuring PI fluorescence, enabling the identification of G0/G1 cells (green peak), S-phase cells (brown peak), and G2/M cells (teal peak). Cells undergoing apoptosis, or sub-G1 cells, are identified as those having nuclear DNA content that is less than G0/G1 cells, as indicated by the black arrow. Inset: Nuclei isolated from cells 48 hours after treatment with 100 μM racemic HNE. Note the increase in sub-G1 nuclei.
Discussion
Although HNE is a well established component of oxidative stress, its chirality has not been adequately appreciated in the context of the multiple cellular effects that it elicits. For example there are numerous reports of HNE adduct formation with proteins in vitro, using racemic HNE (1, 12, 22, 23), and collectively these studies demonstrate the chemical competence of nearly any protein to form covalent adducts with HNE when they are co-incubated at sufficiently high concentrations. However, few studies have directly considered the potential of differential stereoselectivity of different nucleophilic sites on a single protein or on different proteins for the enantiomeric HNEs. A notable exception is the recent work of Wakita et al. (6) in which it was demonstrated that different Cys residues of thioredoxin have different stereochemical preferences for (R)-HNE vs. (S)-HNE. These results emphasize the potential for different chemical reactivity, and hence different biological effects, of the two HNE enantiomers in cells. In particular, specific molecular interactions between the individual enantiomers of HNE and intracellular targets need to be identified. Therefore, we examined several pathways and biomarkers in hepatocytes that are typically associated with oxidative stress or apoptosis. We tested the hypothesis that (R)-HNE and (S)-HNE differentially modulate individual pathways or cellular responses. The identification of such differences could, in turn, lead to mechanistic hypotheses concerning the importance of specific cellular responses in HNE-dependent disease progression.
In our present study, we have identified several biological processes in which (R)- and (S)-HNE enantiomers display distinct and differential effects. At low concentrations, (0.5 μM) (R)-HNE exhibited a 3-fold decrease in colony formation when compared to (S)-HNE. We also observed enantiospecific alterations in cell detachment patterns and morphology via microscopy, although further study is needed to identify the molecular basis of these differences. (R)-HNE was observed to disrupt the cytoskeleton to a greater extent, which is likely correlated to its ability to increase p38MAPK phosphorylation. Reports by Deschesnes et al. (24) have identified the involvement of p38MAPK in caspase-independent cell blebbing and work by Houle et al. and Usatyuk et al. have shown p38 to be involved in actin organization (25-27). The observed differences in gross cell morphology and surface attachment for (R)-HNE vs. (S)-HNE are likely related to this pathway. Enantiospecific effects of HNE were also identified in the phosphorylation status of three signal transduction pathway biomarkers, Akt, JNK and p38MAPK. (S)-HNE showed a greater increase in phosphorylation of JNK and Akt, in comparison to (R)-HNE, which caused a 2-3-fold increase in MAPK phosphorylation over that of (S)-HNE. These results demonstrate the complexity of the signal transduction pathways involved and suggest the differences in cellular responses are caused by these HNE enantiomers. Although the effects of (S)-HNE observed here are enigmatic, causing increased phosphorylation of both Akt and JNK, recent reports have documented both pro- and anti-apoptotic roles for all three of these signaling proteins based on cellular context. In addition, Song et al. (28) have shown HNE to activate JNK, but not p38, in PC12 cells, which is also consistent with our results. It has also been reported by Liu et al. (29) that Akt can be down-regulated via a caspase-dependent pathway triggered by 4-HNE. Indeed, our Western immunoblot results identified an (S)-HNE dependent activation of caspase-3, as verified by cleavage of GCLC and FAK, which could be responsible for diminishing Akt’s pro-survival properties. The activation of caspase-3 was preceded by a 2-fold reduction in NAD(P)H levels and cell vitality generated by (S)-HNE treatment. Biswas et al. recently reported that a reduced cellular redox state induced HNE-mediated caspase-3 activation (30). Finally, (S)-HNE generated a greater proportion of sub-G1 nuclei beyond 24 hours of treatment. Clearly, the effects of HNE on these pathways, is dose- and time-dependent and they vary with cell type and differentiation status. Thus, while further studies are required to establish a detailed mechanism of effects caused by each HNE enantiomer, the results emphasize that they are likely to be different.
There are two possible mechanistic contributions to our observations, distinct from differential HNE target selectivity. The first is differential metabolism of (S)-HNE vs. (R)-HNE. Clearance of HNE is mediated via glutathione S-transferases and aldehyde reductases (5, 31, 32). In principle, if the cellular effects we monitored were due solely and directly to HNE and not an HNE metabolite, and if one enantiomer were metabolized more efficiently than the other, then treatment with the non-metabolized HNE enantiomer could result in apparently greater toxicity. The racemate would be expected to yield effects similar to one of the enantiomers, potentially with lower efficacy, depending on the dose response relationship for that effect. This scenario is unlikely, in as much as a major route of elimination of HNE, via GST-mediated conjugation exhibits remarkably low substrate stereoselectivity (8). The stereoselectivity of other enzymatic clearance pathways has not been determined. Alternatively, as suggested by Ramana et al. (7) the GSH conjugate of HNE is likely responsible for many of its effects in cell proliferation and apoptosis. It is more likely that the stereoselectivity of HNE would manifest itself here, in as much as the diastereomeric GS-HNEs resulting from reaction with GSH are structurally very different, each having three chiral centers and dramatically different overall molecular topology. Because of the very large structural differences, it would not be surprising if the GS-HNE diastereomers had different selectivity for non-covalent interactions or covalent adduction with cell targets. We explicitly studied this possibility by synthesizing the GSH adduct from racemic HNE. For these studies the diethyl ester of GSH was used, because it exhibits increased intracellular uptake compared to GSH. We found that the GS-HNE diethyl ester had modestly lower efficacy than racemic HNE in cell vitality studies (Supplemental Information). Therefore, it is unlikely that the enantiospecific effects of HNE that we observe are due solely to the downstream diastereomeric GS-HNE’s, although it would be interesting to look at the their effects in more detail in future studies.
It is interesting and informative that, in essentially all of the pathways probed here, the racemic HNE, at 50 μM (R)-HNE and 50 μM (S)-HNE, does not yield effects that are ‘half’ of those observed with the individual enantiomers at 100 μM. This is not surprising given that each enantiomer has distinct effects. Given the complex interactions between different cellular pathways, which do not behave independently and which share complex regulatory signals, it would not be expected that enantiospecific effects on these pathways would be simply additive when both enantiomers are present.
In conclusion, here we specifically addressed the hypothesis that the two different enantiomers of HNE have different biological effects relative to the well-established toxicity of racemic HNE. As noted above, these studies are not intended to model the in vivo effects of the racemic, or nearly racemic, mixture formed naturally from lipid peroxidation (33, 34). Although these experiments do not specifically reveal details of HNE-dependent disease progression, they raise interesting possibilities for the entire realm of ‘HNE biology.’ For example, an interesting implication of our results, is that (R)-HNE and (S)-HNE could have causal roles in the progression of different disease states
Supplementary Material
Ackowledgments
This work was supported by NIHGM 62284 (WMA). The authors acknowledge Ms. Jasmine Wilkerson for expert assistance with the Bioplex assays.
Footnotes
- HNE
- 4-hydroxynonenal
- GS-HNE
- the glutathione conjugate of HNE
- Akt
- serine-threonine specific protein kinase
- JNK
- cJun N-terminal Kinase
- MAPK
- mitogen-activated protein kinase
- FAK
- focal adhesion kinase
REFERENCES
- (1).Poli G, Schaur RJ, Siems WG, Leonarduzzi G. 4-hydroxynonenal: a membrane lipid oxidation product of medicinal interest. Med Res Rev. 2008;28:569–631. doi: 10.1002/med.20117. [DOI] [PubMed] [Google Scholar]
- (2).LoPachin RM, Gavin T, Petersen DR, Barber DS. Molecular mechanisms of 4-hydroxy-2-nonenal and acrolein toxicity: nucleophilic targets and adduct formation. Chem Res Toxicol. 2009;22:1499–1508. doi: 10.1021/tx900147g. [DOI] [PMC free article] [PubMed] [Google Scholar]
- (3).Uchida K. 4-Hydroxy-2-nonenal: a product and mediator of oxidative stress. Prog Lipid Res. 2003;42:318–343. doi: 10.1016/s0163-7827(03)00014-6. [DOI] [PubMed] [Google Scholar]
- (4).West JD, Ji C, Duncan ST, Amarnath V, Schneider C, Rizzo CJ, Brash AR, Marnett LJ. Induction of apoptosis in colorectal carcinoma cells treated with 4-hydroxy-2-nonenal and structurally related aldehydic products of lipid peroxidation. Chem Res Toxicol. 2004;17:453–462. doi: 10.1021/tx034248o. [DOI] [PubMed] [Google Scholar]
- (5).Hiratsuka A, Tobita K, Saito H, Sakamoto Y, Nakano H, Ogura K, Nishiyama T, Watabe T. (S)-preferential detoxification of 4-hydroxy-2(E)-nonenal enantiomers by hepatic glutathione S-transferase isoforms in guinea-pigs and rats. Biochem J. 2001;355:237–244. doi: 10.1042/0264-6021:3550237. [DOI] [PMC free article] [PubMed] [Google Scholar]
- (6).Wakita C, Maeshima T, Yamazaki A, Shibata T, Ito S, Akagawa M, Ojika M, Yodoi J, Uchida K. Stereochemical configuration of 4-hydroxy-2-nonenal-cysteine adducts and their stereoselective formation in a redox-regulated protein. J Biol Chem. 2009;284:28810–28822. doi: 10.1074/jbc.M109.019927. [DOI] [PMC free article] [PubMed] [Google Scholar]
- (7).Ramana KV, Bhatnagar A, Srivastava S, Yadav UC, Awasthi S, Awasthi YC, Srivastava SK. Mitogenic responses of vascular smooth muscle cells to lipid peroxidation-derived aldehyde 4-hydroxy-trans-2-nonenal (HNE): role of aldose reductase-catalyzed reduction of the HNE-glutathione conjugates in regulating cell growth. J Biol Chem. 2006;281:17652–17660. doi: 10.1074/jbc.M600270200. [DOI] [PubMed] [Google Scholar]
- (8).Balogh LM, Roberts AG, Shireman LM, Greene RJ, Atkins WM. The stereochemical course of 4-hydroxy-2-nonenal metabolism by glutathione S-transferases. J Biol Chem. 2008;283:16702–16710. doi: 10.1074/jbc.M801725200. [DOI] [PMC free article] [PubMed] [Google Scholar]
- (9).Thompson SA, White CC, Krejsa CM, Diaz D, Woods JS, Eaton DL, Kavanagh TJ. Induction of glutamate-cysteine ligase (gamma-glutamylcysteine synthetase) in the brains of adult female mice subchronically exposed to methylmercury. Toxicol Lett. 1999;110:1–9. doi: 10.1016/s0378-4274(99)00133-2. [DOI] [PubMed] [Google Scholar]
- (10).Darzynkiewicz Z, Bedner E. Analysis of apoptotic cells by flow and laser scanning cytometry. Methods Enzymol. 2000;322:18–39. doi: 10.1016/s0076-6879(00)22005-3. [DOI] [PubMed] [Google Scholar]
- (11).Ormerod MG, Collins MK, Rodriguez-Tarduchy G, Robertson D. Apoptosis in interleukin-3-dependent haemopoietic cells. Quantification by two flow cytometric methods. J Immunol Methods. 1992;153:57–65. doi: 10.1016/0022-1759(92)90305-d. [DOI] [PubMed] [Google Scholar]
- (12).Petersen DR, Doorn JA. Reactions of 4-hydroxynonenal with proteins and cellular targets. Free Radic Biol Med. 2004;37:937–945. doi: 10.1016/j.freeradbiomed.2004.06.012. [DOI] [PubMed] [Google Scholar]
- (13).Yang Y, Sharma R, Sharma A, Awasthi S, Awasthi YC. Lipid peroxidation and cell cycle signaling: 4-hydroxynonenal, a key molecule in stress mediated signaling. Acta Biochim Pol. 2003;50:319–336. [PubMed] [Google Scholar]
- (14).Uchida K, Shiraishi M, Naito Y, Torii Y, Nakamura Y, Osawa T. Activation of stress signaling pathways by the end product of lipid peroxidation. 4-hydroxy-2-nonenal is a potential inducer of intracellular peroxide production. J Biol Chem. 1999;274:2234–2242. doi: 10.1074/jbc.274.4.2234. [DOI] [PubMed] [Google Scholar]
- (15).Parola M, Bellomo G, Robino G, Barrera G, Dianzani MU. 4-Hydroxynonenal as a biological signal: molecular basis and pathophysiological implications. Antioxid Redox Signal. 1999;1:255–284. doi: 10.1089/ars.1999.1.3-255. [DOI] [PubMed] [Google Scholar]
- (16).Poli G, Leonarduzzi G, Biasi F, Chiarpotto E. Oxidative stress and cell signalling. Curr Med Chem. 2004;11:1163–1182. doi: 10.2174/0929867043365323. [DOI] [PubMed] [Google Scholar]
- (17).Nakashima I, Liu W, Akhand AA, Takeda K, Kawamoto Y, Kato M, Suzuki H. 4-hydroxynonenal triggers multistep signal transduction cascades for suppression of cellular functions. Mol Aspects Med. 2003;24:231–238. doi: 10.1016/s0098-2997(03)00018-9. [DOI] [PubMed] [Google Scholar]
- (18).Franklin CC, Krejsa CM, Pierce RH, White CC, Fausto N, Kavanagh TJ. Caspase-3-Dependent Cleavage of the Glutamate-L-Cysteine Ligase Catalytic Subunit during Apoptotic Cell Death. Am J Pathol. 2002;160:1887–1894. doi: 10.1016/S0002-9440(10)61135-2. [DOI] [PMC free article] [PubMed] [Google Scholar]
- (19).Wen LP, Fahrni JA, Troie S, Guan JL, Orth K, Rosen GD. Cleavage of focal adhesion kinase by caspases during apoptosis. J Biol Chem. 1997;272:26056–26061. doi: 10.1074/jbc.272.41.26056. [DOI] [PubMed] [Google Scholar]
- (20).Gervais FG, Thornberry NA, Ruffolo SC, Nicholson DW, Roy S. Caspases cleave focal adhesion kinase during apoptosis to generate a FRNK-like polypeptide. J Biol Chem. 1998;273:17102–17108. doi: 10.1074/jbc.273.27.17102. [DOI] [PubMed] [Google Scholar]
- (21).Darzynkiewicz Z, Carter SP, Old LJ. Effect of recombinant tumor necrosis factor on HL-60 cells: cell-cycle specificity and synergism with actinomycin D. J Cell Physiol. 1987;130:328–335. doi: 10.1002/jcp.1041300304. [DOI] [PubMed] [Google Scholar]
- (22).Chavez J, Chung WG, Miranda CL, Singhal M, Stevens JF, Maier CS. Site-specific protein adducts of 4-hydroxy-2(E)-nonenal in human THP-1 monocytic cells: protein carbonylation is diminished by ascorbic acid. Chem Res Toxicol. 2010;23:37–47. doi: 10.1021/tx9002462. [DOI] [PMC free article] [PubMed] [Google Scholar]
- (23).Poli G, Biasi F, Leonarduzzi G. 4-Hydroxynonenal-protein adducts: A reliable biomarker of lipid oxidation in liver diseases. Mol Aspects Med. 2008;29:67–71. doi: 10.1016/j.mam.2007.09.016. [DOI] [PubMed] [Google Scholar]
- (24).Deschesnes RG, Huot J, Valerie K, Landry J. Involvement of p38 in apoptosis-associated membrane blebbing and nuclear condensation. Mol Biol Cell. 2001;12:1569–1582. doi: 10.1091/mbc.12.6.1569. [DOI] [PMC free article] [PubMed] [Google Scholar]
- (25).Houle F, Rousseau S, Morrice N, Luc M, Mongrain S, Turner CE, Tanaka S, Moreau P, Huot J. Extracellular signal-regulated kinase mediates phosphorylation of tropomyosin-1 to promote cytoskeleton remodeling in response to oxidative stress: impact on membrane blebbing. Mol Biol Cell. 2003;14:1418–1432. doi: 10.1091/mbc.E02-04-0235. [DOI] [PMC free article] [PubMed] [Google Scholar]
- (26).Usatyuk PV, Natarajan V. Role of mitogen-activated protein kinases in 4-hydroxy-2-nonenal-induced actin remodeling and barrier function in endothelial cells. J Biol Chem. 2004;279:11789–11797. doi: 10.1074/jbc.M311184200. [DOI] [PubMed] [Google Scholar]
- (27).Usatyuk PV, Parinandi NL, Natarajan V. Redox regulation of 4-hydroxy-2-nonenal-mediated endothelial barrier dysfunction by focal adhesion, adherens, and tight junction proteins. J Biol Chem. 2006;281:35554–35566. doi: 10.1074/jbc.M607305200. [DOI] [PubMed] [Google Scholar]
- (28).Song BJ, Soh Y, Bae M, Pie J, Wan J, Jeong K. Apoptosis of PC12 cells by 4-hydroxy-2-nonenal is mediated through selective activation of the c-Jun N-terminal protein kinase pathway. Chem Biol Interact. 2001;130-132:943–954. doi: 10.1016/s0009-2797(00)00247-7. [DOI] [PubMed] [Google Scholar]
- (29).Liu W, Akhand AA, Takeda K, Kawamoto Y, Itoigawa M, Kato M, Suzuki H, Ishikawa N, Nakashima I. Protein phosphatase 2A-linked and -unlinked caspase-dependent pathways for downregulation of Akt kinase triggered by 4-hydroxynonenal. Cell Death Differ. 2003;10:772–781. doi: 10.1038/sj.cdd.4401238. [DOI] [PubMed] [Google Scholar]
- (30).Biswas D, Sen G, Biswas T. Reduced cellular redox status induces 4-hydroxynonenal-mediated caspase 3 activation leading to erythrocyte death during chronic arsenic exposure in rats. Toxicol Appl Pharmacol. 2010;244:315–327. doi: 10.1016/j.taap.2010.01.009. [DOI] [PubMed] [Google Scholar]
- (31).Honzatko A, Brichac J, Murphy TC, Reberg A, Kubatova A, Smoliakova IP, Picklo MJ., Sr. Enantioselective metabolism of trans-4-hydroxy-2-nonenal by brain mitochondria. Free Radic Biol Med. 2005;39:913–924. doi: 10.1016/j.freeradbiomed.2005.05.010. [DOI] [PubMed] [Google Scholar]
- (32).Gueraud F, Crouzet F, Alary J, Rao D, Debrauwer L, Laurent F, Cravedi JP. Enantioselective metabolism of (R)- and (S)-4-hydroxy-2-nonenal in rat. Biofactors. 2005;24:97–104. doi: 10.1002/biof.5520240111. [DOI] [PubMed] [Google Scholar]
- 33).Völkel W, Sicilia T, Pähler A, Gsell W, Tatschner T, Jellinger K, Leblhuber F, Riederer P, Lutz WK, Götz ME. Increased brain levels of 4-hydroxy-2-nonenal glutathione conjugates in severe Alzheimer’s disease. Neurochem Int. 2006;48:679–686. doi: 10.1016/j.neuint.2005.12.003. [DOI] [PubMed] [Google Scholar]
- (34).Singhal J, Singhal SS, Yadav S, Suzuki S, Warnke MM, Yacoub A, Dent P, Bae S, Sharma R, Awasthi YC, Armstrong DW, Awasthi S. RLIP76 in Defense of Radiation Poisoning. Int J Radiat Oncol Biol Phys. 2008;72:553–661. doi: 10.1016/j.ijrobp.2008.06.1497. [DOI] [PMC free article] [PubMed] [Google Scholar]
Associated Data
This section collects any data citations, data availability statements, or supplementary materials included in this article.