

Abstract
A growing body of evidence suggests that the drug concentration in the effect compartment of the body is the major factor regulating self-administration behavior. A novel computer-based protocol was developed to facilitate studies on mechanisms of drug addiction by determining correlations between drug levels and behavior during multiple drug injections and infusions. The core of the system is a user’s program written in Medstate Notation language® (Med-Associates, Inc.), which runs the self-administration session (with MED-PC® software and hardware, Med-Associates, Inc.) and calculates the levels of infused and/or injected drugs in real time during the session. From the comparison of classical exponential and simple linear models of first-order kinetics, it is concluded that exponential solutions for the appropriate differential equations may be replaced with linear equations if the cycle of computation is much shorter than the shortest half-life for the drug. The choice between particular computation equations depends on assumptions about the pharmacokinetics of the particular drug: (i) one-, two- or three-compartment model, (ii) zero-, first- or second-order process of elimination, (iii) the constants of distribution and elimination half-lives of the drug are known or can be reasonably assumed, (iv) dependence of the constants on the drug level, and (v) temporal stability of all parameters during the session. This method of drug level computation can be employed not only for self-administration but also for other behavioral paradigms to advance pharmacokinetic/pharmacodynamic modeling.
Keywords: Biofeedback, Self-administration, Addiction, Mathematical model, Pharmacokinetics, Pharmacodynamics
1. Type of research
Drug abuse: This method was developed to monitor and record relative changes in total amount of drugs in the body of rats and mice in the course of the self-administration sessions.
Pharmacokinetics (PK): The method computes the levels of drugs in the whole body or in different compartments after oral or parenteral administration in animals or humans.
Pharmacodynamics (PD): The method can be used for studying the relationship of the magnitude of drug effects and drug levels after single or multiple drug injections during self-administration, drug discrimination, taste aversion, and other behavioral, physiological, or psychological tests involving feedback in both humans and laboratory animals.
PK/PD modeling: The study of temporal correlations and causal relationships between drug levels in different compartments (PK) and behavioral/physiological effects (PD).
2. Time required
Implantation of intravenous catheters under general anesthesia, 30–60 min.
Training animals to maintain self-administration of drugs of abuse, 1–3 h session, 5 days a week, 1–4 weeks, or as long as the catheter remains patent.
Data collection during one session, up to 24 h (typically 1–3 h a day), for as many sessions as the catheter remains patent (typically 1–12 months).
3. Materials
3.1. Animals
Sprague–Dawley male rats, initial weight 180–200 g and 350–450 g over the duration of the studies (Harlan, IN), and Swiss Webster male mice (19–21 g and 29–35 g, respectively, Charles River Laboratories, MA) were housed individually on 12-h light–dark cycle and food and water available ad libitum. All studies were conducted in accordance with the Guide for Care and Use of Laboratory Animals. Although rats and mice were used herein, any kind of laboratory animals for which the surgical procedure of implantation of intravenous catheters has been developed can be used.
3.2. Drugs
(−)-Cocaine hydrochloride was provided by the National Institute on Drug Abuse. Cocaine was dissolved in saline at a concentration suitable for intravenous (i.v.) administration. The method may be applied to any drug of abuse where the constants of distribution and elimination are known or can be reasonably assumed. It can be also used for experiments involving single or multiple intragastric, intramuscular, intraperitoneal, or subcutaneous injections by means of suitable pharmacokinetic models (Fig. 1).
Fig. 1.
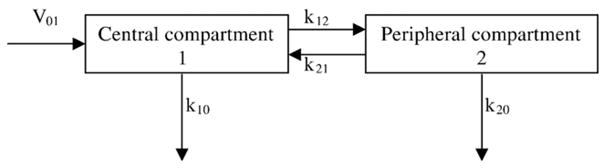
Pharmacokinetic model with two compartments. Drug is administered into the central compartment at the rate V01, distributed to the peripheral compartment and redistributed back with rate constants k12 and k21, respectively, and eliminated from those compartments with rate constants k10 and k20, respectively.
3.3. Hardware
3.3.1. Experimental chamber
Experiments in rats were conducted in standard experimental chambers made of acrylic and metal with stainless steel rod floor (ENV-007, Med-Associates, Inc., St. Albans, VT). The chambers were placed inside of soundproof PVC cubicles (56 × 56 × 36 cm, ENV-018). Each modular chamber was equipped with two levers (ENV-110M), one signal light (ENV-221M), and one house light (ENV-215M) to control day/night cycle. For experiments in mice, similar equipment from Coulbourn Instruments, Allentown, PA, was used (catalog ## H10-11M-TC-IS, H21-03M, H11-01M).
3.3.2. Syringe pump and swivel
To inject or infuse the drug solutions, PHM-100 syringe pumps (Med-Associates) with appropriate rate of injection or infusion were used. Glass Micro-Mate interchangeable syringes (Popper and Sons, Inc., New Hyde Park, NY) or, for even better accuracy for self-administration in mice, Hamilton syringes of Gastight Series 1700 or Series 1000 (Hamilton, Reno, NV) of 0.01–50 ml volume were used for injection or infusion of the drug solutions. Precision swivel systems, single channel 375/22 or dual channel 375/D/22 swivels for rats and single channel 375/25P plastic swivels for mice (Instech Laboratories, Inc., Plymouth Meeting, PA), were used to allow the animals to move freely in the experimental chamber and have an unlimited access to the drug.
3.3.3. Computer and interface
A connection panel (SG-215 or SG-716, Med-Associates) was connected through the universal cable (SG-210) to the modules of the experimental chambers and pumps with an interface module (DIG-715 or DIG 716). Twelve of these interface modules were installed in a double rack mount enclosure (SG-6501) equipped with a 10 A power supply (SG-503) and an interface chassis (SG-6200). Interface ribbon cable (DIG-700C) connected a decoder card (DIG-700D) to the interface card (DIG-704C) installed in an IBM compatible personal computer (PC). Thus, each PC controlled six experimental chambers using a package of software running with MED-PC® version 2 for Windows (SCF-700A).
3.4. Software
3.4.1. The runtime program
The program controlling the self-administration session and the program for calibration procedure have been written in Medstate Notation Language (MSN, Med-Associates) and translated into a runtime programs cocaine.mpc and calibr.mpc using WMPC package (TRANS20, Med-Associates) and Turbo Pascal compiler (Borland International, Scotts Valley, CA). The minimum recommended computer system to run the program is as follows:
486 DX 200 MHz IBM-PC compatible computer with ISA or PCI bus;
16 Mb RAM;
Hard drive;
31/2″ floppy or I-Omega floppy disc drive;
SVGA graphic display (800 × 600 or better resolution);
Logitech or similar mouse;
Windows 3.11 or higher (with screen saver and power saver disabled).
The program cocaine.mpc permits:
The control of up to twelve experimental chambers simultaneously from one PC;
The running of self-administration sessions of any duration (theoretically unlimited);
The changing of all independent variables used in the program during the experiment and even the changing of the experimental design from the keyboard;
The control of the activation of two syringe pumps (delivering self-administered drug and a test compound, for example) with a time resolution of 0.01 s and, therefore, the control of the volume of delivered solutions with a precision better than ±0.02 μl;
The option to control presentation of food pellets and liquid drops;
The control of the presentation of environmental cues (signal light and/or sound) with a time resolution of 0.01 s;
The control of the day/night cycle (by switching the house light on and off) during long sessions;
The calculation of the amount of the drug in the body at any time during the session;
The recording of the type of all events (responses, presentations of signals, and drug administrations), the time and the drug level when these events occur with resolutions of 0.1 s and 0.01 μg·kg−1 (0.01 nmol kg−1), respectively;
The running of any combination of fixed/progressive/random schedule with ratio/interval/duration/dose schedule during different phases of self-administration session: priming, maintenance, or extinction;
The changing of the schedule during the experiment automatically or manually;
The presentation of calculated levels and other parameters on a monitor in real time;
The saving of all the collected data to ASCII file and/or print the most important data (summary) at any time during the session and automatically at the end of the session.
3.4.2. Data analysis
Saved data were stored in a database developed in our laboratory on a Microsoft Access platform (Microsoft, Seattle, WA) and analyzed using SigmaPlot graphics/statistics software package (Systat Software, Inc., Point Richmond, CA). For the first step in the data analysis, the original ASCII data were imported using MPC2XL (Med-Associates) into SigmaPlot in order to visualize the entire self-administration session. Using templates and transforming subprograms written within SigmaPlot, data were plotted to show (1) cumulative record of lever presses and cocaine administrations and (2) calculated cocaine levels at the time when each cocaine injection starts during the self-administration phase and at the time of each lever press during the extinction phase of the session. These two plots were printed on the reverse side of a hardcopy of the printed summary of the session from the MPC files. The printed summaries and graphs were stored for future comparative or long-term studies.
4. Detailed procedures
4.1. Surgical procedures
All surgical procedures were conducted with sterilized instruments, using sterile materials, in a room equipped with a fume hood. Detailed description of the surgical implantation of indwelling intravenous catheters can be found in the literature, for example, for rats [2,6], for mice [1,7,8], for monkeys [17,18,21], and for pigeons [14]. Briefly, animals were anesthetized with halothane. The fur was shaved and the skin cleaned with 70% alcohol and iodine solution. The jugular vein was separated from the surrounding tissues. The silicone tubing of the catheter was tunneled under the skin and inserted into the vein. Three ligatures were imposed and gently tied on the vein and catheter (on, below, and above the site of entrance). The wound was closed and treated with an antibiotic ointment. Antibiotic was injected once a day through the implanted i.v. catheter for 3 days starting 1 h after the surgery. The catheter was flushed with heparin solution (2–30 Units ml−1) twice a day for the first 5 days.
4.2. Animal training
After a 7 day post surgical recovery period, animals were trained to maintain lever-pressing when injected with cocaine solution. Rats and mice were weighed and the catheters flushed with 0.2–0.3 ml (0.05–0.1 ml for mice) of heparin solution (10 Units ml−1) to ensure that there is good easy flow through the catheter. Tygon® tubing from the syringe was connected to the catheter outlet through the swivel. Each animal was placed into an individual experimental chamber for 2 h a day. Every press on the active lever (Fixed Ratio [FR] = 1 schedule) resulted in the activation of the syringe pump delivering cocaine solution (40 μmol ml−1 in sterile saline). The standard unit dose for training was 1500 nmol kg−1 of cocaine. The presses on the active lever when pump was already activated and all the presses on the inactive lever were recorded but had no consequences. A signal light representing the time-out period accompanied pump activation. The duration of pumping (T) was calculated by the program according to the Eq. (1):
| (1) |
where: D = cocaine unit dose (nmol kg−1), W = body weight (kg), C = standard concentration of cocaine solution (nmol ml−1), F = flow rate (ml s−1).
At the end of every self-administration session, rats and mice were taken out of the experimental chambers. The catheter was flushed again with heparin solution (10 Units ml−1) to replace the rest of the cocaine solution and protected with a cap. The paper on the bottom of the tray was discarded, the tray and the walls of the chamber were wiped with a weak bleach solution, and a new piece of paper was placed in the tray.
4.3. Drug levels computation
For the simple case of drug elimination from a single compartment, the current drug level (Lc) can be calculated according to the first-order kinetic Eq. (2):
| (2) |
where: Lp = amount of the drug in the body (nmol kg−1) at the time of previous calculation, k = elimination constant (s−1) of the drug, t = time (s) elapsed since the previous calculation. This simple equation, however, cannot be used for the vast majority of drugs because two- or three-compartment models and, therefore, more complex equations describe their pharmacokinetics significantly better (for models and equations, see [11]). This complexity can be avoided by computing drug levels in all compartments using time steps much shorter than the shortest half-life for a particular drug. For example, according to numerous published PK studies of cocaine, the half-lives of elimination from the central and peripheral compartments are longer than 360 s, the half-lives of distribution and redistribution between compartments are longer than 20 s. Therefore, computing cocaine levels every 1 s using linear equations for each compartment was expected to closely approximate cocaine levels computed using exponential equations because small pieces of the exponential curve approximate a straight line. The following model (Fig. 1) and equations were used in this study:
| (3) |
| (4) |
where: Lcc = a current central level of the drug, Lpc = a previous (i.e., result of a previous calculation, Lcc a second ago) central level, Lcp = a current peripheral level of the drug, Lpp = a previous peripheral level, V01 = the amount of drug administered during this second, k10 = the constant of elimination from the central compartment, k12 = the constant of distribution from the central compartment to the peripheral, k21 = the constant of redistribution from the peripheral to the central compartment, k20 = the constant of elimination from the peripheral compartment.
5. Results
5.1. Mathematical modeling of a single injection
Basic principles of pharmacokinetics are based on the assumption that drug distribution and elimination are processes obeying the Commutative Law of addition. Therefore, the overall result of distribution and elimination of multiple injections can be calculated as a superposition of distribution and elimination of each injection calculated separately. Considering the two-compartment model with injection into the central compartment and elimination from both compartments, the following equations will describe the drug concentration in the central (Xc) and peripheral (Xp) compartments at any time (t) after the beginning of injection:
| (5) |
| (6) |
where: α + β = k10 + k12 + k21 + k20 and α · β = k10 · k21 + k20 · k12 + k10 · k20 and where: Xco = concentration in the central compartment at the time zero and Xpo = concentration in the peripheral compartment at time zero.
Graphical analysis demonstrates that, for drugs with distribution rates (k12 and k21) 10-fold faster than a rate of elimination from the central compartment (k10) and elimination from the peripheral compartment (k20) 3-fold slower than from the central compartment, the linear model gives less then 5% deviation from the exponential model after the time equal to 10 central elimination half-lives if 20 or more calculations are made every half-life (Fig. 2). The error for the peripheral compartment is typically lower compared to that of the central compartment. Generally, the calculation interval should be shorter than the shortest half-life, which typically is the distribution half-life. A calculation interval 10-fold shorter than the distribution half-life gives a relative deviation smaller than 2.3% for the peripheral compartment. This system (the equipment and software) makes it possible to calculate the drug levels every 1 s and therefore, for the vast majority of drugs with elimination and distribution slower than for cocaine, the deviation of calculations based on the linear model from the exponential model should not exceed 2%. This means that the difference between real drug levels and calculated by this method levels will mostly originate not from the difference between linear and exponential models (which is <2%) but from individual variability (which easily reaches 50% and more) of real half-life values. Means of those values determined separately in standard PK studies are usually used for modeling.
Fig. 2.

Drug levels in the central (A) and in the peripheral (B) compartments with injection into the central compartment and elimination from both compartments. The values for pharmacokinetic parameters were set as follows: k10 = ln(2), k12 = k21 = k10·10, k20 = k10/3, V01 = 100·ln(2). At these values, the injection of 100 units of a drug takes a time equal to the half-life of elimination from the central compartment. Solid lines represent the drug levels in compartments calculated according to classical exponential PK equations (see [11]). Dotted lines represent the absolute difference between drug levels calculated according to continuous exponential model (Eqs. (5) and (6)) and according to discrete linear model (Eqs. (3) and (4)). The intermittent lines represent the relative error of the linear model estimates as a percent of the exponential model values at every time point. A substantial difference between models is observed at the time of the first and second calculation points immediately after the beginning and after the end of the injection.
5.2. Cocaine self-administration
Rats with indwelling jugular catheters were trained to press a lever for the standard dose of cocaine. The time required for the association between the lever press and cocaine injection to be established varies substantially between individual animals from 1 to 30 days in rats and between 1 to 7 days in mice. Within 5–8 days after acquisition, animals reached the criterion for stable maintained self-administration of the standard cocaine dose defined as less than ±10% variance (standard deviation, SD) in the mean inter-injection interval between three consecutive daily sessions. Then, the cocaine dose was changed for each session in pseudo random order, balancing the lower and the higher range of doses (300–12,000 nmol kg−1). Not more than two different doses were selected for each session. A graphical representation of a cocaine self-administration session is shown in Fig. 3. The four main stages of the session may be described as: (1) Priming–a single injection of 1500 nmol kg−1 of cocaine was given immediately at the beginning of the session; (2) Loading—series of lever presses with short intervals independent of the unit dose that normally lasted between 3 min and 10 min (the lower the unit dose of the drug, the longer the loading phase); (3) Maintenance—the phase when animals maintain regular intervals between injections, the intervals were nonlinearly proportional to the unit dose of cocaine, and this phase lasted as long as cocaine was available (typically between 2 h and 4 h); (4) Extinction—a burst of lever presses starting with the first press not followed by the injection, then the rate of presses gradually decreased along with a decrease in cocaine level. Typically, this phase lasted between 20–40 min.
Fig. 3.

Graphical representation of a cocaine self-administration session. The upper and lower panels represent the actual graphical output from a typical session, which is archived, and the data are entered into a database. Sprague–Dawley rat #336 weighed 386 g on Day 63 after the surgical implantation of the right jugular catheter. The schedule of self-administration was: fixed ratio = 1, time out = time of the pump activation, cues = light signals during injections. Symbols represent the following events: (○) priming injection of 1500 nmol kg−1 of cocaine given immediately after the rat was placed in the experimental chamber; (▲) loading self-administrations at the dose 300 nmol kg−1; (●) maintenance self-administrations of the dose 300 nmol g−1; (■) maintenance self-administrations of the dose 12,000 nmol kg−1; (▼) lever presses during the extinction phase (no injections and no light signals). Upper panel: Cumulative number of lever presses represented by the symbols are shown. Slopes of regression lines represent the mean rate of self-administration for each phase of the session. Mean inter-press intervals were: during loading phase = 12.3 s (standard error, SEM, standard deviation, SD, and total number of presses, n, during each phase are shown), during maintenance at 300 nmol kg−1 unit dose = 45.5 s, during maintenance at 12,000 nmol kg−1 = 967.1 s, during the initial period of extinction = 12.8 s. Lower panel: Calculated levels of cocaine at the beginning of injections and at the time of extinction level presses represented by the corresponding symbols (see upper panel). The trends in average levels for each unit dose during the maintenance phase are represented by the slopes of regression lines assuming the half-life of cocaine t1/2 = 480 s (one-compartment model, where k12 = k21 = k20 = 0 was assumed). The levels of cocaine at which lever-pressing occurred during the maintenance phase were 5524.4 nmol kg−1 and 5273.7 nmol kg−1 at cocaine unit doses of 300 nmol kg−1 and 12,000 nmol kg−1, respectively.
6. Discussion
6.1. Drug concentration as a determinant of behavior in the self-administration paradigm
The fundamental dependent variable in the self-administration paradigm is the inter-press interval. The upper panel of Fig. 3 demonstrates that there was no good correlation between inter-press intervals and the cocaine unit dose. First, although the cocaine unit dose remained the same (300 nmol kg−1), there was an abrupt change in the rate of responses occurring in the beginning of the session and delineating the end of the loading phase and the beginning of the maintenance phase of the session. Second, lever-pressing activity was observed during the extinction phase when lever-presses did not result in cocaine injection (zero unit dose). On the other hand, during the maintenance phase, the inter-injection interval seemed to be proportional to the unit dose of cocaine.
Data, presented on the lower panel of Fig. 3, demonstrate that very good correlation with lever-pressing activity can be found if we assume that the cocaine level, not the unit dose, represents the independent variable in the self-administration paradigm. The probability of lever-pressing activity was very high when the cocaine level was below (during loading and extinction phases of the session) or in the vicinity of (during maintenance phase) the critical level called the satiety threshold [16,19]. The cocaine levels calculated according to Eqs. (3) and (4) represent the total amount of the drug in the whole body or compartments in terms of nmol kg−1. Although this is not a concentration, the concentration can be calculated if a value for the volume of distribution (Vd) is known. It is important to note that the Vd is a linear coefficient between the amount of the drug (nmol kg−1) and its concentration (nmol l−1 or nM). Therefore, as long as the Vd remains constant, the level is directly proportional to the concentration.
6.2. Alternative protocols
There are two different methods of calculation of drug levels: (1) at the time of occurrence of important events using exponential equations and (2) at constant and relatively short time intervals regardless of events using linear equations. The constant calculation interval method employed in this study, when cocaine level has been calculated every second (or another fixed time interval if necessary), has an advantage of making the program very simple. The alternative method of calculation, when cocaine level has been calculated only at the moment of the relevant event, like lever press and turning the pumps on and off, makes the program more complex and, therefore, susceptible to errors. The alternative exponential method is more accurate (though only by several percentage points), but it does not allow monitoring of the cocaine level on the computer screen at any moment of the session. This difference is especially important during supplemental cocaine infusion and during long-term extinction when the rat does not press the lever and pumps do not go on and off frequently.
6.3. Advantages–disadvantages
Pharmacology as a scientific discipline studies the relationship between drug concentration at the site of action and drug effects. In most cases, drug effects can be monitored continuously before, during, and after drug administration. However, classical PK methods of measuring drug concentration are limited to certain time points and certain compartments (typically, the central compartment, i.e., plasma). Real time calculation of drug levels in vivo may not replace the direct measurement of drug concentrations, however, it is a powerful tool to study correlations between drug concentrations and drug effects. Practically, unlimited number of time points and sites (multi-compartment models) represent the major advantage of the calculation method over the classical PK methods.
The direct PK measuring method requires blood sampling of approximately 0.1 ml per analysis or more. Therefore, the total volume of withdrawn blood per hour is limited, especially in small animals such as rats and mice, thereby limiting the number of measurements. Furthermore, this method requires very sophisticated equipment (GC-MS or HPLC) and highly skilled technicians to operate this equipment. The method of calculation described in this paper requires only a personal computer with a relatively simple program and provides results in real time. Once a good correlation between behavior and calculated drug levels has been established, then the direct measurement of drug concentrations at certain time points and sites can be used for the purpose of verification of selected pharmacokinetic compartment model and constants. The developed protocol may also be useful when real time monitoring of drug levels is required as, for example, in clinical settings during surgery under general anesthesia with intravenous administration of variable doses/intervals of anesthetics on demand as well as at home or in clinics during patient-controlled analgesia with variable doses/intervals between analgesic self-administrations.
6.4. Troubleshooting
The absolute values of the estimated drug levels and respectively the validity of the method greatly depend on how accurate the assumptions of the distribution and elimination half-lives are. These constants have been determined in PK studies by direct measurement of drug concentrations in plasma as a function of time. However, the resulting values for distribution and elimination half-lives vary significantly between studies, demonstrating their dependence on many factors like regimen of drug administration [13], regimen of blood sampling (for review, see [5]), and selected pharmacokinetic models [4]. Therefore, caution should be exercised when choosing what distribution and elimination half-life values should be used for drug level computation during self-administration sessions. It should be also noted that half-lives of distribution and elimination of the drug can significantly differ between species as well as between individuals and populations of the same species from different sources.
The accuracy of the calculation method used in this study depends on the time interval between successive points of estimation of the drug level. The shorter the elimination half-life of the drug, the shorter this interval should be. For short lived drugs like remifentanil with half-life of approximately 40 s [12], the interval between successive points of estimation of the drug level should be decreased to 0.1 s in order to retain the same level of accuracy determined in this study for cocaine.
The proposed method of computation of drug levels requires a certain number of assumptions to be made: (i) the distribution and elimination of the drug are first-order or zero-order kinetic processes; (ii) the distribution and elimination constants for the drug are known; (iii) the distribution half-life is significantly shorter than or comparable to the elimination half-life; (iv) all constants do not significantly alter over the duration of the experiment; and (v) all constants do not depend on the drug level.
Elimination of most drugs from the body is a first-order (rate of elimination is proportional to the concentration) process regardless of the particular mechanism: enzymatic metabolism, renal excretion, lung exhalation, etc. [11]. However, at high concentrations, because of saturation of hepatic enzymes or renal capacity, the elimination process may become zero-order. For instance, the pharmacokinetics of ethanol is best described by a three-compartment model with zero- and first-order processes taking place simultaneously [15]. Corresponding corrections of the PK model and equations are required in this case (for details, see [11]). Distribution of most drugs after intravenous administration is usually a much faster process than elimination. However, if the route of administration is different, the rate of the distribution process may become comparable with elimination and a corresponding computational equations must be used (for details, see [11]).
Little is known about temporal stability of the distribution and elimination constants. For some drugs, the process of induction or inhibition of hepatic and/or renal clearance has been demonstrated [3,10]. The effect of drugs affecting hepatic clearance on cocaine self-administration was also demonstrated [9]. Both distribution and elimination constants can also depend on absolute level of the drug at the time of calculations and/or on the previous experience of the animal with this or other drugs. In all cases, new equations, relating PK constants and independent variables (time, current drug level, previous exposure, etc.), should be added into the system of equations used for calculation to make corresponding corrections in the computational equations [20].
A leaking catheter represents a more serious problem because it irreversibly invalidates the entire data set. This is because the selected pharmacokinetic model does not fit the actual processes of absorption and elimination. The patency of the catheter should be checked on a regular basis or in response to specific indications. Indications to conduct Brevital test for the patency of the catheter are as follows: (1) the animal demonstrates unusually poor acquisition or (2) unusually irregular pattern of acquired self-administration; (3) heparin solution is emerging under the skin around the catheter outlet on the back of the rat during flushing before and/or after the self-administration session; (4) at the end of a series of experiments to confirm the integrity of the self-administration behavior before interpreting the results; (5) an obvious discrepancy (lack of correlation) between behavior and calculated drug levels.
The dead volume of the catheter depends on the size of the guide cannula and tubing used to assemble the catheter. This volume is typically between 5 μl and 20 μl. The amount of the drug captured in the dead volume is proportional to the concentration of the drug solution and may be comparable with relatively high unit dose. Thus, in the present experiments, the concentration of cocaine solution was 40 μmol ml−1, the dead volume of the jugular catheter was 13.5 μl, for the rat weighing 400 g, it corresponded to the unit dose of 1.35 μmol kg−1 of cocaine. However, in mice, this dose was close to 9 μmol kg−1 (5.6 μl dead space, 25 g body weight). Therefore, the dead volume must be taken into account when the program running the self-administration session is written.
6.5. Data storage and analysis
Data management is an important part of any experiment and its significance increases with the increase in the amount of accumulated data. Naturally, the calculation of the drug level at the moment of every behavioral event increases the volume of data by 50%. The whole process of data storage and analysis can be managed within four relatively separate stages. We suggest that data should be: (1) monitored on the computer screen during the course of the experiment; (2) printed at any phase of the experiment and/or after the experiment is finished; (3) saved on a disc; (4) imported into graphic, statistical, and/or database programs. Our experience shows that importing data into the database constructed specifically for this purpose is the most optimal form to store this kind of data (one session takes approximately 75–100 Kb of hard disc space) and to retrieve data for future statistical analysis.
7. Quick procedure
Implantation of the indwelling intravenous catheter. Allow 1 week for healing.
Training of drug-maintained behavior. Continue until stable pattern of self-administration has been established.
Collecting experimental data with calculation of drug levels in real time.
Data analysis to determine whether the studied behavior correlates with drug levels.
8. Essential literature references
Acknowledgments
These studies were supported by DA12043 and DA14189 from the National Institute on Drug Abuse. We thank Mantana K. Norman, Michael R. Tabet, and Jeremy S. Gibson for their expert technical assistance.
References
- 1.Barr JE, Holmes DB, Ryan LJ, Sharpless SK. Techniques for the chronic cannulation of the jugular vein in mice. Pharmacol Biochem Behav. 1979;11:115–118. doi: 10.1016/0091-3057(79)90307-1. [DOI] [PubMed] [Google Scholar]
- 2.Blakesley BC, Dinneen LC, Elliott RD, Francis DL. Intravenous self-administration of heroin in the rat: Experimental technique and computer analysis. Br J Pharmacol. 1972;45:181P–182P. [PMC free article] [PubMed] [Google Scholar]
- 3.Bonate PL, Reith K, Weir S. Drug interactions at the renal level. Implications for drug development. Clin Pharmacokinet. 1998;34:375–404. doi: 10.2165/00003088-199834050-00004. [DOI] [PubMed] [Google Scholar]
- 4.Boni JP, Barr WH, Martin BR. Cocaine inhalation in the rat: pharmacokinetics and cardiovascular response. J Pharmacol Exp Ther. 1991;257:307–315. [PubMed] [Google Scholar]
- 5.Booze RM, Lehner AF, Wallace DR, Welch MA, Mactutus CF. Dose–response cocaine pharmacokinetics and metabolite profile following intravenous administration and arterial sampling in unanesthetized, freely moving male rats. Neurotoxicol Teratol. 1997;19:7–15. doi: 10.1016/s0892-0362(96)00180-8. [DOI] [PMC free article] [PubMed] [Google Scholar]
- 6.Caine SB, Lintz R, Koob GF. Intravenous drug self-administration techniques in animals. In: Sahgal A, editor. Behavioral Neuroscience: A Practical Approach. Oxford Univ. Press; Oxford: 1993. pp. 117–143. [Google Scholar]
- 7.Caine SB, Negus SS, Mello NK, Patel S, Bristow L, Kulagowski J, Vallone D, Saiardi A, Borrelli E. Role of dopamine D2-like receptors in cocaine self-administration: studies with D2 receptor mutant mice and novel D2 receptor antagonists. J Neurosci. 2002;22:2977–2988. doi: 10.1523/JNEUROSCI.22-07-02977.2002. [DOI] [PMC free article] [PubMed] [Google Scholar]
- 8.Chistyakov VS, Tsibulsky VL. How to achieve chronic intravenous drug self-administration in mice. J Pharmacol Toxicol Methods. doi: 10.1016/j.vascn.2005.03.009. in press. [DOI] [PubMed] [Google Scholar]
- 9.Dougherty J, Pickens R. Effects of phenobarbital and SKF 525 A on cocaine self-administration in rats. In: Singh JM, Lal H, editors. Neurobiology and Influences on Behavior. ix. Stratton Intercontinental Medical Book; New York: 1974. pp. 386pp. xi–xiv.pp. 135–143. p. illus. [Google Scholar]
- 10.Fuhr U. Induction of drug metabolising enzymes: pharmacokinetic and toxicological consequences in humans. Clin Pharmacokinet. 2000;38:493–504. doi: 10.2165/00003088-200038060-00003. [DOI] [PubMed] [Google Scholar]
- 11.Gibaldi M, Perrier D. Pharmacokinetics. Vol. 15. Marcel Dekker, Inc; New York: 1982. p. 494. [Google Scholar]
- 12.Haidar SH, Moreton JE, Liang Z, Hoke JF, Muir KT, Eddington ND. Evaluating a possible pharmacokinetic interaction between remifentanil and esmolol in the rat. J Pharm Sci. 1997;86:1278–1282. doi: 10.1021/js970079e. [DOI] [PubMed] [Google Scholar]
- 13.Lau CE, Sun L. The pharmacokinetic determinants of the frequency and pattern of intravenous cocaine self-administration in rats by pharmacokinetic modeling. Drug Metab Dispos. 2002;30:254–261. doi: 10.1124/dmd.30.3.254. [DOI] [PubMed] [Google Scholar]
- 14.Leberer MR, McKnight RR, Wirth P. A method for implantation of a chronically indwelling intravenous catheter in the pigeon. Behav Res Methods Instrum. 1976;8:11–14. [Google Scholar]
- 15.Norberg A, Jones AW, Hahn RG, Gabrielsson JL. Role of variability in explaining ethanol pharmacokinetics: research and forensic applications. Clin Pharmacokinet. 2003;42:1–31. doi: 10.2165/00003088-200342010-00001. [DOI] [PubMed] [Google Scholar]
- 16.Norman AB, Tsibulsky VL. Satiety threshold regulates maintained self-administration: comment on Lynch and Carroll (2001) Exp Clin Psychopharmacol. 2001;9:151–154. doi: 10.1037//1064-1297.9.2.151. [DOI] [PubMed] [Google Scholar]
- 17.Pickens R, Hauck R, Bloom W. A catheter-protection system for use with monkeys. J Exp Anal Behav. 1966;9:701–702. doi: 10.1901/jeab.1966.9-701. [DOI] [PMC free article] [PubMed] [Google Scholar]
- 18.Stretch R, Gerber GJ. A method for chronic intravenous drug administration in squirrel monkeys. Can J Physiol Pharmacol. 1970;48:575–581. doi: 10.1139/y70-088. [DOI] [PubMed] [Google Scholar]
- 19.Tsibulsky VL, Norman AB. Satiety threshold: a quantitative model of maintained cocaine self-administration. Brain Res. 1999;839:85–93. doi: 10.1016/s0006-8993(99)01717-5. [DOI] [PubMed] [Google Scholar]
- 20.Venkatakrishnan K, von Moltke LL, Obach RS, Greenblatt DJ. Drug metabolism and drug interactions: application and clinical value of in vitro models. Curr Drug Metab. 2003;4:423–459. doi: 10.2174/1389200033489361. [DOI] [PubMed] [Google Scholar]
- 21.Yanagita T, Deneau G, Seevers MH. Evaluation of pharmacologic agents in the monkey by long term intravenous self or programmed administration. Excerpta Med Int Congr Ser. 1965;87:453–457. [Google Scholar]