Abstract
Ionizing radiation produces a distinctive pattern of bistranded clustered lesions in DNA. A relatively low number of clustered lesions may be lethal to cells when compared to a larger number of single lesions. Enzyme cleavage experiments suggest that the orientation of bistranded lesions causes differential recognition and removal of these lesions. Similar to a previous study of bistranded abasic site lesion [Hazel, R. D., Tian, K., and de los Santos, C. (2008) Biochemistry, 47, 11909–11919], the aim of this investigation was to solve the structures of two DNA duplexes each containing two synthetic apurinic/apyrimidinic (AP) residues, positioned on opposite strands and separated by two base pairs. In the first duplex the AP residues are staggered in the 3’ orientation, (−3 duplex, (AP)2−3 duplex), while in the second duplex the AP residues are staggered in the 5’ orientation (+3 duplex, (AP)2+3 duplex). NOESY spectra collected in 100% and 10% D2O buffer solutions allowed the assignment of the non-exchangeable and exchangeable protons, respectively, for each duplex. Cross peak connectivity in the non-exchangeable proton spectra indicate that the duplex is a regular right-handed helix with the AP residues and orphan bases located inside the duplexes. The exchangeable protons spectra establish the formation of Watson-Crick G•C alignment for the two base pairs between the lesion sites in both duplexes. Distance restrained molecular dynamics simulation confirmed the intra helical orientations of the AP residues. The proximity of the AP residues across the minor groove of the −3 duplex and across the major groove in the +3 duplex is similar to their locations in the case of −1 and +1 clusters. This difference in structure may be a key factor in the differential recognition of bistranded AP lesions by human AP endonuclease.
Keywords: DNA DAMAGE, MULTIPLE DAMAGE SITE, ABASIC SITE, CLUSTERED BISTRANDED LESIONS, IONIZING RADIATION, DIFFERENTIAL RECOGNITION, TETRAHYDROFURAN
Ionizing radiation produces DNA damage either by direct interaction with the DNA helix or via oxidative pathways involving the formation of free radicals (1–3). The abasic site, or apurinic/apyrimidinic (AP) lesion, is one of the many lesions produced by ionizing radiation (1, 2). The mechanisms of energy deposition from ionizing radiation is unique for its ability of producing clustered lesions, which are multiply damaged sites (MDS) within one turn of the DNA helix (4, 5). Bistranded abasic clustered lesions are particularly noteworthy since their complexity poses a serious challenge to DNA repair enzymes in cells; lesions that are not repaired can be mutagenic while miss repair can lead to apoptosis, a fact that is exploited in radiation therapy and chemotherapy for the treatment of cancer (6–8).
The orientation of clustered bistranded AP lesions affects the efficiency of DNA repair enzymes. Enzymatic studies show differences in endonuclease activity depending on the arrangement of the AP lesions (6–12). When bistranded AP residues are staggered in the 3’ orientation and positioned one or three residues apart (−1 or −3 lesion), human AP endonuclease 1 (hApe1) cleaves less than 10% of either AP residue (8). However when the bistranded AP residues are staggered in the 5’ orientation (+1 or +3 lesion), the enzyme shows significant cleavage of the AP residues, similar to that observed for a single AP lesion duplex (8). Similar observations have been made with bistranded lesions located up to five nucleotides away (9, 10), while those lesions located seven or more nucleotides away are processed normally with similar efficiency to that of a single AP lesion.
The difference in DNA structure is hypothesized to be the cause of differential cleavage and repair of bistranded clustered lesions. In studies similar to the present one, the structures of two pairs of DNA 13-mer duplexes containing 3’- and 5’-oriented (−1 and +1 duplexes, respectively) bistranded AP lesions have been solved (8, 13). In one study the abasic residues were separated by a G•A mismatched pair in the central sequences d(T-G-F-G)-.d(A-F-A-C)- and d(G-F-G-T)-.d(C-A-F-A)- respectively. Those results indicated that the AP residues are arranged in extra helical bulges with the formation of a G•A mismatched pair which is coplanar in the −1 duplex, but with the G and A intercalated into the helix in the +1 duplex. In the second study, the impact on structure and stability of a Watson-Crick G•C base pair at the center of the helix was investigated in the solution structure of a pair of related 13-mer duplexes having (−1) and (+1) bistranded AP clusters (8). In this case, the central G•C base pair adds stability to the helix at the lesion site while the AP residues are aligned with the backbone and located on either side of the minor groove in the −1 duplex or located in an extra helical orientation on the major groove of the +1 duplex.
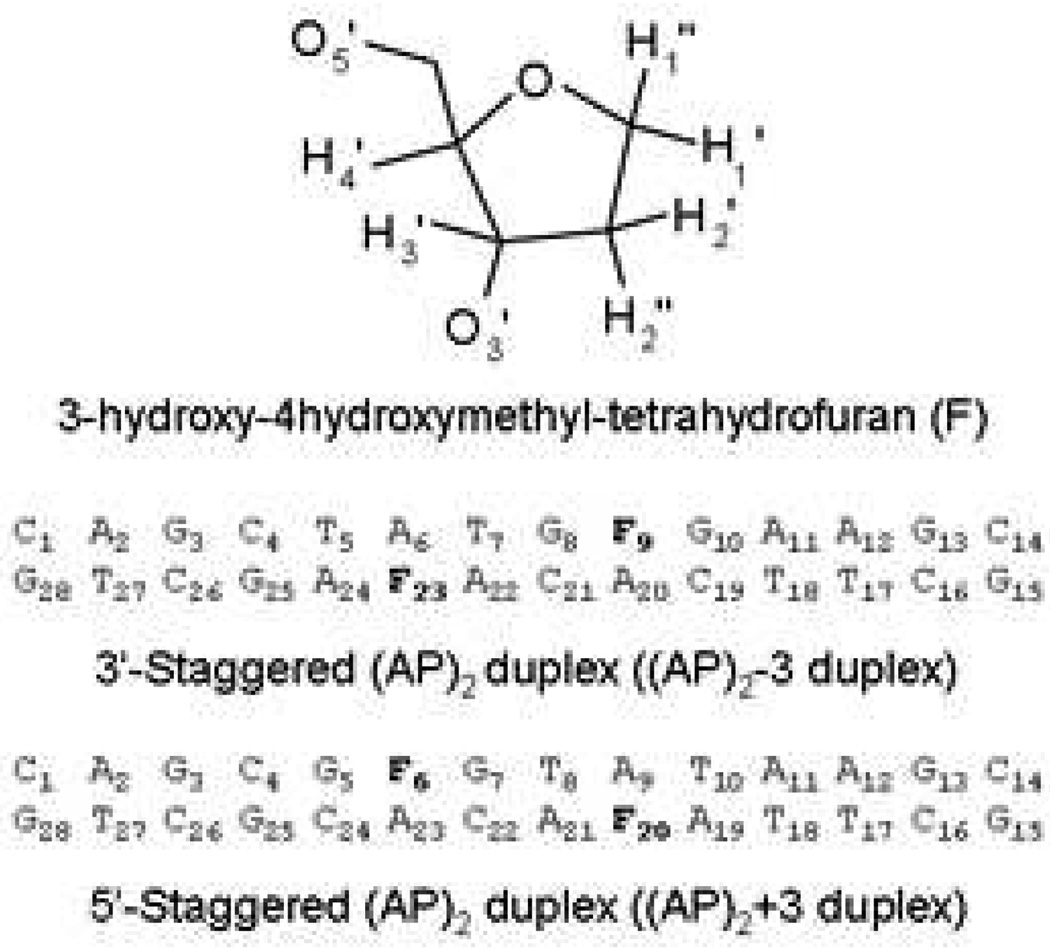
The aim of this study is to further investigate the difference in DNA structure between 3’ and 5’ oriented bistranded AP clusters that are three base pairs apart. We have chosen for synthesis (14), a (−3) duplex, designated (AP)2−3 duplex, and a (+3) duplex, designated (AP)2+3 duplex, with bistranded THF abasic sites (Figure 1) and compare these results to previous studies. While, the mechanism of differential recognition and cleavage inhibition of clustered AP lesions remains unresolved, the solution structures of these clustered lesions contribute to further elucidation of this phenomenon.
Figure 1.
Chemical structure of a stable AP site Tetrahydrofuran (THF) residue, and DNA sequences of the (AP)2−3 duplex and the (AP)2+3 duplex. AP residues are denoted by the letter F.
MATERIALS AND METHODS
Sample Preparation
The synthesis of AP duplexes was done by the phosphoramadite chemistry method, incorporating a THF residue as previously described (14). Purification of the samples was done by reverse phase HPLC, desalting and conversion to the sodium salt was achieved using a Sephadex G-25 column and a Dowex 50W cation exchange column respectively (8). Complimentary strands of each duplex were annealed after using Gene Runner V3.0, (Hasting Software Inc.) and making UV absorption measurements at 260 Å to determine the amount of each strand that would yield 1:1 stoichiometry. Samples were then lyophilized and dissolved in 0.7 ml of 25 mM phosphate buffer at pH 6.8, containing 50 mM NaCl and 0.5 mM EDTA in 99.96% D2O or in 90% H2O/10% D2O.
NMR Methods
Both one-dimensional (1D) and two-dimensional (2D) NMR spectra were recorded using either a 600 MHz or a 500 MHz Varian NMR spectrometer. Proton spectra were collected from samples dissolved in 99.96% D2O at 15 °C and in 90% H2O/10% D2O at 1 °C. NOESY (15) spectra in 100% D2O were collected at mixing times of 50 ms 100 ms 200 ms and 300 ms for distance estimates and proton assignment. COSY, DQF-COSY, and TOCSY (60, 120 ms mixing times) spectra were collected to aid in proton assignment. The repetition delay for 2D spectra collected with the sample dissolved in D2O at 25 °C was 1.4 s during which time a saturation pulse was applied to suppress the water signal. 1D, spectra over the 5° to 35° C temperature range, and two-dimensional NOESY maps (120 ms and 220 ms mixing times) at 5° C were also collected in 10% D2O using a jump-return reading pulse (16). All 2D spectra consisted of 2048 by 300 complex data points in the t2 and t1 dimensions, respectively. NMR spectra were processed on a Silicon Graphics computer using Felix97 (Biosym) software. Before the Fourier transformation was performed, time domain data were multiplied by a sinebell function and a convolution function, if necessary for further water suppression. NOESY, COSY and TOCSY spectra collected at room temperature, were used to deduce the sequence specific assignment of non-exchangeable protons as previously described (17–19). The AP residues were identified from COSY spectra by their distinctive sugar protons, which appeared around a chemical shift of 4.2 ppm. The 2D spectra of exchangeable protons were used to verify the Watson-Crick alignment of internal base pairs, while the 1D spectra were used to measure the thermal stability of the duplexes.
Computational Methods
Computational modeling and restrained molecular dynamics simulations were done on Silicon Graphics Workstation computers using Insight II (Accelrys, San Deigo, CA) and X-PLOR 3.1 (20), respectively. Structures were visualized with Midas Plus (UCSF, Computer Graphics Laboratory), and helical parameters were computed using Curves 5.1 (21, 22). Two initial models of each duplex were constructed in Insight II, starting with 14-mer A-Form and B-form DNA duplexes, and then replacing the purine or pyrimidine moieties with a single proton to create the THF residues. Initial models were minimized before beginning molecular dynamics.
NOE cross peak volumes were measured from all NOESY spectra in D2O and interproton distances were calculated for each mixing time, using a relaxation protocol in X-PLOR. This was done for each (AP)2 duplex by minimizing only the potential energy of the B-form model duplex while adjusting only the corresponding interproton distances of the model to fit the experimental peak volumes within 0.5% error bounds. One set of interproton distances was extracted from the model for each mixing time, and then the four sets of distances were averaged to produce a single set of interproton distance restraints for each (AP)2 duplex. A 20% correction was applied to all experimental distances to account for the underestimation of those distances that are fixed by covalent geometry, such as cytosine H5–H6 and sugar H2’–H2” protons. A total of 533 NOE restraints for the (AP)2−3 duplex, and 554 NOE restraints for the (AP)2+3 duplex were derived and used for restrained molecular dynamics simulations.
The starting models of each (AP)2 duplex were then refined by running restrained molecular dynamics simulations, which were done in vacuum using the CHARM all atom force field (23). Distance bounds of ± 0.35 Å and ± 0.8 Å, for distances derived from non-overlapped and overlapped peaks, respectively, were enforced using a square well potential energy function. Watson-Crick alignments deduced from NOESY spectra in H2O were enforced by distance restraints with bounds of ± 0.1 Å, using distances derived from X-ray crystallography. Backbone and sugar pucker restraints were implemented as previously described (8, 17). The four terminal residues of each duplex were restrained in the C2’-endo conformational range following the analysis COSY45 spectra (8, 24, 25). The SHAKE algorithm was used to maintain the length of covalent bonds involving protons (26). Partial atomic charges on the phosphates were not reduced leaving deoxynucleotide residues with a net charge of −1.
The simulation protocol consisted in raising the temperature of the structures from one of four initial starting values (150, 200, 250 and 300 K) to a high temperature of 500 K in 70 ps. The scale of the NOE distance restraints was gradually increased as the temperature was raised. Simulation continued at 500 K for 42, 44, 46, 48 and 50 ps for five separate simulations, time after which the system temperature was reduced to 300 K in 40 ps. The resulting 20 structures were put through 120 ps of restrained molecular dynamics at 300 K. Each structure was then subjected to 1000 steps of energy minimization to produce a distance refined structure. Five final structures were chosen from the 20 structures for each (AP)2 duplex. These final structures showed no NOE violations greater than 0.1 Å and exhibited pair wise root mean square deviation (rmsd) measurements of 1.2 Å or less. The low van der Waals energy for the refined structures was achieved by lowering the penalty NOE function during the final 120ps of restrained dynamics at room temperature.
RESULTS
Non-exchangeable Protons(AP)2−3 Duplex
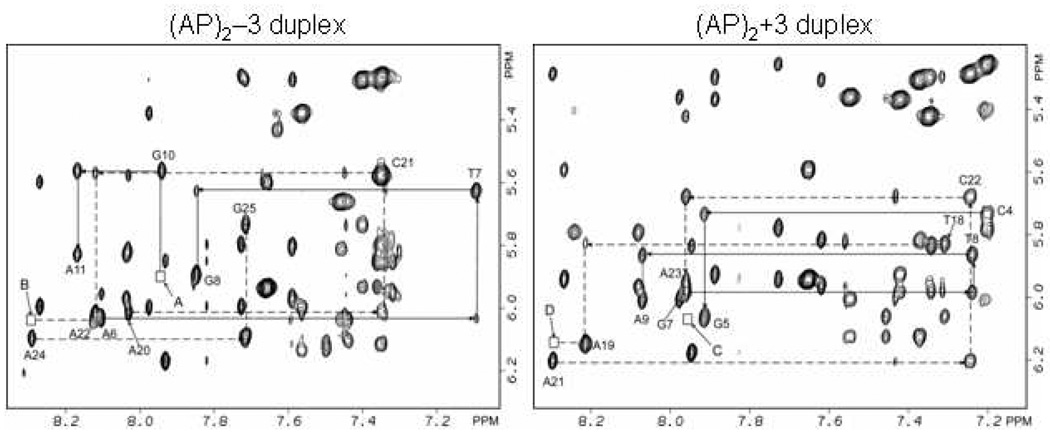
The expanded NOESY contour map (mixing time 300ms) showing connectivity between the base (7.0–8.5 ppm) and the sugar H1’ (5.2–6.4 ppm) protons at the lesion site of the (AP)2−3 duplex is plotted in Figure 2. The complete walk around the expanded NOESY plot of this same region is illustrated in Figure S1 (Supporting Information). Cross peak connectivity between base (pyrimidine H6/ purine H8) protons and their own and 5’ flanking sugar H1’ protons indicate that the helix is right-handed in the (AP)2−3 duplex. No inter-residue cross peaks were observed between the base and the sugar H1’ protons across the lesion site indicating no through-space connectivity between the residues separated by the AP sites. The missing cross peaks between G8 and G10, and between A22 and A24 are indicated by arrows A and B in Figure 2, and are consistent with the arrangement of both AP residues inside the helix.
Figure 2.
Expanded contour plot of the phase sensitive NOESY spectrum (300ms mixing time) in D2O buffer containing 50mM NaCl, 10mM phosphate and 1mM EDTA, pH 6.8 at 25° C. Sequential connectivity in the base (7.0–8.4 ppm) and the H1’ sugar protons (5.2–6.4 ppm) are plotted for the (AP)2−3 duplex (Figure 2) and (AP)2+3 duplex (Figure 2). There no connectivity across the lesion site between residue G8 and G10, cross peaks A is missing, and in the complimentary strand between A22 and A24, cross peak B is missing (Figure 2) for the (AP)2−3 duplex. This is consistent with the intra helical arrangement of both AP residues in the (AP)2−3 duplex. In the case of the (AP)2+3 duplex, no connectivity exists between residue G5 and G7, cross peaks C is missing, and in the complimentary strand between residues A19 and A21, cross peak D is missing in Figure 2. This is consistent with the both of the AP residues being inside the helix.
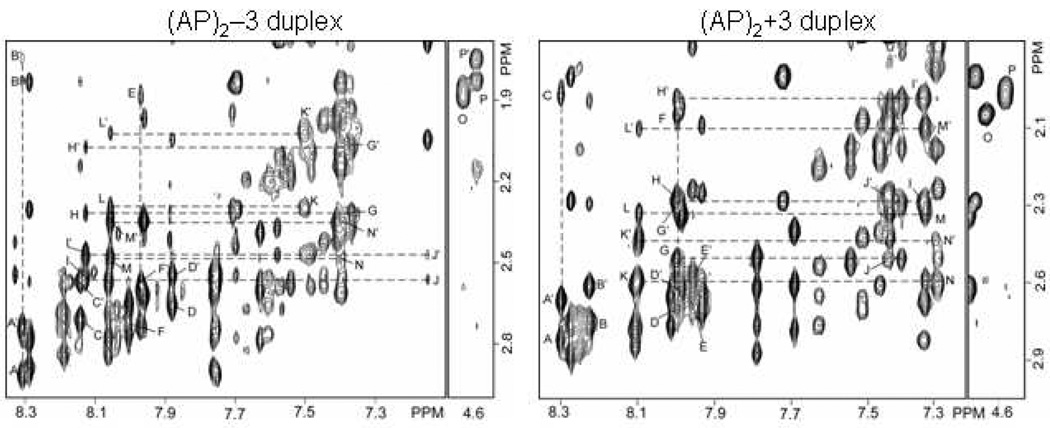
Cross peaks between base H6/H8 protons and their own and 5’ flanking the sugar H2’/2” protons provide further evidence of the right handedness of the helix (Figure 3) for the (AP)2−3 duplex. There are no cross peaks connecting residues across the lesion sites, indicating that no connectivity through space exists between residues flanking the AP sites. Intra-residue cross peaks are observed between H3’ protons and H2’/2” protons of both F9 and F23, indicated by labels O, P and P’ in Figure 3. Cross peaks consistent with intra helical AP residues are observed between residues G10 and F9, and between A24 and F23. These peaks were assigned to G10(H8)-F9(H2’/2”), labeled as peak E in Figure 3, and on the complimentary strand, two cross peaks were assigned to A24(H8)-F23(H2”) and A24(H8)-F23(H2’), labeled peaks B and B’ in Figure 3.
Figure 3.
Contour plot of expanded phase-sensitive NOESY spectra (260ms mixing time) recorded in D2O buffer containing 50mM NaCl, 10mM phosphate and 1mM EDTA at pH 6.8 at 25° C. Cross peak connectivity between base protons (7.0–8.4 ppm) and sugar H2’/2” protons (3.0-1.8 ppm) are plotted for the (AP)2−3 duplex (Figure 3) and (AP)2+3 duplex (Figure 3). (Figure 3) Peaks A/A’-P/P’ in the (AP)2−3 duplex are discussed in the text and are assigned as follows: A/A’, A24(H8)-A24(H2”)/A24(H2’); B/B’ A24(H8)-F23(H2”)/F23(H2’); C/C’, A22(H8)-A22(H2’)/A22(H2”); D/D’, G8(H8)-G8(H2’)/G8(H2”); E, G10(H6)-F9(H2”/H2’); F/F’, G10(H8)-G10(H2”)/G10(H2’); G/G’, T5(H6)-T5(H2”)/T5(H2’); H/H’, A6(H8)-T5(H2”)/T5(H2’); I/I’, A6(H8)-A6(H2”)/A6(H2’); J/J’, T7(H8)- A6(H2”)/A6(H2’); K/K’, C19(H6)-C19(H2”)/C19(H2’); L/L’, A20(H8)-C19(H2”)C19(H2’); M/M’, A20(H8)-A20(H2”)/A20(H2’); N/N’, C21(H6)-A20(H2”)/A20(H2’); O, F9(H3’)-F9(H2’/2”) and P/P’, F23(H3’)-F23(H2’)/F23(H2”). These peaks together confirm that both AP residues of the (AP)2−3 duplex are inside the helix at the lesion site. (Figure 3) Peaks A/A’-P in the (AP)2+3 duplex are discussed in the text and are assigned as follows: A/A’, A21(H8)-A21(H2”)/A18(H2’); B/B’, A19(H8)-A19(H2”)/A19(H2’); C, A21(H8)-F20(H2’/2”); D/D’, G7(H8)-G7(H2”)/G7(H2’); E/E’, G5(H8)-G5(H2”)/G5(H2’); F, G7(H8)-F6(H2’/2”); G/G’; A23(H8)-A23(H2”)/A23(H2’); H/H’, A23(H8)-C22(H2”)/C22(H2’); I/I’, C22(H6)-C22(H2”)/C22(H2’); J/J’, C24(H6)-A23(H2”)/A23(H2’); K/K’, A9(H8)-A9(H2”)/A9(H2’); L/L’, A9(H8)-T8(H2”)/T8(H2’); M/M’, T8(H6)-T8(H2”)/T8(H2’); N/N’, T10(H6)-A9(H2”)/A9(H2’); O, F6(H3’)-F6(H2’/2”) and P, F20(H3’)-F20(H2’/2”). The presence of these cross peaks indicate that the AP residues in the (AP)2+3 duplex are also inside the helix at the lesion site.
In the symmetrical base region of the NOESY spectrum, no cross peak was observed between the residues flanking the AP sites, which is again consistent with the AP residues being inside the helix. Also supporting the intra helical arrangement of AP residues, is the existence of inter-residue cross peaks between the AP site (H3’, H4’ and H1’1”) protons and the 3’ flanking base protons (Figure S3 in the Supporting Information). The sugar H1’/1” protons of the AP residues F9 and F23 are visible in COSY spectra but cannot not be stereospecifically assigned. These cross peaks occur around a chemical shift of 4.1–4.2 ppm. The cross peaks between A24(H8)-F23(H3’)/F23(H4’)/F23(H1’/1”) are labeled peaks A, B and C in Figure S3, and on the complimentary strand cross peaks between G10(H8)- F9(H3’)/F9(H4’)/F9(H1’/1”) are labeled peaks D, E and F in Figure S3.
The orphan purine bases A6 and A20 show sequential connectivity with both 5’ and 3’ flanking residues in the NOESY spectra. The sequential connectivity involving base and sugar H1’ protons through A6 in the segment (T5-A6-T7).(A22-F23,-A24), and through A20 in the segment (G8-F9-G10).(C19-A20-C21) shown in Figure 2 and Figure S1, indicate that the orphan adenosine residues are located inside the helix at 15° C. Sequential connectivity through these segments can also be traced in the base (7.0–8.4 ppm), sugar H2’/2” (3.0-1.8 ppm) region of the NOESY spectrum. In Figure 3 peaks labeled G/G’-H/H’-I/I’-J/J’ show sequential connectivity through A6 while peaks labeled K/K’-L/L’-M/M’-N/N’ show sequential connectivity through A20. These peaks are consistent with the arrangement of the adenosine residues inside the helix in the (AP)2−3 duplex. Table S1 in the Supporting Information shows the chemical shifts of protons from each residue measured from the two-dimensional NOESY maps of the (AP)2−3 duplex.
(AP)2+3 Duplex
The expanded NOESY contour map (mixing time 300ms) showing through-space connectivity between the base (7.0–8.5 ppm) and the sugar H1’ (5.2–6.4 ppm) protons at the lesion site of the (AP)2+3 duplex is plotted in Figure 2. The complete walk around the expanded NOESY plot of this same region is illustrated in Figure S2 of the Supporting Information. Cross peak connectivity between base (pyrimidine H6/ purine H8) protons and their own and 5’ flanking sugar H1’ protons indicate that the helix is right-handed in the (AP)2+3 duplex Again similar to the (AP)2−3 duplex, no inter-residue cross peaks are observed between the base and the sugar H1’ protons of residues flanking the AP sites. The missing cross peak between G5 and G7, and A19 and A21 are indicated by arrows C and D in Figure 2, and are consistent with the arrangement of both AP residues inside the helix in the (AP)2+3 duplex.
Similar to the (AP)2−3 duplex, cross peaks between base H6/H8 protons and their own and 5’ flanking the sugar H2’/2” protons provide evidence of the right handedness of the helix (Figure 3) for the (AP)2+3 duplex. Cross peaks are absent across the lesion site further indicating that no connectivity through space exists between residues separated by the AP sites. A cross peak is observed between G7 and F6. This peaks was assigned between G7(H8)-F6(H2’/2”) and labeled peak F in Figure 3. On the complimentary strand, a cross peak is visible between A21 and F20. This peak is assigned to A21(H8)-F20(H2’/2”), and labeled C in Figure 4. These cross peaks are all consistent with the intra helical arrangement of both AP residues in the (AP)2−3 duplex. No cross peak is visible between the residues flanking the AP sites in the symmetrical base region of the NOESY spectrum of the (AP)2+3 duplex. The sugar H3’, H4’ and H1’/1” protons of the AP residues display inter-residue cross peaks with their 3’ neighboring base H8 protons. These peaks are assigned to G7(H8)-F6(H3’)/F6(H4’)/F6(H1’1”), which are labeled A, B and C in Figure S4, and to A21(H8)-F20(H3’)/F20(H4’)/F20(H1’/1”), which are labeled C, D, and E in Figure S4. These peaks indicate that both F6 and F20, are located inside the helix. This is similar to the (AP)2−3 duplex where both AP residues exhibit similar peaks.
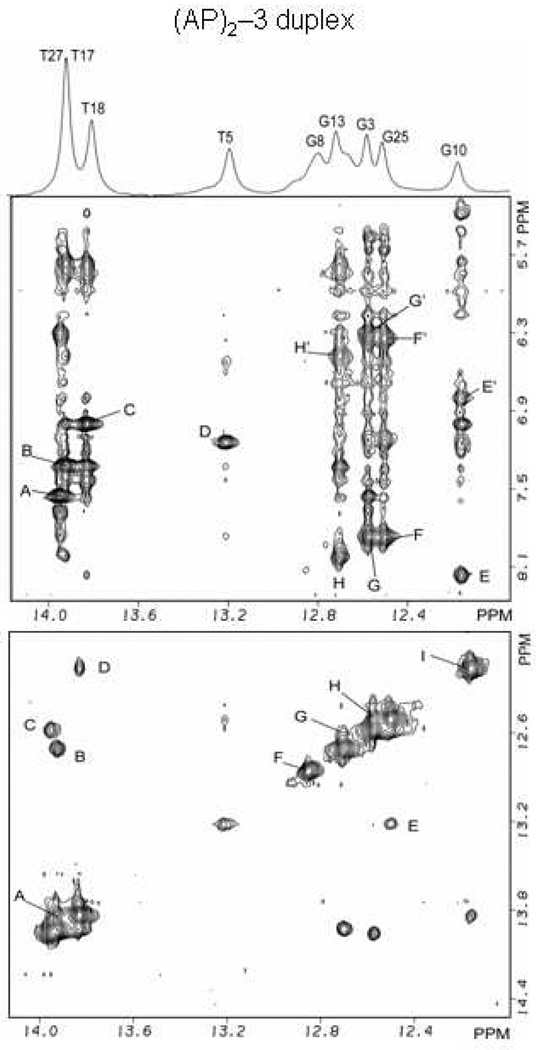
Figure 4.
(AP)2−3 duplex:- expanded phase sensitive NOESY (220ms mixing time) contour plot for the (AP)2−3 duplex in H2O buffer containing 50mM NaCl, 10mM phosphate and 1.0mM EDTA at pH 6.8 at a temperature of 5° C. (Figure 4) Cross peaks establishing connectivity between imino protons (12.0–14.0 ppm) and the base and amino protons (8.4-5.0 ppm) have been plotted. Peaks A–H/H’ in the (AP)2−3 duplex are discussed in the text and are assigned as follows: A, T27(N3H)-A2(H2); B, T17(N3H)-A12(H2); C, T18(N3H)-A11(H2); D, T5(N3H)-A24(H2); E/E’, G10(N1H)-C19(N4Hhb)/C19(N4Hex); F/F’, G25(N1H)-C4(N4Hhb)/C4(N4Hex); G/G’, G3(N1H)-C26(N4Hhb)/C26(N4Hex); H/H’, G13(N1H)-C16(N4Hhb)/C16(N4Hex. (Figure 4) Cross peak connectivity between imino protons in the symmetrical (12.0–14.0 ppm) spectral range are discussed in the text. Cross peaks at the lesion site show the existence of Watson-Crick hydrogen bonds and regular base stacking throughout the (AP)2−3 duplex. Cross peaks A-I in the (AP)2−3 duplex are assigned as follows: A, T17(N3H)-T18(N3H); B, T17(N3H)-G13(N1H); C, T27(N3H)-G3(N1H); D, T8(N3H)-G10(N1H); E, G25(N1H)-T5(N3H); F, G8(N1H); G, G13(N1H)-G15(N1H); H, G3(N1H)-G25(N1H); I, G10(N1H).
The orphan purine bases A9 and A23 show sequential connectivity with both 5’ and 3’ flanking residues in the NOESY spectra. The sequential connectivity involving base and sugar H1’ protons through A9 in the segment (T8-A9-T10).(A19-F20,-A21), and through A23 in the segment (G5-F6-G7).(C22-A23-C24) as shown in Figure 2 and Figure S2, indicate that the orphan adenosine residues are located inside the helix at 15° C. Sequential connectivity through these segments can also be traced in the base (7.0–8.4 ppm), sugar H2’/2”’ (3.0-1.8 ppm) region of the NOESY spectrum. In Figure 3 peaks labeled M/M’-L/L’-K/K’-N/N’ show sequential connectivity through A9 while peaks labeled I/I’-H/H’-G/G’-J/J’ show sequential connectivity through A23. These peaks are consistent with the adenosine residues being arranged inside the helix in the (AP)2+3 duplex. Table S2 in the Supporting Information lists the chemical shifts of protons from each residue measured from the two-dimensional NOESY maps of the (AP)2+3 duplex.
Exchangeable Protons. (AP)2−3 Duplex
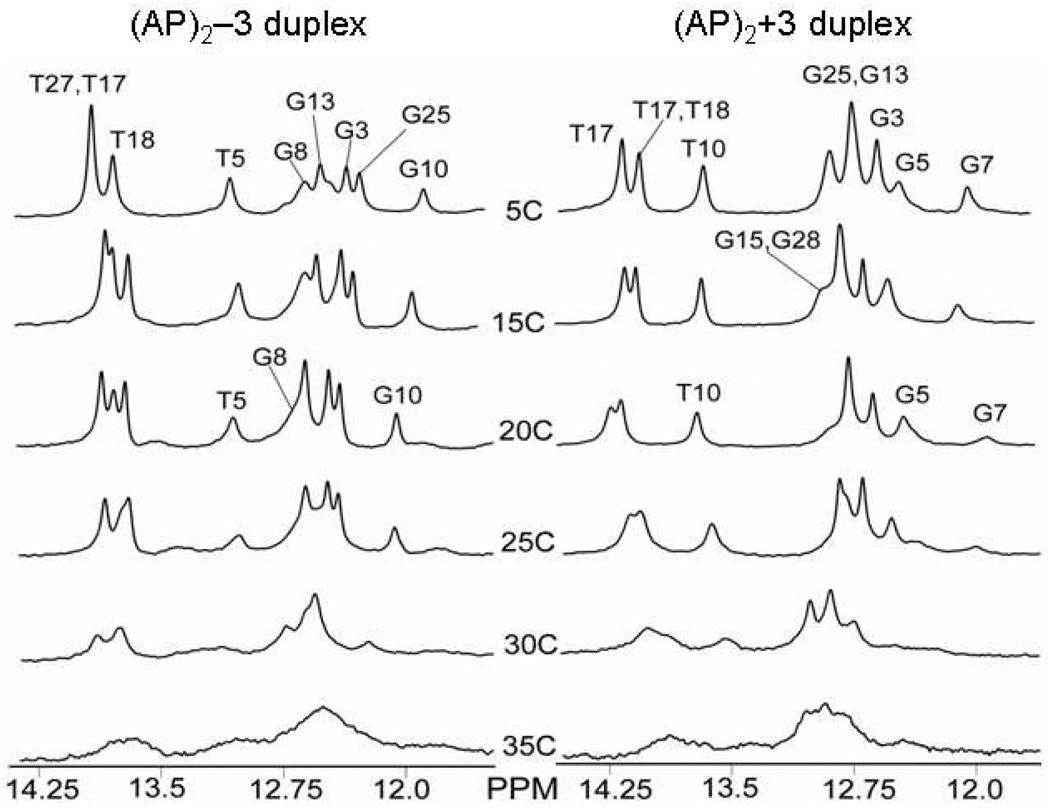
At low temperature the one-dimensional spectrum of the (AP)2−3 duplex exhibits eight partially and fully resolved spectral lines between 12.0–14.0 ppm which are assigned with the aid of two-dimensional NOESY spectra (220ms mixing time). From the one-dimensional spectrum three partially resolved signals between 13.0–14.0 ppm are assigned to the four thymidine imino protons while the five spectral lines between 12.0–13.0 ppm are assigned to five fully resolved signals of guanosine imino protons thereby accounting for the internal Watson-Crick base pairs in the (AP)2−3 duplex (Figure 4 top and Figure 6). Signals from the terminal imino protons of G15 and G28 are not resolved at 5° C as a result of fraying of the terminals of the helix. Imino proton signals from T7 and G8 in the central segment (T7-G8).(A22-C21) are conspicuously absent from the NOESY spectrum (Figure 4), possibly due to rapid exchange with protons of the solvent.
Figure 6.
Temperature dependence of the expanded 1D NMR spectra of imino protons (12.0–14.0 ppm) of the (AP)2−3 duplex (Left) and (AP)2+3 duplex (Right), in 50mM NaCl, 10mM phosphate and 1mM EDTA as the temperature is increased from 5° C to 35° C.
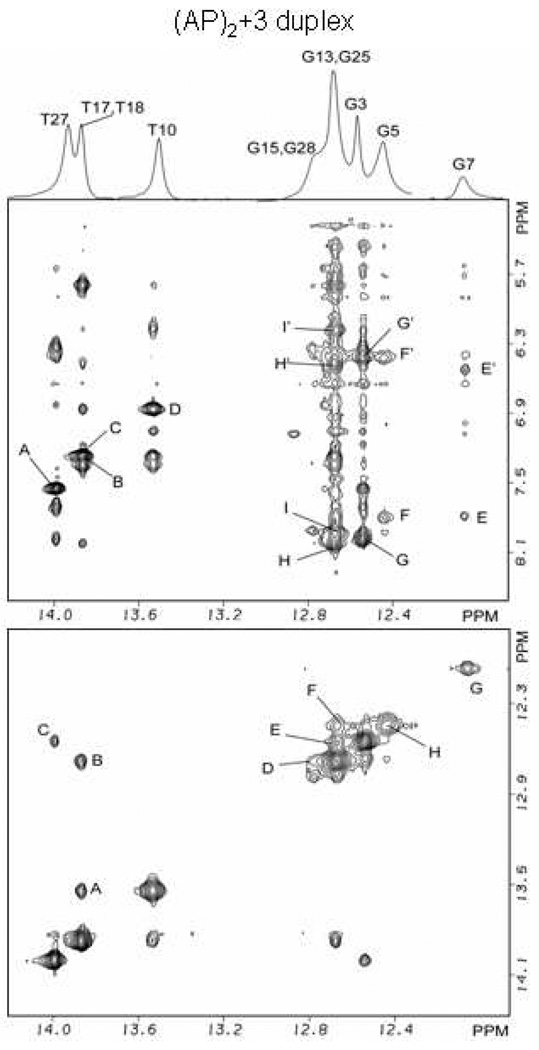
The phase-sensitive NOESY spectrum (220ms mixing time) of exchangeable protons in the (AP)2−3 duplex aided in the assignment of imino and amino protons of hydrogen bonded (hb) and exposed (ex) protons of the A•T and G•C base pairs. Two regions of interest are plotted for the expanded NOESY spectrum in Figure 4, where cross peaks represent through space connectivity between the imino protons of thymidine and guanosine, and cytidine amino and adenosine H2 protons, and in Figure 4, where cross peaks represent through space connectivity between imino protons on adjacent base pairs. In the (AP)2−3 duplex, base pairs flanking the lesion site are identified through their interaction with 3’ and 5’ neighboring bases in the symmetrical spectral region of the expanded NOESY spectrum (Figure 4). For one of these flanking bases the imino proton of T5 produces a cross peak with the G25 imino proton near 13.2 ppm, cross peak E in Figure 4, and is assigned to G25(H1N)-T5(N3H). The interaction between T5 imino and the H2 proton of A24 is fully resolved and assigned to signal D in Figure 4. At the other end of the AP segment, the imino protons of G10 and T18 produce a cross peak at 13.9 ppm, cross peak D in Figure 4, which was assigned to G10(N1H)-T18(N3H). The imino proton of the central base T7 is not resolved, however the imino proton signal from central base G8 produces a cross peak in the symmetrical region of the NOESY spectrum at 12.8 ppm, peak F in Figure 4, which is assigned to G8(N1H). Watson-Crick base pair alignment is implied by the cross peak connectivities for the remaining canonical bases throughout the duplex and these cross peaks are assigned in Figure 4 Additional interactions between imino protons of adjacent bases for the (AP)2−3 duplex are also assigned in Figure 4.
(AP)2+3 Duplex
At low temperature the one-dimensional spectrum of the (AP)2+3 duplex exhibits eight partially or fully resolved spectral lines between 12.0–14.0 ppm (Figure 5 top and Figure 6). From the one-dimensional spectrum of the (AP)2+3 duplex, one partially resolved and two fully resolved spectral lines between 13.2–14.0 ppm are assigned to four thymidine imino proton signals while the five spectral lines between 12.0–13.2 ppm are assigned to three fully and two partially resolved signals of guanosine imino protons, thereby accounting for Watson-Crick base pairs in the (AP)2+3 duplex (Figure 5 top and Figure 6). Signals from the terminal imino protons of G15 and G28 are partially resolved at 5° C in contrast to the (AP)2−3 duplex where they are not resolved.
Figure 5.
(AP)2+3 duplex:- expanded phase sensitive NOESY (220ms mixing time) contour plots for the (AP)2+3 duplex in H2O buffer containing 50mM NaCl, 10mM phosphate and 1.0mM EDTA at pH 6.8 at a temperature of 5° C. (Figure 5) Cross peaks establishing connectivity between imino protons (12.0–14.0 ppm) and the base and amino protons (8.4-5.0 ppm) have been plotted. Peaks A/A’–I/I’ are discussed in the text and are assigned as follows: A, T27(N3H)-A2(H2); B, T18(N3H)-A11(H2); C, T17(N3H)-A12(H2); D, T10(N3H)-A19(H2); E/E’, G7(N1H)-C22(N4Hhb)/C22(N4Hex); F/F’, G5(N1H)-C24(N4Hhb)/C24(N4Hex); G/G’, G3(N1H)-C26(N4Hhb)/C26(N4Hex); H/H’, G13(N1H)-C16(N4Hhb)/C16(N4Hex); I/I’, G25(N1H)-C4(N4Hhb)/C4(N4Hex); (Figure 5) Cross peak connectivity between imino protons in the symmetrical (12.0–14.0 ppm) spectral range are discussed in the text. Cross peaks at the lesion site show the existence of Watson-Crick hydrogen bonds and regular base stacking throughout the (AP)2+3 duplex. Cross peaks A–H in the(AP)2+3 duplex are assigned as follows: A, T18(N3H)-T10(N3H); B, T17(N3H)-G13(N1H); C, T27(N3H)-G3(N1H); D, G15(N1H)-G13(N1H); E, G25(N1H)-G3(N1H); F, G5(N1H)-G25(N1H); G, G7(N1H); H, G5(N1H).
As before, the phase-sensitive NOESY spectrum (220ms mixing time) of exchangeable protons in the (AP)2+3 duplex aids in the assignment of imino and amino protons of hydrogen bonded (hb) and exposed (ex) protons of the A•T and G•C base pairs. Two regions of interest are plotted for the expanded NOESY spectrum in Figure 5, where cross peaks represent through space connectivity between the imino protons of guanosine and thymidine, and cytidine amino and adenosine H2 protons, and in Figure 5, where cross peaks represent through space connectivity between imino protons on adjacent base pairs. In the (AP)2+3 duplex, base pairs flanking the lesion site are identified through their interaction with 3’ and 5’ neighboring bases in the symmetrical spectral region of the expanded NOESY spectrum (Figure 4). For one of these flanking bases the imino protons of G5 produces a cross peak with the G25 imino proton near 12.6 ppm, cross peak F in Figure 5, and is assigned to G5(H1N)-G5(N1H). The interaction between G5 imino and the C24 amino protons are fully resolved and assigned to signals F/F’ in Figure 5. At the other end of the AP segment, the imino protons of T10 and T18 produce a cross peak near 13.9 ppm, cross peak A in Figure 5, which is assigned to T10(N3H)-T18(N3H). For the T10•A19 base pair the imino proton of T10 and the H2 proton of A19 produce a strong signal which is assigned to cross peak D in Figure 5. The imino proton of the central base T8 is not resolved, however the imino proton signal from central base G7 produced a cross peak in the symmetrical region of the NOESY spectrum at 12.2 ppm, peak G in Figure 5, which is assigned to G7(N1H). In contrast to the (AP)2−3 duplex, the central G•C base pair is identifiable through weak cross peaks between the imino proton of G7 and the hydrogen bonded and exposed amino protons of C22, peak E/E’ in Figure 5. Watson-Crick base pair alignment is implied by the cross peak connectivity for the remaining canonical bases in the (AP)2+3 duplex and these cross peaks are assigned in Figure 5. Additional interactions between imino protons of adjacent and opposite canonical bases for the (AP)2+3 duplex are also assigned in Figure 5.
Thermal Stability
Figure 6 shows one-dimensional spectra collected at temperatures ranging from 5°–35° C. Both, the (AP)2−3 duplex and the (AP)2+3 duplex display similar melting behavior. The terminal bases of the (AP)2−3 duplex are not resolved even at low temperature, but the terminal bases of the (AP)2+3 duplex produce a partially resolved spectral line at 5° C. The spectral lines corresponding to imino proton resonances of the terminal bases of the (AP)2+3 duplex disappear at 20° C due to their fast water exchange. The central guanosine and cytidine residues between the lesion sites of both duplexes form Watson-Crick pairs as shown in the analysis of two-dimensional NOESY spectra, but with no detectable signal for the G8•C21 in the (AP)2−3 duplex, and only weak signals from G7•C22 in the (AP)2+3 duplex. In both duplexes, the central A•T base pair do not produce a resolved imino proton signal, which is indicative of fast exchange with protons from the solvent. In both duplexes imino proton signals from flanking thymidine residues, T5 in the (AP)2−3 duplex and T10 in the (AP)2+3 duplex, are shifted up field of the other thymidine signals. Similarly, the flanking guanosine imino protons G10 in the (AP)2−3 duplex, and G5 in the (AP)2+3 duplex, move up field relative to the remaining guanosine imino protons signals. Both duplexes show similar behavior during the transition from helix to random coil as the temperature is increased from 5°–35°C with the imino proton signals of flanking A•T and G•C pairs at the lesion site disappearing at the same rate as the internal base pairs (Figure 6). In fact, at the lesion site, flanking base pairs remain intact up to a temperature of 25°C. Further temperature increase caused the remaining imino proton resonances to broaden and disappear above 35° C due their rapid exchange with water.
Three-Dimensional Structure
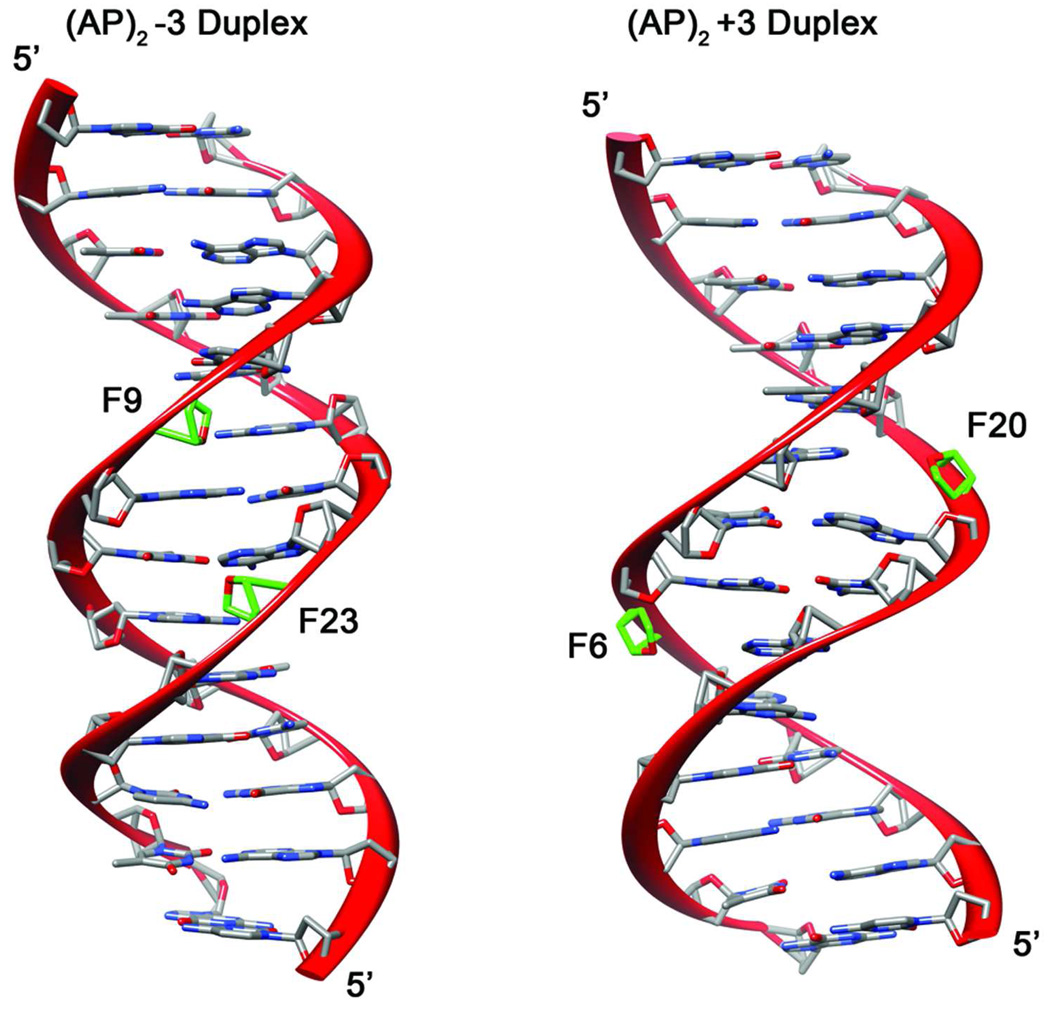
The averaged minimized structures for the (AP)2−3 duplex, and the (AP)2+3 duplex are shown in Figure 7 with the minor groove prominent. Both duplexes are regular right-handed helices showing well-formed Watson-Crick alignments on all undamaged base pairs including those between the abasic site residues. The AP residues are positioned in the minor groove of the helix resulting in a shorter distance between them in the (AP)2−3 duplex than in the (AP)2+3 duplex. The width and depth of the major and minor grooves are normal for both (AP)2 duplexes, including at the clustered lesion site.
Figure 7.
Ribbon representation (63, 64) of averaged minimized structures shown with the minor groove prominent. AP residues are colored green and labeled following Figure 1 numbering.
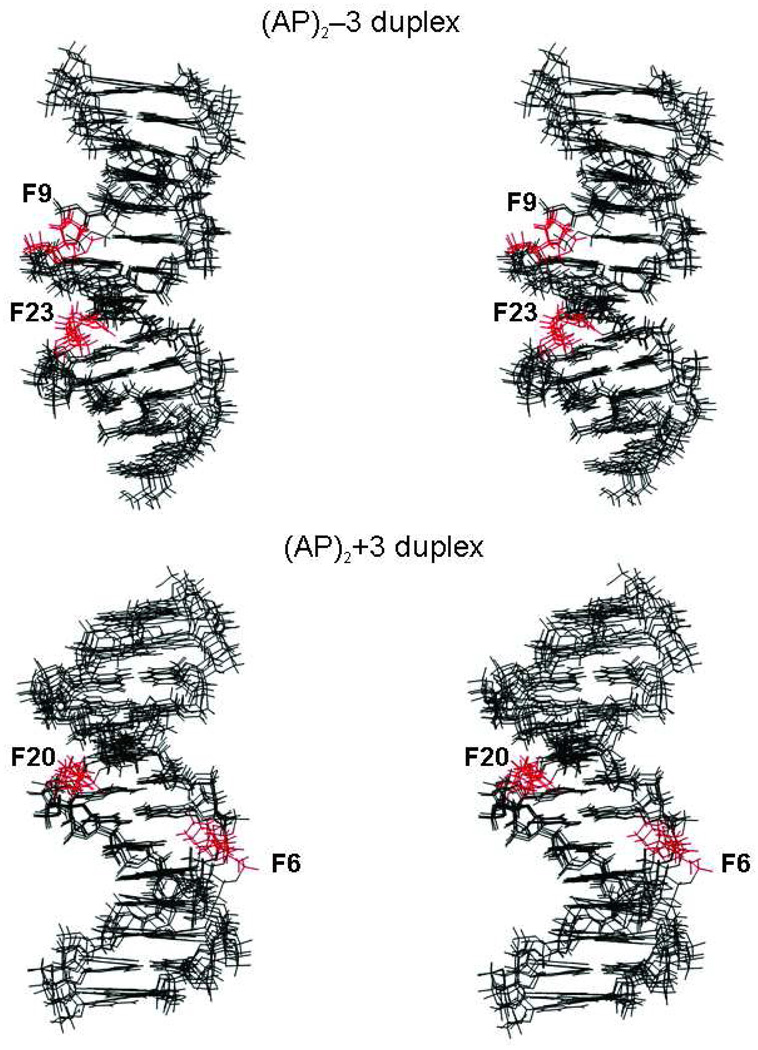
Table 1 summarizes statistics of the structural refinement showing the excellent agreement with the experimental interproton NOE distances without major violations of the covalent geometry and Table 2 lists relevant structural parameters measured for five representative models of each duplex. An overlapped stereo view of these models is shown in Figure 9. In both cases, the helices are regular, right handed and slightly shortened due to a bend in the helix in the direction of the major groove. Helix shortening, bend angle and bend direction are reported in Table 2. For the (AP)2−3 duplex, the AP residues are retained inside the helix with zero rotation leaving the backbone without distortion, as shown in Figures 7–9 and S5. Similarly for the (AP)2+3 duplex, both AP residues remain inside the helix leaving the backbones undistorted as shown in Figures 7–9 and S5, Supporting Information.
Table 1.
Molecular Refinement Statistics
| Violations of Covalent Geometry (rmsd) | (AP)2−3 duplex | (AP)2+3 duplex |
|---|---|---|
| Bond Lengths (Å) | 0.007 | 0.006 |
| Bond Angles (°) | 4.04 | 3.81 |
| Improper Angles (°) | 0.30 | 0.15 |
| Van der Waals (kcal/mol) | −420 | −416 |
| Violations of Experimental Restraints (rmsd) | ||
| Distance Violations (Å) (# of restraints) | 0.012 (533) | 0.007 (554) |
| Dihedral Angles (°) (# of restraints) | 0.20 (228) | 0.23 (228) |
Comparison of refined structures based on the rmsd deviations from experimental restraints and idealized covalent geometry.
Table 2.
Structural Parameters of (AP)2 Duplexesa.
| (AP)2−3 duplex | (AP)2+3 duplex | |
|---|---|---|
| Helix shortening (%) | 2.0 to 3.6 | 2.4 to 3.5 |
| Bend angle (°) | 15 to 34 | 26º to 33º |
| Bend direction | major groove | major groove |
| T7 or G7 X-disp(Å); Y-disp (Å); inclin (°) | −1.4; 0.2; 10.8 | −3.1; −0.2; 0.2º |
| A22 or C22 X-disp(Å); Y-disp (Å); inclin (°) | −1.5; 0.1; 7.2 | −2.5; −0.1; 0.0º |
| G8 or T8 X-disp(Å); Y-disp (Å); inclin (°) | −1.8; 0.3; 2.9 | −2.7; 0.1; −0.3º |
| C21or A21 X-disp(Å); Y-disp (Å); inclin (°) | −1.0; −0.1; −3.6 | −2.5; −0.2; 1.0º |
| Sugar Puckers | ||
| T7 or G7 | C2’-endo | C2’-endo |
| A22 or C22 | C2’-endo | C2’-endo |
| G8 or T8 | C2’-endo | C2’-endo |
| C21or A21 | C2’-endo | C2’-endo |
| F9 or F6 | C1’-exob | C2’-endoc |
| F23 or F20 | C2’-endo | C2’-endo |
Structural parameters computed using CURVES (53).
Average values measured from the converging refined structures.
Two structures appeared in the C2’-endo range.
One structure in the C1’-exo range.
In both duplexes, the AP residues are fully intra-helical exhibiting no rotation towards any of the duplex grooves.
Figure 9.
Cross-eye stereo representation (63, 64) of five overlapped final structures shown with the minor groove prominent in (AP)2−3 duplex and the major groove prominent in (AP)2+3 duplex. AP residues are colored red.
Close up stereo views of the lesion site structures are shown in Figure 8. There is no significant local disturbance of the base pairs at the lesion site in the (AP)2−3 duplex. Base inclination, X- and Y-displacement of the orphan purine bases A6 and A20 at the lesion site are shown in Table 2. In the (AP)2−3 duplex, both orphan bases undergo only small negative displacements and show small positive inclination such that they remain inside the helix (Figures 7–9 and S5, Supporting Information). Furthermore, the central G•C and A•T base pairs retain their proper Watson-Crick alignment. Similarly for the (AP)2+3 duplex, the inclination, X- and Y-displacement of residues A9 and A23 at the lesion site (listed in Table 2) are also small such that both orphan bases remain inside the helix. The central base pairs are undisturbed and remain in Watson-Crick alignment (Figures 7–9 and S5, Supporting Information).
Figure 8.
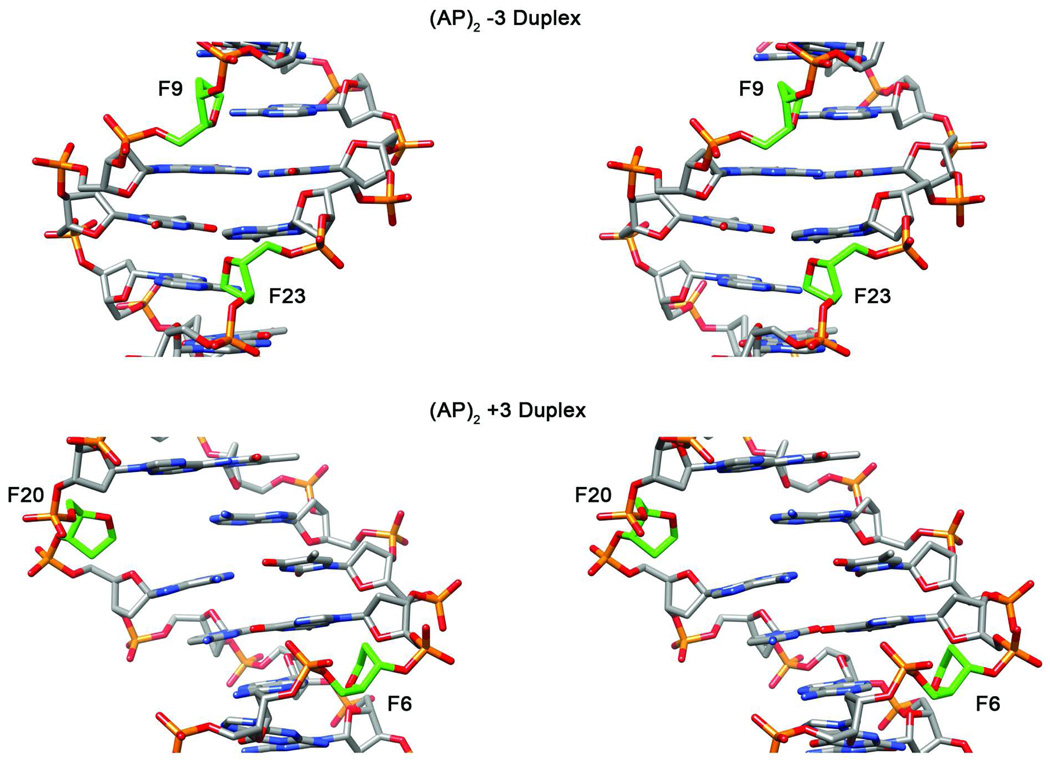
Expanded cross eye stereo view (63, 64) of the (AP)2−3 cluster seen with the minor groove prominent and the (AP)2+3 cluster seen with the major groove prominent, when the Watson-Crick alignments at the lesion site restraints are enforced during MD. AP residues are colored green. In the case of the (AP)2−3 duplex, the AP residues are closer across the minor groove while they are farther apart across the major groove in the (AP)2+3 duplex.
Sugar puckers for each duplex are also shown in Table 2. The (AP)2−3 duplex shows regular sugar pucker in the C2’-endo conformation at the lesion site and throughout the helix, while the (AP)2+3 duplex shows flexible sugar puckers with a variety of conformations at the lesion site and more regular conformations in the remainder of the duplex. In the (AP)2-3 duplex both AP residues and both orphan bases show sugar puckers in the C2’-endo conformation, with the exception of F9 adopting a C1’-exo conformation in two of the selected refined structures. The central bases show normal sugar pucker in the C2’-endo conformations. By contrast in the (AP)2+3 duplex, both AP residues adopt a normal C2’-endo conformation, with F6 adopting a C1’-exo conformation in only one of the four selected refined structures. The orphan bases show considerably more flexibility with the sugar pucker of A23 and that of A9 in the C1’-exo conformation in one of the selected structures. The central bases adopt a C2’-endo conformation.
DISCUSSION
NMR Spectra and Solution Structures of (AP)2 Duplexes
The directionality of the NOE cross peaks between base and sugar protons as well as cross peaks present in the NOESY spectra in H2O indicating hydrogen bonded imino protons confirm that both helices are right handed and stabilized by regular Watson-Crick base pair alignments (17–19). The connectivity in the finger print region of the NOESY spectra for both duplexes shows a continuous walk along each strand with gaps (indicated by arrows A, B, C and D in Figures 2A and 2B) at the location of the AP residues, establishing that the helixes are not significantly compressed at the lesion sites. Thus, residues flanking the AP sites are kept apart, while the orphan bases are stacked inside the helix. The internal stacking of orphan bases is confirmed by cross peak connectivity with both residues flanking the orphan bases (Figures S1 and S2 in Supplementary material). The H2O NOESY spectra and thermal stability measurements indicate that all hydrogen bonds in both duplexes remain intact at low temperature and they melt with similar rates as the temperature increases.
Table 2 shows that, after molecular dynamics simulation, both helixes are compressed by only about 3%, which is most likely due to the presence of a mild bend in the final structures. Table 2 also shows that there is similar bend in both duplexes, which may be attributed to normal flexibility of the helix, with the tilt and inclination of the lesion site residues being negligibly small. The main difference between the duplexes emerges only after restrained molecular dynamics simulations to produce structures that are in agreement with the NMR spectra. These structures show that the AP residues are positioned differently with respect to the major and minor grooves of the helix (Figures 7, 8 and 9). The refined structures, shown in stereo in Figures 8 and 9, reveal that the AP residues appear closer in space across the minor groove in the (AP)2−3 duplex but are farther apart across the major groove in the (AP)2+3 duplex, a situation reminiscent of previously solved structures of (AP)2−1 and (AP)2+1 duplexes (8).
Comparison of Structures and the Orientation Effect
Both AP residues on the (AP)2−3 and (AP)2+3 duplexes are inside the helix, a fact that differentiate them from (AP)2−1 and (AP)2+1 duplexes in which the AP residues sometimes form a bulge. However, the AP residues in the current study are dynamic in solution and likely to swing in and out of the helix at room temperature. Thus, these solution structures represent the average position of the AP residues which are intra helical in the (AP)2−3 and (AP)2+3 duplexes but can be extra helical in the (AP)2−1 duplex and aligned with the backbone in (AP)2+1 duplex (8). In studies of duplexes containing an extra adenosine, both the AP residue and the opposing adenosine were found to stack inside the helix with local perturbation of the helix extending only to the immediate flanking bases (27–29). In studies where an opposing pyrimidine residue was inserted into the duplex, the AP residue and its counter base could be extra or intra helical depending on temperature (13, 27, 30–32). The intra helical character of lesion site residues in the both the (AP)2−3 and (AP)2+3 duplexes makes it unlikely that the differential recognition of these lesions would be based on the intra helical position of the AP residues.
A second important feature of these structures is that the AP residues are closer in space across the minor groove in the (AP)2−3 duplex, while they are located farther apart in the (AP)2+3 duplex. This is similar to the structures of the (AP)2−1 and (AP)2+1 duplexes where the AP residues are located on the minor groove in the former duplex and on opposite sides of the major groove in the latter duplex. This factor may play a role in the differential recognition of these lesions since it was found that both AP sites in the +1 and +3 orientations are cleaved by hApe1 (8), thus potentially producing lethal DSBs. The structures of the (AP)2+1 and (AP)2+3 duplex are similar and thus consistent with the observed cleavage of both AP residues. The cleavage inhibition observed −1 and −3 clusters may relate to the fact that the sites AP are closer in space across the minor groove, hindering key interaction with the enzyme.
Three-dimensional structures of free hApe1 in solution or in a complex with AP-containing DNA have been established. hApe1 shows a barrel-like conformation in solution having a preformed active site pocket and a positively charged surface that facilitates binding to the damaged DNA (33–34). Upon DNA binding, the protein conformation changes very little but the enzyme induces a kink on the helical axis of the duplex and make extensive contacts with its damaged strand at either side of the AP residue. Contacts with the unmodified strand are sparse, involving electrostatic interactions with three consecutive phosphate groups at the 5’ side of the abasic site. Since an identical set of enzyme-phosphate contacts are possible for both the (AP)2−3 and (AP)2+3 duplexes, or the (AP)2−1 and (AP)2+1 duplexes for this matter, the X-ray structure of the complex does no provide a definitive answer to the question of why differential recognition occurs (35). It is possible that the structural differences among clustered (AP)2 duplexes are sensed during an initial recognition step, which would be sensitive to the proximity of a second AP site across the minor groove of the duplex. Alternatively, it is conceivable that the second AP site on the non-scissile strand of the duplex would increase backbone flexibility hindering hApe1-phosphate contacts only on the case of the (−1) and (−3) 3’-staggered clusters.
CONCLUSIONS
Through oxidative damage ionizing radiation produces clustered DNA damage, of which clustered abasic sites are quite prevalent. They can be mutagenic if not repaired or become a source of potentially lethal double strand breaks during the repair process. Abortive repair of bistranded AP clusters are particularly prone to produce double strand breaks, a phenomenon that is exploited in radiation therapy and chemotherapy. However, the orientation of bistranded lesions factors significantly in the efficiency with which they are removed from DNA, a fact attributed to differential recognition of these lesions by the repair machinery. We have solved the structures of (AP)2−3 and (AP)2+3 bistranded duplexes and shown that they are structurally similar to the previously solved (AP)2−1 and (AP)2+1 duplexes in that the AP residues are located close in space across the minor groove in the (AP)2−3 and (AP)2−1 duplexes but are farther apart in the (AP)2+3 and (AP)2+1 duplexes. The structures of (AP)2 duplexes show the common factor of closeness in space of the AP residues that are not cleaved by hApe1 enzyme. Factors such as the thermodynamic stability of the damaged duplexes or the position the AP residues in an extra helical bulge do not correlate with the differential recognition of these DNA lesions. The fact that hApe1 (or bacterial exo-III) readily processes (+1) and (+3) (AP)2 bistranded lesions while cleavage of (−1) and (−3) clusters proceeds at very slow rates, would suggest that the repair of clustered AP lesions has evolved to fundamentally avoid the presence of DSB with 3’ protruding ends.
Supplementary Material
ACKNOWLEDGEMENTS
We want to thank Mr. Erich Bremer for providing computer support services and help in the creation of figures, and Ms. Cecilia Torres for the synthesis and purification of modified oligodeoxynucleotides. Molecular graphics images were produced using the MidasPlus program from the Computer Graphics Laboratory, UCSF (supported by NIH RR-01081).
Footnotes
SUPPORTING INFORMATION AVAILABLE
Proton chemical shifts of the (AP)2−3 and (AP)2+3 duplexes (Tables S1 and S2); Counter plots of NOESY spectra (300 ms mixing time) depicting base-H1’ proton connectivities for the (AP)2−3 and (AP)2+3 duplexes (Figures S1 and S2); counter plots of the same NOESY spectra showing interactions among protons of the furan residues in the (AP)2−3 and (AP)2+3 duplexes (Figures S3 and S4); Space filling representations of the (AP)2−3 and (AP)2+3 duplex structures (Figure S5). This material is available free of charge at http://pubs.acs.org.
REFERENCES
- 1.Ward JF. DNA Damage Produced by Ionizing Radiation in Mammalian Cells: Identities, Mechanisms of Formation and Reparability. Prog. Nucleic Acids Res. Mol. Bio. 1998;35:95–125. doi: 10.1016/s0079-6603(08)60611-x. [DOI] [PubMed] [Google Scholar]
- 2.Halliwell B, Aruoma OI. DNA damage by oxygen derived species: Its mechanism and measurement in mammalian systems. FEBS Let. 1991;281:9–19. doi: 10.1016/0014-5793(91)80347-6. [DOI] [PubMed] [Google Scholar]
- 3.Newcomb TG, Loeb LA. Oxidative Damage and Mutagenesis,in DNA Damage and Repair Vol 1: DNA Repair in Higher Eukaryotes. Vol. 1. Totowa, NJ: Humana Press Inc.; 2001. [Google Scholar]
- 4.Sutherland BM, Bennett PV, Sidorkina O, Lavall J. Clustered Damages and Total Lesions Induced in DNA by Ionizing Radiation: Oxidized Bases and Strand Breaks. Biochemistry. 2000;39 doi: 10.1021/bi9927989. [DOI] [PubMed] [Google Scholar]
- 5.Sutherland BM, Bennett PV, Sidorkina O, Lavall J. Clustered Damages induced in isolated DNA and human cells by low doses of ionizing radiation. PNAS. 2000;97:103–108. doi: 10.1073/pnas.97.1.103. [DOI] [PMC free article] [PubMed] [Google Scholar]
- 6.Weinfeld M, Rasouli-Nia A, Chaudhury MA, Britten RA. Response of Base Excision Repair Enzymes to Complex DNA Lesions. Radiat. Res. 2001;156:584–589. doi: 10.1667/0033-7587(2001)156[0584:robere]2.0.co;2. [DOI] [PubMed] [Google Scholar]
- 7.David-Cordonnier M-H, Cunniffe SMT, Hickson ID, O’Neill P. Efficiency of Incision of an AP Site within Clustered DNA Damage by the Major Human AP Endonucleases. Biochemistry. 2002;41:634–642. doi: 10.1021/bi011682l. [DOI] [PubMed] [Google Scholar]
- 8.Hazel RD, Tien K, de los Santos C. NMR Solution Structures of Bistranded Abasic Site Lesions in DNA. Biochemistry. 2008;47:11909–11919. doi: 10.1021/bi800950t. [DOI] [PMC free article] [PubMed] [Google Scholar]
- 9.Georgakilas AG, Bennet PV, Wilson DM, III, Sutherland BM. Processing of bistranded abasic DNA clusters in γ-irradiated human hematopoetic cells. Nucleic Acids Res. 2004;32:5609–5620. doi: 10.1093/nar/gkh871. [DOI] [PMC free article] [PubMed] [Google Scholar]
- 10.Chaudhury M, AaW M. Reactivity of Human Apurinic/Apyrimidinic Endonuclease and Escherichia coli Exonuclease III with Bistranded Abasic Sites in DNA. J. Biol. Chem. 1997;272:15650–15655. doi: 10.1074/jbc.272.25.15650. [DOI] [PubMed] [Google Scholar]
- 11.Chaudhury M, AaW M. The Action of Escherichia coli Endonuclease III on Multiply Damaged Sites in DNA. J. Mol. Biol. 1995;249:914–922. doi: 10.1006/jmbi.1995.0348. [DOI] [PubMed] [Google Scholar]
- 12.Harrison L, Hatahet Z, Wallace SS. In virto Repair of Synthetic Ionizing Radiation-induced Multiply Damaged DNA Sites. J. Mol. Biol. 1999;290:667–684. doi: 10.1006/jmbi.1999.2892. [DOI] [PubMed] [Google Scholar]
- 13.Lin Z, de los Santos C. NMR Characterization of Clustered Bistrand Abasic Site Lesions: Effect of Orientation on their Solution Structure. J. Mol. Biol. 2001;308:341–352. doi: 10.1006/jmbi.2001.4587. [DOI] [PubMed] [Google Scholar]
- 14.Takeshita M, Chang C-N, Johnson F, Will S, Grollman AP. Oligodeoxynucleotides Containing Synthetic Abasic Sites: Model substrates for DNA polymerases and apurinic/apyrimidinic endonucleases. J. Biol. Chem. 1987;262:10171–10179. [PubMed] [Google Scholar]
- 15.States DJ, Haberkorn RA, Ruben DJ. A two-dimensional nuclear Overhauser experiment with pure absorption phase in four quadrants. J. Magn. Res. 1982;48:286–292. [Google Scholar]
- 16.Plateau P, Gueron M. Exchangeable proton NMR without baseline distortion, using new strong-pulse sequences. J. Am. Chem. Soc. 1982;104:7310–7311. [Google Scholar]
- 17.van de Ven FJ, Hilbers CW. Nucleic acids and nuclear magnetic resonance. Eur. J. Biochem. 1988;178:1–38. doi: 10.1111/j.1432-1033.1988.tb14425.x. [DOI] [PubMed] [Google Scholar]
- 18.de los Santos C. Probing DNA structure by NMR Spectroscopy, in Comprehensive Natural Products Chemistry, Vol. 7: DNA and Aspects of Molecular Biology. Oxford, UK: Elsevier Science Ltd.; 1999. [Google Scholar]
- 19.Hare DR, Wemmer DE, Chou SH, Drobny G, Reid B. Assignment of the non-exchangeable proton resonances of d(C-G-C-G-A-A-T-T-C-G-C-G) using two-dimensional nuclear magnetic resonance methods. J. Mol. Biol. 1983;171:319–336. doi: 10.1016/0022-2836(83)90096-7. [DOI] [PubMed] [Google Scholar]
- 20.Brunger A. X-PLOR Version 3.1 A System for X-ray Crystallography and NMR. New Haven, CT: Yale University Press; 1993. [Google Scholar]
- 21.Lavery R, Sklenar H. The definition of generalized helicoidal parameters and axis of curvature for irregular nucleic acids. J. Biomol. Struct. Dyn. 1988;6:63–91. doi: 10.1080/07391102.1988.10506483. [DOI] [PubMed] [Google Scholar]
- 22.Lavery R, Sklenar H. Defining the structure of irregular nucleic acids: conventions and principles. J. Biomol. Struct. Dyn. 1989;6:655–667. doi: 10.1080/07391102.1989.10507728. [DOI] [PubMed] [Google Scholar]
- 23.Brooks B, Bruccoleri R, Olafson B, States D, Swaminathan S, Karplus M. CHARMM: a program for macromolecular energy, minimization, and dynamics calculations. J. Comp. Chem. 1983;4:187–217. [Google Scholar]
- 24.Rinkel LJ, Altona C. Conformational analysis of deoxyrybofuranos ring in DNA by means of sums of proton-proton coupling constants: a graphical method. J. Biomol. Struct. Dyn. 1987;4:621–649. doi: 10.1080/07391102.1987.10507665. [DOI] [PubMed] [Google Scholar]
- 25.Majumdar A, Hosur RV. Simulation of 2D NMR spectra for determination of solution conformations of nucleic acids. Prog. NMR Spectrosc. 1992;24:109–158. [Google Scholar]
- 26.Ryckert J-P, Ciccoti G, Berendsen HJC. Numerical integration of Cartesian equations of motion of a system with constraints-molecular-dynamics of N-alkanes. J. Comput. Phys. 1977;23 [Google Scholar]
- 27.Beger RD, Bolton PH. Structures of Apurinic and Apyrimidinic Sites in Duplex DNAs. J. Biol. Chem. 1998;273:1565–1573. doi: 10.1074/jbc.273.25.15565. [DOI] [PubMed] [Google Scholar]
- 28.Wang KY, Parker SA, Goljer I, Bolton PH. Solution Structure of a Duplex DNA with an Abasic Site in a dA Tract. Biochemistry. 1997;36:11629–11639. doi: 10.1021/bi971464l. [DOI] [PubMed] [Google Scholar]
- 29.Kalnik MW, Norman DG, Zagorski MG, Swann PF, Patel DJ. Conformational Transitions in Cytidine Bulge-Containing Deoxytridecanucleotide Duplexes: Extra Cytidine Equilibrates between Looped Out (Low Temperature) and Stacked (Elevated Temperature) Conformations in Solution. Biochemistry. 1989;28:294–303. doi: 10.1021/bi00427a040. [DOI] [PubMed] [Google Scholar]
- 30.Cuniasse P, Sowers LC, Eritja R, Kaplan B, Goodman MF, Cognet JA, LeBert M, Guschlbauer W, Fazakerley GV. An abasic site in DNA. Solution conformation determined by proton NMR and molecular mechanics calculations. Nucleic Acids Res. 1987;15:8003–8022. doi: 10.1093/nar/15.19.8003. [DOI] [PMC free article] [PubMed] [Google Scholar]
- 31.Kalnik MW, Chang C-N, Johnson F, Grollman AP, Patel DJ. NMR Studies of Abasic Sites in DNA Duplexes: Deoxyadenosine Stacks into the Helix Opposite Acyclic Lesions. Biochemistry. 1989;28:3373–3383. doi: 10.1021/bi00434a037. [DOI] [PubMed] [Google Scholar]
- 32.Kalnik MW, Chang C-N, Grollman AP, Patel DJ. NMR Studies of Abasic Sites in DNA Duplexes: Deoxyadenosine Stacks into the Helix Opposite Cyclic Analogue of 2-Deoxyribose. Biochemistry. 1988;27:924–931. doi: 10.1021/bi00403a013. [DOI] [PubMed] [Google Scholar]
- 33.Gorman MA, Morera S, Rothwell DG, de La Fortelle E, Mol CD, Tainer JA, Hickson ID, Freemont PS. The crystal structure of the human DNA repair endonuclease HAPE1 suggests the recognition of extra-helical deoxyribose at DNA abasic sites. EMBO J. 1997;16:6548–6558. doi: 10.1093/emboj/16.21.6548. [DOI] [PMC free article] [PubMed] [Google Scholar]
- 34.Beernink PT, Segelke BW, Hadi MZ, Erzberger JP, Wilson DM, III, Rupp B. Two Divalent Metal Ions in the Active Site of a New Crystal Form of Human purinic/Apyrimidinic Endonuclease, Ape1: Implications for the Catalytic Mechanism. J Mol Biol. 2001;307:1023–1034. doi: 10.1006/jmbi.2001.4529. [DOI] [PubMed] [Google Scholar]
- 35.Clifford D. Mol CD, Izumi T, Mitra S, Tainer JA. DNA-bound structures and mutants reveal abasic DNA binding by APE1 DNA repair and coordination. Nature. 2000;403:451–456. doi: 10.1038/35000249. [DOI] [PubMed] [Google Scholar]
Associated Data
This section collects any data citations, data availability statements, or supplementary materials included in this article.


