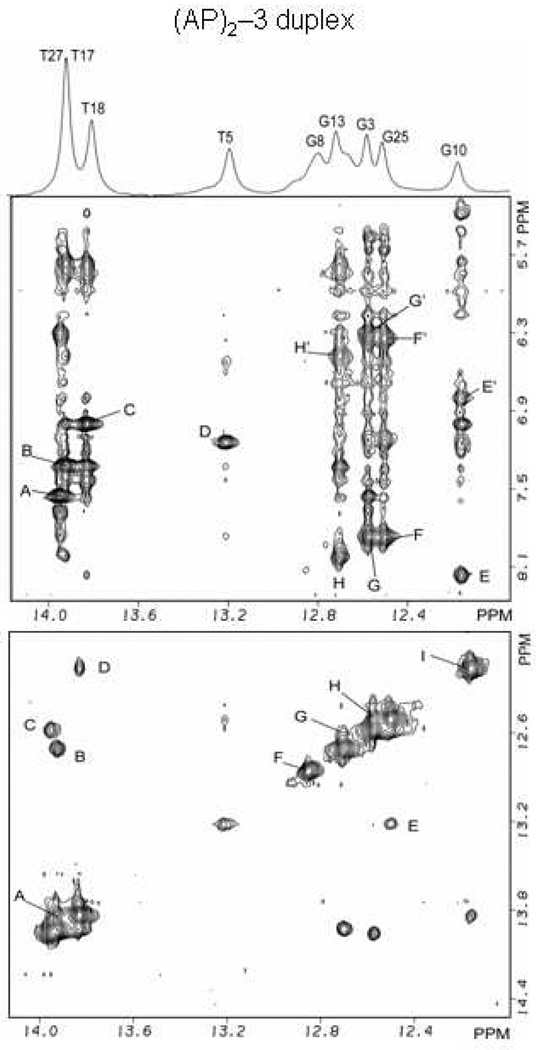
Figure 4.
(AP)2−3 duplex:- expanded phase sensitive NOESY (220ms mixing time) contour plot for the (AP)2−3 duplex in H2O buffer containing 50mM NaCl, 10mM phosphate and 1.0mM EDTA at pH 6.8 at a temperature of 5° C. (Figure 4) Cross peaks establishing connectivity between imino protons (12.0–14.0 ppm) and the base and amino protons (8.4-5.0 ppm) have been plotted. Peaks A–H/H’ in the (AP)2−3 duplex are discussed in the text and are assigned as follows: A, T27(N3H)-A2(H2); B, T17(N3H)-A12(H2); C, T18(N3H)-A11(H2); D, T5(N3H)-A24(H2); E/E’, G10(N1H)-C19(N4Hhb)/C19(N4Hex); F/F’, G25(N1H)-C4(N4Hhb)/C4(N4Hex); G/G’, G3(N1H)-C26(N4Hhb)/C26(N4Hex); H/H’, G13(N1H)-C16(N4Hhb)/C16(N4Hex. (Figure 4) Cross peak connectivity between imino protons in the symmetrical (12.0–14.0 ppm) spectral range are discussed in the text. Cross peaks at the lesion site show the existence of Watson-Crick hydrogen bonds and regular base stacking throughout the (AP)2−3 duplex. Cross peaks A-I in the (AP)2−3 duplex are assigned as follows: A, T17(N3H)-T18(N3H); B, T17(N3H)-G13(N1H); C, T27(N3H)-G3(N1H); D, T8(N3H)-G10(N1H); E, G25(N1H)-T5(N3H); F, G8(N1H); G, G13(N1H)-G15(N1H); H, G3(N1H)-G25(N1H); I, G10(N1H).

