

Abstract
The human retina is a uniquely accessible tissue. Tools like scanning laser ophthalmoscopy (SLO) and spectral domain optical coherence tomography (SD-OCT) provide clinicians with remarkably clear pictures of the living retina. While the anterior optics of the eye permit such non-invasive visualization of the retina and associated pathology, these same optics induce significant aberrations that in most cases obviate cellular-resolution imaging. Adaptive optics (AO) imaging systems use active optical elements to compensate for aberrations in the optical path between the object and the camera. Applied to the human eye, AO allows direct visualization of individual rod and cone photoreceptor cells, RPE cells, and white blood cells. AO imaging has changed the way vision scientists and ophthalmologists see the retina, helping to clarify our understanding of retinal structure, function, and the etiology of various retinal pathologies. Here we review some of the advances made possible with AO imaging of the human retina, and discuss applications and future prospects for clinical imaging.
Keywords: imaging, adaptive optics, retina, pathology, photoreceptors
Principles of Adaptive Optics (AO)
Numerous technical reviews of AO are available,1,2 so we briefly review the principle of adaptive optics as it applies to retinal imaging. AO retinal imaging systems have three principal components – a wavefront sensor, corrective element, and control system (Figure 1). The wavefront sensor is used to measure the structure of the aberrations of the eye, with the Shack-Hartmann design being the most commonly used type. It consists of an array of lenslets, where each lenslet samples a local portion of the incident wavefront and focuses this light on a charge-coupled device (CCD). The displacement of any given spot from its intended position is directly related to the slope and amplitude of the wavefront in that portion of the pupil. The corrective element (the “adaptive” optical element) is used to compensate for these aberrations, most commonly by using a deformable mirror, which relies on a series of actuators to deflect the mirror surface. There are many types of deformable mirrors in use in AO retinal imaging systems. Some systems now employ multiple corrective elements, with one handling high amplitude low-order aberrations (i.e., defocus & astigmatism) and the second dealing with the higher-order aberrations.3–6 The third main component, a software system, controls the interaction between the wavefront sensor and the corrective element(s). An active area of research is designing robust control algorithms that optimize speed, sensitivity, and precision of the wavefront correction.5,7,8
Figure 1.
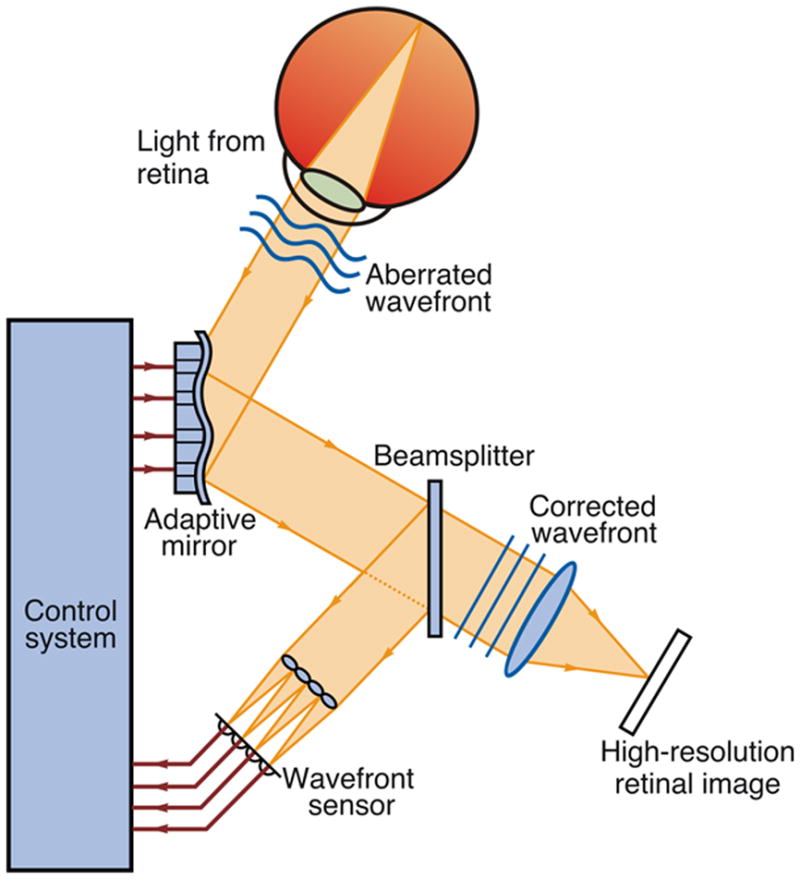
Schematic of an AO retinal imaging system. A beam of light is shined into the eye, and a small amount is reflected back out of the eye and into the optical system. Reflected light is split between a wavefront sensor, which measure the aberrations, and the image capturing device. Information about the aberrations of the wavefront, as measured by the wavefront sensor, is processed by a control system. The control system sends a signal to an active optical component, causing a shape change, which minimizes the wavefront aberration. Modified from Carroll et al. (2005), with permission.100 A color version of this figure is available online at www.opvissci.com.
Adaptive Optics Retinal Imaging Systems
AO by itself does not provide a retinal image, rather an AO subsystem must be incorporated into an existing imaging device. In recent years AO has been successfully integrated with the three primary ophthalmic imaging devices (conventional fundus camera, SLO, and SD-OCT), with each offering different benefits. We briefly discuss below each of these applications of AO.
Adaptive Optics Fundus Camera
About 15 years ago, the first AO fundus camera was developed in David Williams’ lab at the University of Rochester. Using a krypton arc flashlamp to illuminate the retina and a Xinetics deformable mirror to correct for ocular aberrations, this system has been used to examine features of the cone mosaic such as cone spacing,9,10 cone directionality, 11 temporal fluctuations in cone reflectance,12 and the locus of fixation.13 Advantages of this design include the use of an incoherent light source (eliminating speckle) and brief imaging exposures (mitigating the impact of natural eye movements). A major disadvantage of this design was that images had to be collected one at a time, and the effective frame rate was limited by the recharge time of the flashlamp. This was remedied in a newer system developed at Indiana University, using a superluminescent diode (SLD) for the imaging light source and a high-speed (167 frames per second) CCD to collect the retinal images.14
Adaptive Optics Scanning Laser Ophthalmoscope (AOSLO)
An SLO creates a retinal image over time by recording scattered light from a focused beam as it is scanned across the retina. By continuous scanning of the retina in a raster fashion it is possible to sample large areas at a faster rate than conventional flash fundus imaging.15 Confocality is a major advantage of AOSLO; light not originating from the focal plane of the retina is excluded through the use of a pinhole conjugate to the retinal focal plane, thus increasing the contrast of the final image. Lateral and axial resolution of the AOSLO can be modified by changing the pinhole size of the system. For example, when optimizing the confocal pinhole, the lateral and axial resolutions for a 6mm pupil and 600 nm light are 1.9 μm and 33 μm, respectively.16,17 The confocal nature permits axial sectioning of the retina and visualization of different layers of the retina, such as the nerve fibers, blood vessels, and photoreceptors with a precision that is considerably enhanced by the AO component. 18 The applications of AOSLO are numerous and include high-resolution imaging, eye tracking, laser modulation for stimulus delivery, multichannel imaging, and stabilized stimulus delivery for psychophysics and electrophysiology. These applications have recently been reviewed by Roorda (2010),17 and thus are not reviewed extensively herein.
Adaptive Optics Optical Coherence Tomography (AO-OCT)
Optical coherence tomography was first demonstrated as a retinal imaging tool in 1991 19 and its use in ophthalmology has increased dramatically since that time. This was due to rapid commercialization of the first time domain system and more recently to the simultaneous deployment of spectral domain technology by a number of companies. Unlike SLO, the axial and lateral resolution of OCT are decoupled. Axial resolution is limited theoretically by the coherence properties of the imaging light source, such that the broader the bandwidth of the light source is, the better the resolution. However, as the central wavelength is increased, significantly broader bandwidth is needed for the same axial OCT resolution as for shorter central wavelengths.20 There is a tradeoff in that the human eye suffers from significant longitudinal chromatic aberration (different wavelengths focus at different planes), such that the full benefit of increasing the bandwidth of the imaging source is not realized without correction of longitudinal chromatic aberration.21,22 Lateral resolution is limited by the focal spot size, which is significantly degraded due to the eye’ s aberrations. Here, AO can be used to compensate for the eye’ s monochromatic aberrations, thus improving the lateral resolution and sensitivity of the OCT system.23–25 Such systems are capable of resolving individual photoreceptors in 3 dimensions.22,25–27 Recently, 3D visualization of the nerve fiber layer, ganglion cells, and lamina cribrosa as well as the RPE mosaic and choriocapillaris was demonstrated using high-speed AO-OCT (120,000 scans/second).28 It should be noted that SD-OCT without adaptive optics has been shown to be able to acquire images of the peripheral cone photoreceptor mosaic.29 Imaging closer to the foveal center was made possible with extremely high scan rates (300,000 A-scans/sec), which virtually eliminates image distortion due to intrascan retinal motion.30
Applications
While AO retinal imaging started with vision science applications, these have translated into clinical applications that are rapidly expanding. Before discussing the clinical future of AO, it is worth revisiting some of the breakthroughs in vision science made possible by the use of AO technology.
Imaging the Cone Photoreceptor Mosaic
Owing to their unique waveguiding properties, cone photoreceptors served as relatively easy targets for initial imaging applications and have remained so. Despite being the focus of many groups over the years, there remains much to learn about the imaging properties of cones. The first images of the cone mosaic obtained with adaptive optics were published in 1996, using a conventional fundus camera equipped with adaptive optics,9 while the first AO-SLO images of the cone mosaic were published in 2002.15 Initial imaging efforts focused simply on analyzing the spatial density of the cone mosaic; however other optical properties of the cones have been assessed with adaptive optics imaging. For example, researchers were also able to measure the directional tuning of individual cones, revealing that cones are not randomly aligned, but tightly clustered pointing towards the pupil center with little variability within an eye.11 Multiple groups have established normative data,31,32 which is required when trying to measure and assess cone mosaic disruption in diseased eyes.
The first use of AO to address a fundamental biological question was made by Roorda and Williams.33 While the presence of three different cone types in the human retina was known (short- (S-), middle- (M-) and long-wavelength sensitive (L-)), their topographical arrangement was unclear. By combining retinal densitometry with AO imaging, Roorda and Williams were able to infer the spectral identity of individual cone photoreceptors.33 Despite different relative numbers of L and M cones (L:M cone ratio), the two subjects imaged in this study had normal color vision.34,35 Hofer and colleagues studied several additional subjects with the same technique, which revealed even further variation in the ratio of L to M cones.36 Remarkably, despite the 40-fold variation in L:M cone ratio, all subjects demonstrated normal color discrimination.36
Functional Adaptive Optics Imaging
Considerable effort is underway to uncover the physiological or optical origins of spatial and temporal variability in cone reflectance, as this may have diagnostic potential.14,37–39 High-speed AO fundus cameras have been used to study the temporal dynamics of cone reflectance. The first studies on the topic looked at changes over the duration of a day.40 Later groups demonstrated that fluctuations also take place on a much shorter time scale using different coherence length light sources.14,37 A follow-up study showed that after exposure to a visible stimulus, a short coherence length imaging source reveals light-evoked oscillation signals in a large number of cones.38 The application of light-evoked signal detection techniques for in vivo retinal imaging may prove useful for assessing the functional status of cones in normal and diseased retinas.41–43 Observed changes in reflectivity may be caused by molecular changes within the cones that are due to phototransduction. Another hypothesis, based on data acquired using long coherence length light, suggests reflectance variation is based on cone outer segment length.39 The hypothesis is that the cone outer segment acts like a “biological interferometer”, allowing precise measurement of OS length in vivo, and that fluctuations in reflectivity are due to changes in OS length, related to disk shedding. This is an active area of research, and such an assay of cone function could prove highly useful in clinical applications.38,39
Rod Photoreceptor Imaging
While cones have proved relatively easy to image, rod photoreceptors have evaded routine detection. Rods have been shown to be less effective waveguides than cones.44–46 This fact, combined with their small diameter (~2 microns),47 likely accounts for the lack of widespread rod imaging. Using an AO fundus camera, successful imaging of the normal retina at 15–20° from fixation demonstrated a continuous cone mosaic with numerous rods intermingled throughout the image.48 While this group used deconvolution to clarify cellular structures, they were also visible in unprocessed images. Using the same imaging system, the retina of a patient with rod monochromacy, a congenital vision disorder in which cone function is absent or severely diminished, was imaged, demonstrating a severely disrupted photoreceptor mosaic and visible cells whose size and density were typical of rod, not cone, photoreceptors.49 There were intermittent gaps in the mosaic that were thought to be nonfunctional and structurally compromised cone photoreceptors. At this point, these are the few reported cases of rod photoreceptor imaging; however, due to their involvement in retinal diseases like retinitis pigmentosa, more robust techniques for imaging rods are needed.
Retinal Pigment Epithelium
The retinal pigment epithelium (RPE) provides vital support to the photoreceptors and as such, RPE dysfunction has been implicated in many retinal diseases, including Leber Congential Amaurosis, Stargardt Disease, AMD, and Best Macular Dystrophy. Three different approaches using two adaptive optics modalities have been used to image the RPE mosaic in living human eyes. The RPE mosaic was first visualized in areas of retina that were devoid of photoreceptors50 (see another example in Figure 5). Several patients with retinal degenerative disorders showed cells consistent with histological literature values for RPE cell shape, size and distribution in areas that showed loss of visual function with microperimetry. The RPE mosaic was first visualized in the normal retina by taking advantage of dual acquisition methods.51 The information from the registration of the reflectance images, which contain high contrast images of the cone photoreceptors, was used to register frames of the low intrinsic autofluorescence of RPE cells. RPE cells were excited with 568 nm light and emission was detected over 40 nm centered around 624 nm. This study also looked at the repeatability of these measurements, by finding the same distribution of cells when imaging was repeated several weeks later. A third study used AO-OCT to visualize the RPE mosaic in normal eyes, though it was not possible to obtain these images in every eye examined.28 Using this imaging technique, the RPE cell mosaic was identified and quantified by looking through en face slices of the retina. Cellular components such as the RPE cell soma and nuclei were also identifiable.
Figure 5.

Image from a patient with autosomal dominant RP. The background is an infra-red SLO image from the Heidelberg Spectralis. The line indicates the location of the SD-OCT scan, which goes through fixation. The SD-OCT scan shows that photoreceptors are preserved in the central macula only with attenuation of outer retinal layers beginning about 6 degrees eccentric to fixation, and also reveals the presence of mild cystoid macular edema, or CME. A reduced-scale AOSLO montage is aligned and superimposed on the background image. The insets are full scale-sections of the AOSLO montage at two locations indicated by the black squares. The left inset is from the advancing front of degeneration, and RPE cells are clearly seen as a polygonal network of cells comprising the left half of the image. Some irregularly distributed cones are still visible on the right side of the image, albeit at a lower density than normal. The right inset is of the foveal region. Small white squares indicate the locus of fixation. Cones are resolved across most of the field, and are lower density than would be found in a normal eye. The dark lines and shadows in the inset do not indicate where cones are lost, but rather are formed by capillaries and the boundaries of the cystic spaces. It is presumed that preserved and functioning cones are likely to be present beneath these shadows, although cones are not clearly seen. Scale bar for the inset is 1 degree.
Retinal Vasculature
Due to its high-magnification, resolution, and real time visualization it is possible to observe individual leukocytes moving through small blood vessels in the retina using an AOSLO. Such images permit imaging of parafoveal capillary leukocyte movement and measurement of leukocyte velocity without contrast dyes.15 Leukocyte velocity was measured directly from movie segments in which the leukocytes were clearly visible.52 A follow up study investigated the possible role of the cardiac cycle on capillary leukocyte velocity by directly measuring capillary leukocyte pulsatility.53 Using the information encoded by the moving leukocytes, researchers employed differential registration to enhance the motion contrast. In this process the average intensity of the pixels at a given location is averaged and the standard deviation is calculated and displayed. Areas with motion will have a higher standard deviation, due to the reflectance changes with passing blood cells, while areas without motion will have lower standard deviations. By depicting these localized high and low standard deviation differences, even the finest blood vessels become apparent, and montaging several images together allows construction of a map of the retinal vasculature in the absence of contrast agents.54 In this study the parafoveal capillaries were clearly visible, and were used to measure the size of the foveal avascular zone (FAZ). They found the average FAZ area was 0.323 mm2, with an average effective diameter of 633 μm, comparable to psychophysical and histological studies.55,56
Clinical Retinal Imaging with Adaptive Optics
A number of clinical conditions have been examined using AO retinal imaging. We review some of these here, emphasizing those examples where important information about disease mechanism or novel insight into the cellular pathology of the condition was obtained.
Congenital Color Vision Deficiencies
Just as there is genotypic and phenotypic variation in “normal” color vision, there is considerable variability among individuals with red-green and blue-yellow color vision deficiencies.57–61 While easily detectable through the use of behavioral testing and associated with the functional absence of one type of cone, these color vision defects had been thought to be completely benign. However, just as AO imaging provided novel insight into our understanding of normal color vision, it has been instrumental in clarifying the pathogenesis of color vision defects.
Tritan (blue-yellow) defects are caused by missense mutations in the S-opsin gene.62,63 Recently, Baraas et al. (2007) used an AO fundus camera to image the cone mosaic in two related individuals heterozygous for a missense mutation (R283Q) in the S-opsin gene. The father (who was behaviorally a tritanope) demonstrated decreased density, abnormal cone packing, and an absence of S cones, suggesting that at least in this subject, heterozygosity for the R283Q mutation ultimately results in the death of S-cones.64 However, the daughter had a normal appearing mosaic and manifested only very mild tritan errors on a subset of color vision tests. The authors concluded that the phenotypic difference between the father and daughter with the same mutation reflected different stages of disease progression in which dominant negative interactions have compromised the function and viability of S-cones. This is based on the supposition that S-opsin mutations that cause autosomal dominant tritan color-vision deficiencies are analogous to rhodopsin mutations that cause autosomal dominant retinitis pigmentosa, where dominant negative interactions between normal and mutant pigment expressed in the same rod lead to the death of the affected rod.65,66 Previous observations that older tritan subjects tend to have elevated error scores on color vision tests compared to younger tritan subjects support this conclusion.67 This finding resulted in a new theory on tritan color vision defects, whereby tritan phenotypes caused by S-opsin mutations are associated with the loss of S-cones. Future imaging studies directly comparing individuals homozygous for tritan-associated mutations with individuals heterozygous for the same mutations will be needed to confirm this hypothesis.
Red–green defects involve the loss of either L- or M-cone function, resulting in a protan or deutan defect, respectively. The genes encoding the L and M photopigments reside in tandem array on the X-chromosome, thus there is no potential for dominant negative interactions as there is for the tritan defects. In addition, a number of genetic pathways can result in a red-green defect. The first pathway is replication of the L or M genes such that multiple genes of the same type are arranged in the first two positions of the array. Since only the first two opsin genes are typically expressed, these genotypes results in a color deficient phenotype.68,69 The second pathway is the reduction to a single gene at the genetic locus. A third cause of red-green color vision deficiency is the presence of an inactivating mutation within one of the genes in the L/M array. These were first thought to involve missense mutations that result in expression of nonfunctional pigment, the most common mutation being the substitution of arginine for cysteine at position 203 (C203R).69–71 Adaptive optics imaging has shown that these pathways differentially affect the integrity of the cone mosaic (Figure 3), underscoring the fact that red-green defects are not all benign, nor do they all share the same cellular phenotype.
Figure 3.

Images of the cone mosaic from individuals with different cone opsin mutations. Images are from 1-degree temporal retina from a normal trichromat (A), a dichromat harboring a pigment with the LIAVA polymorphism (B), and a dichromat harboring a pigment with the C203R missense mutation (C). While both dichromats have approximately the same reduction in cone density (31,771 cones/mm2 for the LIAVA retina; 27,799 cones/mm2 for the C203R retina, compared with normal of 55,184 cones/mm2), the arrangement of the remaining cone photoreceptors is more regular for the C203R retina.73 Scale bar = 50 μm.
In 2004, data was published showing that an individual with an inactivating mutation (“LIAVA”) in one X-linked cone opsin gene had a significantly disrupted cone mosaic, with about 35% of the foveal mosaic occupied by dark gaps (Figure 3C).72 These gaps presumably represent the subset of non-functioning cones that contained the inactive opsin. This clarified a fundamental question about what happens to cones in red-green color vision defects. Additional work by the same group showed that a different mutation (the C203R folding mutation) also resulted in disruption of the cone mosaic, however the spatial arrangement of the remaining cones was different than that in the LIAVA retina (Figure 3B).73 The comparison of the C203R retinas to LIAVA retinas revealed a subtle but important difference in the arrangement of the remaining cones. The cones in the C203R retina were more regularly packed than those in the LIAVA retina, suggesting a difference in either the timing of the cone loss, or a difference in the degree of cone loss. Cone mosaic organization and density in the C203R retina, suggests the cones expressing the C203R retina had degenerated completely, whereas those in the LIAVA retina were still present (although not functioning or waveguiding). This is supported by data showing that the cone locations and cone density have not changed in the subject’ s LIAVA retina over a period of 6 years.74
Albinism
Albinism is an inherited disorder of melanin biosynthesis, and is associated with a disruption in normal retinal development, with foveal hypoplasia (absence of a foveal pit) being the predominant ocular phenotype. It is well accepted that there is a developmental link between foveal cone packing and formation of the foveal pit.75–79 Given the observed variation in the degree of foveal hypoplasia observed in albinism,80,81 one might predict that the degree of foveal cone specialization also varies. Initial insight into this issue came from Marmor et al. (2008), who used AO to image the parafoveal cones in 4 patients with unspecified foveal hypoplasia.82 They observed “normal” cone specialization (cone packing and outer nuclear layer thickening), however no quantitative analysis was provided. More recently, McAllister et al. (2010) examined six individuals with albinism and found variation in the degree of foveal hypoplasia and corresponding variation in foveal cone specialization (measuring cone packing gradients and foveal outer segment lengthening).83 These results confirm that there is a continuum of foveal maturity in albinism on the cellular level, which may prove useful for identifying suitable candidates for novel therapies as they become available. Representative images are shown in Figure 4A–C. Although albinism subjects generally lack retinal pigment, some subjects have a “leaky” mutation that allows some pigment to be formed, producing pigment clumps in the retina, visualized as areas of hypo- and hyperfluorescence (Figure 4D). All three individuals with albinism had significant nystagmus, however the brief exposure duration used to image the cone mosaic mitigated the effect of eye movement on resolving individual cones.
Figure 4.

Imaging the cone mosaic in albinism. Shown are images of the cone mosaic centered at approximately 1 degree superior retina. The foveal center is located just off the bottom edge of each image. Images from a normal retina (A) and a subject with OCA1B (B) reveal a gradual decrease in cone packing density moving from bottom (inferior retina) to top (superior retina). Image from a subject with OA1 (C) reveals more uniform cone packing density. Cones vary individually in their reflectivity, and there are regional differences in image intensity, but this is in stark contrast to the pigment mottling seen in (D). Scale bar is 100 microns.
Retinal Degenerations
Inherited retinal degenerations represent a heterogeneous group of diseases which all produce progressive death of photoreceptors. Presently there are no cures, and arguably no effective treatments, to slow or reverse vision loss caused by these diseases. Retinitis pigmentosa (RP), or rod-cone degeneration, affects rods to a greater extent than cones and initially causes loss of peripheral vision and night vision, while cone-rod dystrophy (CRD) affects cones to a greater extent than rods and produces loss of visual acuity, central vision and color vision.
Adaptive optics was used to first report in vivo retinal images of a patient with CRD at a microscopic resolution comparable to that of histology, which revealed a reduction in cone density.84 Flood-illuminated AO as well as AOSLO imaging of CRD patients revealed dark patches of retina devoid of wave-guiding cones and highly reflective areas of retinal scarring and atrophy in the bull’ s-eye lesion. The spared retina showed a nearly continuous photoreceptor mosaic with larger than normal cones, resulting in reduced cone density.85 Another group demonstrated reduction of cone densities in areas with lower amplitudes of mfERG responses as well as reduced visual sensitivities measured by automated perimetry in a series of retinal dystrophy cases.86 More recently, it was shown that patients with RP and CRD show different patterns of cone loss; primary cone degenerations cause increased cone spacing centrally, while rod-cone degeneration causes cone cell death adjacent to scotomas beginning around 10 degrees eccentric to fixation, the retinal region with the highest density of rods.31 Figure 5 shows images from a patient with autosomal dominant RP, where the AOSLO images reveal a disrupted cone mosaic and in areas of extensive cone loss, the RPE mosaic can be directly visualized (also see Roorda et al. (2007)50). AOSLO imaging has also been used to study cone photoreceptor structure in eyes with mutations associated with specific genetic mutations, such as mutations in rhodopsin31 and ABCA4, the genetic defect present in most patients with autosomal recessively inherited Stargardt disease,87 providing high-resolution phenotypic characterization of patients with known genotypes. Moving forward, the combination of AO imaging with molecular genetic information may provide insight into the etiology of various retinal degenerations. In addition, assessment of the relative integrity of the photoreceptor mosaic may be useful for identifying individuals who may be good candidates for experimental therapies such as gene therapy, and may permit specific areas of retained photoreceptor structure to be targeted for treatment.49,88
Mitochondrial DNA T8993C Mutation
Cone photoreceptors are highly metabolically active, and their inner segments are packed with mitochondria. It is not clear if the high density of mitochondria present in cone inner segments is necessary simply to meet metabolic requirements, or whether it serves some structural or optical function. A mitochondrial DNA mutation in the ATPase6 gene in which a cystidine is substituted for a thymidine at position 8993, results in a syndrome known as neurogenic weakness, ataxia and retinitis pigmentosa (NARP). Mitochondrial mutations are distinguished by a condition known as heteroplasmy in which mitochondria expressing both normal and mutant DNA within the same cell. The percentage of mitochondria expressing the mutation correlates with disease severity, but there is marked variation in the degree of heteroplasmy between different individuals in a family carrying the same mutation, between different tissues within a given individual, and even within individual cells of a single tissue. In a recent paper AOSLO was used to characterize the cone mosaic in a family carrying the T8993C mutation and demonstrated variable disease expression on a cellular level.89 Patients with the same high level of expression of the mitochondrial mutation showed dramatically different phenotypes ranging from very mild to severe photoreceptor degeneration. Furthermore, there was significant variability in cone spacing and cone packing within individual eyes. The abnormal cone spacing observed in this family was likely a consequence of cone photoreceptor death caused by the mitochondrial mutation with insufficient synthesis of ATP to meet metabolic needs. However, abnormalities observed in the remaining cones may indicate that cone inner segment mitochondria play an additional role that is essential for normal cone waveguiding.89 The AOSLO images in this manuscript present the first non-invasive characterization of the effects of mitochondrial mutations on cone photoreceptor structure in living eyes, and may provide insight into the role mitochondria play in cone structure and survival.
Future Directions
What does the future hold for retinal imaging with AO in the clinic? While established as a powerful research tool for nearly two dozen research groups worldwide, AO has yet to achieve widespread clinical use. This is not likely due to a lack of clinical utility, rather a lack of clinical access and availability in addition to the time required to obtain, process, and analyze the images. Important progress has been made in this regard, with a few groups now deploying imaging systems within clinical settings.3,90,91 One of the other drawbacks of AO systems to date has been their size; however numerous compact designs have been developed,3,90–94 and bona fide commercial clinical prototypes are coming online. One such device, based on a flood-illuminated design was developed by Imagine Eyes (Orsay, France) and is currently being tested in two hospitals in France. A second device, developed by Physical Sciences Incorporated (Andover, MA), is in Phase II clinical testing and integrates AO with a line scanning laser ophthalmoscope. Both devices feature important advances in control software, enabling use by a wider demographic and, as shown in Figure 6, they both have small “clinic-friendly” footprints. Work remains to better understand the tradeoffs between different imaging modalities, with recent work showing subtle, but potentially important differences between AO flood-illuminated and AOSLO retinal images.95
Figure 6.

Two prototype clinical AO systems. (A, B) Picture of the Imagine Eyes system and corresponding image of the cone mosaic obtained with this system. (C, D) Picture of the Physical Sciences Incorporated system and corresponding image of the cone mosaic obtained with this system. Both systems provide qualitatively similar cone contrast and resolution to that obtained by research systems.
Beyond simply providing clinicians with higher-resolution views of retinal pathology, there are other exciting applications of AO imaging on the immediate horizon. One of these applications is tracking of disease progression. It has been shown that it is possible to image with cellular resolution in exactly the same retinal area over days,31 months,96 and even years.74,97 The ability to longitudinally track disease progression serves as the foundation for an imaging-based approach to track treatment response with greater sensitivity and on a much shorter time scale than current outcome measures such as visual acuity and visual field sensitivity can allow. Since the rate of disease progression is typically slow in inherited retinal degenerations, it is estimated that patients must be monitored for 7–10 years before standard clinical measures of visual function, such as visual acuity and visual field sensitivity, show significant evidence of disease progression in patients with RP.98, 99 As novel treatments to slow disease progression in inherited retinal degenerations are developed, it will be critical to evaluate the effect treatments have on individual photoreceptor cells. If AO imaging can provide high-resolution, non-invasive measures of cone structure in living patients with retinal degeneration in response to treatments, cone structure may provide a suitable outcome measure to assess experimental treatments in clinical trials. In fact, a recent study found that in 3 retinal degeneration patients treated with sustained-release CNTF in one eye and a sham surgery in the fellow eye, the rate of cone loss was lower in the CNTF-treated eye than the control eye.97 Expanding the scope of this study and others will require AO imaging expertise and ability in multiple centers to enable randomized clinical trials to study the effect of treatments on cone structure. AO imaging systems that can be deployed into retina clinics and that can acquire images that can be sent to a centralized reading center for evaluation will be required to incorporate AO images of the photoreceptor mosaic as valid outcome measures for clinical trials in the future.
Figure 2.
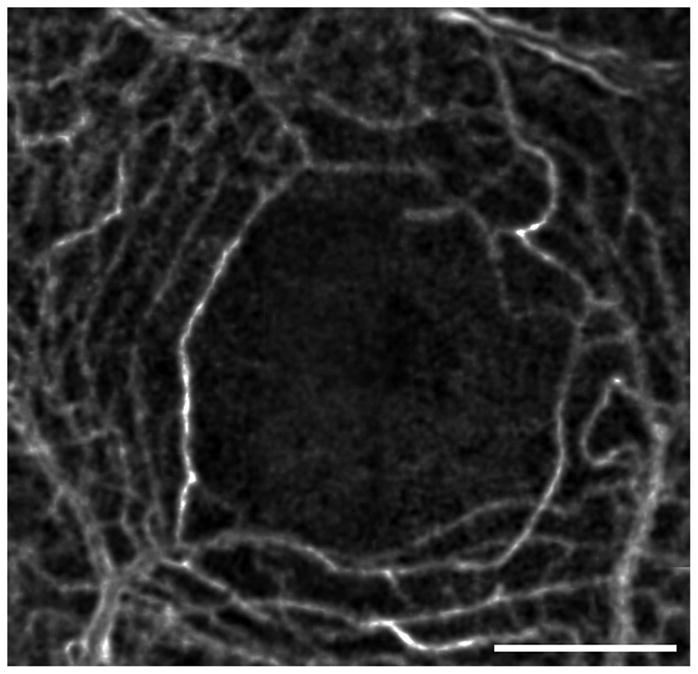
Capillaries forming the edge of the FAZ in a normal eye. This image is generated by computing the motion contrast of a stabilized AOSLO video. Motion contrast images from several videos were stitched together to form this montage, showing the continuous rim of the FAZ as well as the surrounding capillary network. Scale bar is 1 degree.
Acknowledgments
JC is the recipient of a Career Development Award from Research to Prevent Blindness. JLD is the recipient of a Career Development Award and Physician Scientist Award from Research to Prevent Blindness and a Career Development Award and Clinician Center Grant from the Foundation Fighting Blindness. The writing of this manuscript was supported in part by NIH grants R01EY017607 (JC), EY002162 (JLD), & R01EY014375 BRP (AR), grants from That Man May See, Inc. (JLD), The Bernard Newcomb Macular Degeneration Fund (JLD), Hope for Vision (JC & JLD), and unrestricted departmental grants from Research to Prevent Blindness (Medical College of Wisconsin, UCSF Department of Ophthalmology). The authors would like to thank J. Rha and M. Wagner-Schuman for helpful comments in the preparation of this manuscript. The authors also thank N. Chateau (Imagine Eyes) and D. X. Hammer (Physical Sciences Incorporated) for providing images from their clinical AO systems.
AR holds US Patent #7,118,216, “Method and Apparatus for Using Adaptive Optics in a Scanning Laser Ophthalmoscope.” None of the other authors has any commercial interests in any of the products or devices mentioned in the article.
Abbreviations
- SLO
scanning laser ophthalmoscope
- SD- OCT
Spectral Domain Optical Coherence Tomography
- RPE
Retinal Pigmented Epithelium
- AO
adaptive optics
- SLD
superluminescent diode
- AOSLO
adaptive optics scanning laser ophthalmoscope
- AO-OCT
adaptive optics optical coherence tomography
- UHR-OCT
ultra-high resolution optical coherence tomography
References
- 1.Tyson RK. Principles of Adaptive Optics. Boston: Academic Press, Inc; 1991. [Google Scholar]
- 2.Porter J, Queener H, Lin J, Thorn K, Awwal A, editors. Adaptive Optics for Vision Science: Principles, Practices, Design, and Applications. Hoboken, NJ: Wiley Interscience; 2006. [Google Scholar]
- 3.Chen DC, Jones SM, Silva DA, Olivier SS. High-resolution adaptive optics scanning laser ophthalmoscope with dual deformable mirrors. J Opt Soc Am (A) 2007;24:1305–12. doi: 10.1364/josaa.24.001305. [DOI] [PubMed] [Google Scholar]
- 4.Zawadzki RJ, Choi SS, Werner JS, Jones SM, Chen D, Olivier SS, Zhang Y, Rha J, Cense B, Miller DT. Two deformable mirror adaptive optics system for in vivo retinal imaging with optical coherence tomography. Presented at the 2006 Biomedical Optics Topical Meeting; Fort Lauderdale, Fla., USA. 22 March 2006. [Google Scholar]
- 5.Zou W, Qi X, Burns SA. Wavefront-aberration sorting and correction for a dual-deformable-mirror adaptive-optics system. Opt Lett. 2008;33:2602–4. doi: 10.1364/ol.33.002602. [DOI] [PMC free article] [PubMed] [Google Scholar]
- 6.Li C, Sredar N, Ivers KM, Queener H, Porter J. A correction algorithm to simultaneously control dual deformable mirrors in a woofer-tweeter adaptive optics system. Opt Express. 2010;18:16671–84. doi: 10.1364/OE.18.016671. [DOI] [PMC free article] [PubMed] [Google Scholar]
- 7.Hofer H, Chen L, Yoon GY, Singer B, Yamauchi Y, Williams DR. Improvement in retinal image quality with dynamic correction of the eye's aberrations. Opt Express. 2001;8:631–43. doi: 10.1364/oe.8.000631. [DOI] [PubMed] [Google Scholar]
- 8.Zou W, Burns SA. High-accuracy wavefront control for retinal imaging with Adaptive-Influence-Matrix Adaptive Optics. Opt Express. 2009;17:20167–77. doi: 10.1364/OE.17.020167. [DOI] [PMC free article] [PubMed] [Google Scholar]
- 9.Miller DT, Williams DR, Morris GM, Liang J. Images of cone photoreceptors in the living human eye. Vision Res. 1996;36:1067–79. doi: 10.1016/0042-6989(95)00225-1. [DOI] [PubMed] [Google Scholar]
- 10.Liang J, Williams DR, Miller DT. Supernormal vision and high-resolution retinal imaging through adaptive optics. J Opt Soc Am (A) 1997;14:2884–92. doi: 10.1364/josaa.14.002884. [DOI] [PubMed] [Google Scholar]
- 11.Roorda A, Williams DR. Optical fiber properties of individual human cones. J Vis. 2002;2:404–12. doi: 10.1167/2.5.4. [DOI] [PubMed] [Google Scholar]
- 12.Pallikaris A, Williams DR, Hofer H. The reflectance of single cones in the living human eye. Invest Ophthalmol Vis Sci. 2003;44:4580–92. doi: 10.1167/iovs.03-0094. [DOI] [PubMed] [Google Scholar]
- 13.Putnam NM, Hofer HJ, Doble N, Chen L, Carroll J, Williams DR. The locus of fixation and the foveal cone mosaic. J Vis. 2005;5:632–9. doi: 10.1167/5.7.3. [DOI] [PubMed] [Google Scholar]
- 14.Rha J, Jonnal RS, Thorn KE, Qu J, Zhang Y, Miller DT. Adaptive optics flood-illumination camera for high speed retinal imaging. Opt Express. 2006;14:4552–69. doi: 10.1364/oe.14.004552. [DOI] [PubMed] [Google Scholar]
- 15.Roorda A, Romero-Borja F, Donnelly W, 3rd, Queener H, Hebert T, Campbell M. Adaptive optics scanning laser ophthalmoscopy. Opt Express. 2002;10:405–12. doi: 10.1364/oe.10.000405. [DOI] [PubMed] [Google Scholar]
- 16.Romero-Borja F, Venkateswaran K, Roorda A, Hebert T. Optical slicing of human retinal tissue in vivo with the adaptive optics scanning laser ophthalmoscope. Appl Opt. 2005;44:4032–40. doi: 10.1364/ao.44.004032. [DOI] [PubMed] [Google Scholar]
- 17.Roorda A. Applications of adaptive optics scanning laser ophthalmoscopy. Optom Vis Sci. 2010;87:260–8. doi: 10.1097/OPX.0b013e3181d39479. [DOI] [PMC free article] [PubMed] [Google Scholar]
- 18.Zhang Y, Roorda A. Evaluating the lateral resolution of the adaptive optics scanning laser ophthalmoscope. J Biomed Opt. 2006;11:014002. doi: 10.1117/1.2166434. [DOI] [PubMed] [Google Scholar]
- 19.Huang D, Swanson EA, Lin CP, Schuman JS, Stinson WG, Chang W, Hee MR, Flotte T, Gregory K, Puliafito CA, et al. Optical coherence tomography. Science. 1991;254:1178–81. doi: 10.1126/science.1957169. [DOI] [PMC free article] [PubMed] [Google Scholar]
- 20.Drexler W, Chen Y, Aguirre A, Považay B, Unterhuber A, Fujimoto JG. Ultrahigh resolution optical coherence tomography. In: Drexler W, Fujimoto JG, editors. Optical Coherence Tomography: Technology and Applications. Berlin: Springer; 2008. pp. 239–80. [Google Scholar]
- 21.Fernández EJ, Unterhuber A, Považay B, Hermann B, Artal P, Drexler W. Chromatic aberration correction of the human eye for retinal imaging in the near infrared. Opt Express. 2006;14:6213–25. doi: 10.1364/oe.14.006213. [DOI] [PubMed] [Google Scholar]
- 22.Zawadzki RJ, Cense B, Zhang Y, Choi SS, Miller DT, Werner JS. Ultrahigh-resolution optical coherence tomography with monochromatic and chromatic aberration correction. Opt Express. 2008;16:8126–43. doi: 10.1364/oe.16.008126. [DOI] [PMC free article] [PubMed] [Google Scholar]
- 23.Hermann B, Fernandez EJ, Unterhuber A, Sattmann H, Fercher AF, Drexler W, Prieto PM, Artal P. Adaptive-optics ultrahigh-resolution optical coherence tomography. Opt Lett. 2004;29:2142–4. doi: 10.1364/ol.29.002142. [DOI] [PubMed] [Google Scholar]
- 24.Zhang Y, Rha J, Jonnal R, Miller D. Adaptive optics parallel spectral domain optical coherence tomography for imaging the living retina. Opt Express. 2005;13:4792–811. doi: 10.1364/opex.13.004792. [DOI] [PubMed] [Google Scholar]
- 25.Zhang Y, Cense B, Rha J, Jonnal RS, Gao W, Zawadzki RJ, Werner JS, Jones S, Olivier S, Miller DT. High-speed volumetric imaging of cone photoreceptors with adaptive optics spectral-domain optical coherence tomography. Opt Express. 2006;14:4380–94. doi: 10.1364/OE.14.004380. [DOI] [PMC free article] [PubMed] [Google Scholar]
- 26.Fernández EJ, Hermann B, Považay B, Unterhuber A, Sattmann H, Hofer B, Ahnelt PK, Drexler W. Ultrahigh resolution optical coherence tomography and pancorrection for cellular imaging of the living human retina. Opt Express. 2008;16:11083–94. doi: 10.1364/oe.16.011083. [DOI] [PubMed] [Google Scholar]
- 27.Zawadzki RJ, Choi SS, Fuller AR, Evans JW, Hamann B, Werner JS. Cellular resolution volumetric in vivo retinal imaging with adaptive optics-optical coherence tomography. Opt Express. 2009;17:4084–94. doi: 10.1364/oe.17.004084. [DOI] [PMC free article] [PubMed] [Google Scholar]
- 28.Torti C, Považay B, Hofer B, Unterhuber A, Carroll J, Ahnelt PK, Drexler W. Adaptive optics optical coherence tomography at 120,000 depth scans/s for non-invasive cellular phenotyping of the living human retina. Opt Express. 2009;17:19382–400. doi: 10.1364/OE.17.019382. [DOI] [PMC free article] [PubMed] [Google Scholar]
- 29.Pircher M, Baumann B, Gotzinger E, Hitzenberger CK. Retinal cone mosaic imaged with transverse scanning optical coherence tomography. Opt Lett. 2006;31:1821–3. doi: 10.1364/ol.31.001821. [DOI] [PMC free article] [PubMed] [Google Scholar]
- 30.Potsaid B, Gorczynska I, Srinivasan VJ, Chen Y, Jiang J, Cable A, Fujimoto JG. Ultrahigh speed spectral / Fourier domain OCT ophthalmic imaging at 70,000 to 312,500 axial scans per second. Opt Express. 2008;16:15149–69. doi: 10.1364/oe.16.015149. [DOI] [PMC free article] [PubMed] [Google Scholar]
- 31.Duncan JL, Zhang Y, Gandhi J, Nakanishi C, Othman M, Branham KE, Swaroop A, Roorda A. High-resolution imaging with adaptive optics in patients with inherited retinal degeneration. Invest Ophthalmol Vis Sci. 2007;48:3283–91. doi: 10.1167/iovs.06-1422. [DOI] [PubMed] [Google Scholar]
- 32.Chui TY, Song H, Burns SA. Adaptive-optics imaging of human cone photoreceptor distribution. J Opt Soc Am (A) 2008;25:3021–9. doi: 10.1364/josaa.25.003021. [DOI] [PMC free article] [PubMed] [Google Scholar]
- 33.Roorda A, Williams DR. The arrangement of the three cone classes in the living human eye. Nature. 1999;397:520–2. doi: 10.1038/17383. [DOI] [PubMed] [Google Scholar]
- 34.Brainard DH, Roorda A, Yamauchi Y, Calderone JB, Metha A, Neitz M, Neitz J, Williams DR, Jacobs GH. Functional consequences of the relative numbers of L and M cones. J Opt Soc Am (A) 2000;17:607–14. doi: 10.1364/josaa.17.000607. [DOI] [PubMed] [Google Scholar]
- 35.Yamauchi Y, Williams DR, Brainard DH, Roorda A, Carroll J, Neitz M, Neitz J, Calderone JB, Jacobs GH. What determines unique yellow, L/M cone ratio or visual experience?. Proceedings of the 9th Congress of the International Colour Association; Rochester, NY. 24 June 2001; Bellingham, WA: SPIE; 2002. pp. 275–8. [Google Scholar]
- 36.Hofer H, Singer B, Williams DR. Different sensations from cones with the same photopigment. J Vis. 2005;5:444–54. doi: 10.1167/5.5.5. [DOI] [PubMed] [Google Scholar]
- 37.Jonnal RS, Rha J, Zhang Y, Cense B, Gao W, Miller DT. In vivo functional imaging of human cone photoreceptors. Opt Express. 2007;15:16141–60. doi: 10.1364/OE.15.016141. [DOI] [PMC free article] [PubMed] [Google Scholar]
- 38.Rha J, Schroeder B, Godara P, Carroll J. Variable optical activation of human cone photoreceptors visualized using a short coherence light source. Opt Lett. 2009;34:3782–4. doi: 10.1364/OL.34.003782. [DOI] [PMC free article] [PubMed] [Google Scholar]
- 39.Jonnal RS, Besecker JR, Derby JC, Kocaoglu OP, Cense B, Gao W, Wang Q, Miller DT. Imaging outer segment renewal in living human cone photoreceptors. Opt Express. 2010;18:5257–70. doi: 10.1364/OE.18.005257. [DOI] [PMC free article] [PubMed] [Google Scholar]
- 40.Pallikaris A. Adaptive optics ophthalmoscopy: results and applications. J Refract Surg. 2005;21:S570–4. doi: 10.3928/1081-597X-20050901-29. [DOI] [PubMed] [Google Scholar]
- 41.Abramoff MD, Kwon YH, Ts'o D, Soliz P, Zimmerman B, Pokorny J, Kardon R. Visual stimulus-induced changes in human near–infrared fundus reflectance. Invest Ophthalmol Vis Sci. 2006;47:715–21. doi: 10.1167/iovs.05-0008. [DOI] [PMC free article] [PubMed] [Google Scholar]
- 42.Grieve K, Roorda A. Intrinsic signals from human cone photoreceptors. Invest Ophthalmol Vis Sci. 2008;49:713–9. doi: 10.1167/iovs.07-0837. [DOI] [PubMed] [Google Scholar]
- 43.Schallek J, Li H, Kardon R, Kwon Y, Abramoff M, Soliz P, Ts'o D. Stimulus-evoked intrinsic optical signals in the retina: spatial and temporal characteristics. Invest Ophthalmol Vis Sci. 2009;50:4865–72. doi: 10.1167/iovs.08-3290. [DOI] [PMC free article] [PubMed] [Google Scholar]
- 44.Alpern M, Ching CC, Kitahara K. The directional sensitivity of retinal rods. J Physiol. 1983;343:577–92. doi: 10.1113/jphysiol.1983.sp014911. [DOI] [PMC free article] [PubMed] [Google Scholar]
- 45.van Loo JA, Jr, Enoch JM. The scotopic Stiles-Crawford effect. Vision Res. 1975;15:1005–9. doi: 10.1016/0042-6989(75)90243-6. [DOI] [PubMed] [Google Scholar]
- 46.Nordby K, Sharpe LT. The directional sensitivity of the photoreceptors in the human achromat. J Physiol. 1988;399:267–81. doi: 10.1113/jphysiol.1988.sp017079. [DOI] [PMC free article] [PubMed] [Google Scholar]
- 47.Polyak SL. The Retina: The Anatomy and the Histology of the Retina in Man, Ape, and Monkey, Including the Consideration of Visual Functions, the History of Physiological Optics, and the Histological Laboratory Technique. Chicago: The University of Chicago Press; 1941. [Google Scholar]
- 48.Choi SS, Doble N, Christou J, Plandowski J, Enoch J, Williams D. In vivo imaging of the human rod photoreceptor mosaic. Invest Ophthalmol Vis Sci. 2004;45 E-Abstract 2794. [Google Scholar]
- 49.Carroll J, Choi SS, Williams DR. In vivo imaging of the photoreceptor mosaic of a rod monochromat. Vision Res. 2008;48:2564–8. doi: 10.1016/j.visres.2008.04.006. [DOI] [PMC free article] [PubMed] [Google Scholar]
- 50.Roorda A, Zhang Y, Duncan JL. High-resolution in vivo imaging of the RPE mosaic in eyes with retinal disease. Invest Ophthalmol Vis Sci. 2007;48:2297–303. doi: 10.1167/iovs.06-1450. [DOI] [PubMed] [Google Scholar]
- 51.Morgan JI, Dubra A, Wolfe R, Merigan WH, Williams DR. In vivo autofluorescence imaging of the human and macaque retinal pigment epithelial cell mosaic. Invest Ophthalmol Vis Sci. 2009;50:1350–9. doi: 10.1167/iovs.08-2618. [DOI] [PMC free article] [PubMed] [Google Scholar]
- 52.Martin JA, Roorda A. Direct and noninvasive assessment of parafoveal capillary leukocyte velocity. Ophthalmology. 2005;112:2219–24. doi: 10.1016/j.ophtha.2005.06.033. [DOI] [PubMed] [Google Scholar]
- 53.Martin JA, Roorda A. Pulsatility of parafoveal capillary leukocytes. Exp Eye Res. 2009;88:356–60. doi: 10.1016/j.exer.2008.07.008. [DOI] [PMC free article] [PubMed] [Google Scholar]
- 54.Tam J, Martin JA, Roorda A. Noninvasive visualization and analysis of parafoveal capillaries in humans. Invest Ophthalmol Vis Sci. 2010;51:1691–8. doi: 10.1167/iovs.09-4483. [DOI] [PMC free article] [PubMed] [Google Scholar]
- 55.Zeffren BS, Applegate RA, Bradley A, van Heuven WA. Retinal fixation point location in the foveal avascular zone. Invest Ophthalmol Vis Sci. 1990;31:2099–105. [PubMed] [Google Scholar]
- 56.Provis JM, Hendrickson AE. The foveal avascular region of developing human retina. Arch Ophthalmol. 2008;126:507–11. doi: 10.1001/archopht.126.4.507. [DOI] [PubMed] [Google Scholar]
- 57.Sharpe LT, Stockman A, Jagle H, Knau H, Klausen G, Reitner A, Nathans J. Red, green, and red-green hybrid pigments in the human retina: correlations between deduced protein sequences and psychophysically measured spectral sensitivities. J Neurosci. 1998;18:10053–69. doi: 10.1523/JNEUROSCI.18-23-10053.1998. [DOI] [PMC free article] [PubMed] [Google Scholar]
- 58.Neitz M, Balding SD, McMahon C, Sjoberg SA, Neitz J. Topography of long- and middle-wavelength sensitive cone opsin gene expression in human and Old World monkey retina. Vis Neurosci. 2006;23:379–85. doi: 10.1017/S095252380623325X. [DOI] [PubMed] [Google Scholar]
- 59.Neitz M, Neitz J, Jacobs GH. Spectral tuning of pigments underlying red-green color vision. Science. 1991;252:971–4. doi: 10.1126/science.1903559. [DOI] [PubMed] [Google Scholar]
- 60.Nathans J, Piantanida TP, Eddy RL, Shows TB, Hogness DS. Molecular genetics of inherited variation in human color vision. Science. 1986;232:203–10. doi: 10.1126/science.3485310. [DOI] [PubMed] [Google Scholar]
- 61.Nathans J, Maumenee IA, Zrenner E, Sadowski B, Sharpe LT, Lewis RA, Hansen E, Rosenberg P, Schwartz M, Heckenlively JR, Trabousli E, Klingaman R, Bech-hansen NT, LaRouche GR, Pagon RA, Murphy WH, Weleber RG. Genetic heterogeneity among blue-cone monochromats. Am J Hum Genet. 1993;53:987–1000. [PMC free article] [PubMed] [Google Scholar]
- 62.Weitz CJ, Miyake Y, Shinzato K, Montag E, Zrenner E, Went LN, Nathans J. Human tritanopia associated with two amino acid substitutions in the blue-sensitive opsin. Am J Hum Genet. 1992;50:498–507. [PMC free article] [PubMed] [Google Scholar]
- 63.Weitz CJ, Went LN, Nathans J. Human tritanopia associated with a third amino acid substitution in the blue-sensitive visual pigment. Am J Hum Genet. 1992;51:444–6. [PMC free article] [PubMed] [Google Scholar]
- 64.Baraas RC, Carroll J, Gunther KL, Chung M, Williams DR, Foster DH, Neitz M. Adaptive optics retinal imaging reveals S–cone dystrophy in tritan color-vision deficiency. J Opt Soc Am (A) 2007;24:1438–47. doi: 10.1364/josaa.24.001438. [DOI] [PMC free article] [PubMed] [Google Scholar]
- 65.Dryja TP, Hahn LB, Cowley GS, McGee TL, Berson EL. Mutation spectrum of the rhodopsin gene among patients with autosomal dominant retinitis pigmentosa. Proc Natl Acad Sci U S A. 1991;88:9370–4. doi: 10.1073/pnas.88.20.9370. [DOI] [PMC free article] [PubMed] [Google Scholar]
- 66.Sung CH, Schneider BG, Agarwal N, Papermaster DS, Nathans J. Functional heterogeneity of mutant rhodopsins responsible for autosomal dominant retinitis pigmentosa. Proc Natl Acad Sci U S A. 1991;88:8840–4. doi: 10.1073/pnas.88.19.8840. [DOI] [PMC free article] [PubMed] [Google Scholar]
- 67.Went LN, Pronk N. The genetics of tritan disturbances. Hum Genet. 1985;69:255–62. doi: 10.1007/BF00293036. [DOI] [PubMed] [Google Scholar]
- 68.Deeb SS, Lindsey DT, Hibiya Y, Sanocki E, Winderickx J, Teller DY, Motulsky AG. Genotype-phenotype relationships in human red/green color-vision defects: molecular and psychophysical studies. Am J Hum Genet. 1992;51:687–700. [PMC free article] [PubMed] [Google Scholar]
- 69.Neitz M, Carroll J, Renner A, Knau H, Werner JS, Neitz J. Variety of genotypes in males diagnosed as dichromatic on a conventional clinical anomaloscope. Vis Neurosci. 2004;21:205–16. doi: 10.1017/s0952523804213293. [DOI] [PMC free article] [PubMed] [Google Scholar]
- 70.Bollinger K, Bialozynski C, Neitz J, Neitz M. The importance of deleterious mutations of M pigment genes as a cause of color vision defects. Color Res Appl. 2001;26:S100–5. [Google Scholar]
- 71.Winderickx J, Sanocki E, Lindsey DT, Teller DY, Motulsky AG, Deeb SS. Defective colour vision associated with a missense mutation in the human green visual pigment gene. Nat Genet. 1992;1:251–6. doi: 10.1038/ng0792-251. [DOI] [PubMed] [Google Scholar]
- 72.Carroll J, Neitz M, Hofer H, Neitz J, Williams DR. Functional photoreceptor loss revealed with adaptive optics: an alternate cause of color blindness. Proc Natl Acad Sci U S A. 2004;101:8461–6. doi: 10.1073/pnas.0401440101. [DOI] [PMC free article] [PubMed] [Google Scholar]
- 73.Carroll J, Baraas RC, Wagner-Schuman M, Rha J, Siebe CA, Sloan C, Tait DM, Thompson S, Morgan JI, Neitz J, Williams DR, Foster DH, Neitz M. Cone photoreceptor mosaic disruption associated with Cys203Arg mutation in the M-cone opsin. Proc Natl Acad Sci U S A. 2009;106:20948–53. doi: 10.1073/pnas.0910128106. [DOI] [PMC free article] [PubMed] [Google Scholar]
- 74.Rha J, Dubis AM, Wagner-Schuman M, Tait DM, Godara P, Schroeder B, Stepien K, Carroll J. Spectral domain optical coherence tomography and adaptive optics: imaging photoreceptor layer morphology to interpret preclinical phenotypes. Adv Exp Med Biol. 2010;664:309–16. doi: 10.1007/978-1-4419-1399-9_35. [DOI] [PMC free article] [PubMed] [Google Scholar]
- 75.Yuodelis C, Hendrickson A. A qualitative and quantitative analysis of the human fovea during development. Vision Res. 1986;26:847–55. doi: 10.1016/0042-6989(86)90143-4. [DOI] [PubMed] [Google Scholar]
- 76.Diaz-Araya C, Provis JM. Evidence of photoreceptor migration during early foveal development: a quantitative analysis of human fetal retinae. Vis Neurosci. 1992;8:505–14. doi: 10.1017/s0952523800005605. [DOI] [PubMed] [Google Scholar]
- 77.Springer AD, Hendrickson AE. Development of the primate area of high acuity, 3: temporal relationships between pit formation, retinal elongation and cone packing. Vis Neurosci. 2005;22:171–85. doi: 10.1017/S095252380522206X. [DOI] [PubMed] [Google Scholar]
- 78.Hendrickson A, Troilo D, Possin D, Springer A. Development of the neural retina and its vasculature in the marmoset Callithrix jacchus. J Comp Neurol. 2006;497:270–86. doi: 10.1002/cne.20996. [DOI] [PubMed] [Google Scholar]
- 79.Hammer DX, Iftimia NV, Ferguson RD, Bigelow CE, Ustun TE, Barnaby AM, Fulton AB. Foveal fine structure in retinopathy of prematurity: an adaptive optics Fourier domain optical coherence tomography study. Invest Ophthalmol Vis Sci. 2008;49:2061–70. doi: 10.1167/iovs.07-1228. [DOI] [PMC free article] [PubMed] [Google Scholar]
- 80.Harvey PS, King RA, Summers CG. Spectrum of foveal development in albinism detected with optical coherence tomography. J AAPOS. 2006;10:237–42. doi: 10.1016/j.jaapos.2006.01.008. [DOI] [PubMed] [Google Scholar]
- 81.Seo JH, Yu YS, Kim JH, Choung HK, Heo JW, Kim SJ. Correlation of visual acuity with foveal hypoplasia grading by optical coherence tomography in albinism. Ophthalmology. 2007;114:1547–51. doi: 10.1016/j.ophtha.2006.10.054. [DOI] [PubMed] [Google Scholar]
- 82.Marmor MF, Choi SS, Zawadzki RJ, Werner JS. Visual insignificance of the foveal pit: reassessment of foveal hypoplasia as fovea plana. Arch Ophthalmol. 2008;126:907–13. doi: 10.1001/archopht.126.7.907. [DOI] [PMC free article] [PubMed] [Google Scholar]
- 83.McAllister JT, Dubis AM, Tait DM, Ostler S, Rha J, Stepien KE, Summers CG, Carroll J. Arrested development: high–resolution imaging of foveal morphology in albinism. Vision Res. 2010;50:810–7. doi: 10.1016/j.visres.2010.02.003. [DOI] [PMC free article] [PubMed] [Google Scholar]
- 84.Roorda A. Adaptive optics ophthalmoscopy. J Refract Surg. 2000;16:S602–7. doi: 10.3928/1081-597X-20000901-23. [DOI] [PubMed] [Google Scholar]
- 85.Wolfing JI, Chung M, Carroll J, Roorda A, Williams DR. High-resolution retinal imaging of cone-rod dystrophy. Ophthalmology. 2006;113:1019e1. doi: 10.1016/j.ophtha.2006.01.056. [DOI] [PubMed] [Google Scholar]
- 86.Choi SS, Doble N, Hardy JL, Jones SM, Keltner JL, Olivier SS, Werner JS. In vivo imaging of the photoreceptor mosaic in retinal dystrophies and correlations with visual function. Invest Ophthalmol Vis Sci. 2006;47:2080–92. doi: 10.1167/iovs.05-0997. [DOI] [PMC free article] [PubMed] [Google Scholar]
- 87.Chen Y, Roorda A, Duncan JL. Advances in imaging of Stargardt disease. Adv Exp Med Biol. 2010;664:333–40. doi: 10.1007/978-1-4419-1399-9_38. [DOI] [PMC free article] [PubMed] [Google Scholar]
- 88.Jacobson SG, Aleman TS, Cideciyan AV, Sumaroka A, Schwartz SB, Windsor EA, Traboulsi EI, Heon E, Pittler SJ, Milam AH, Maguire AM, Palczewski K, Stone EM, Bennett J. Identifying photoreceptors in blind eyes caused by RPE65 mutations: Prerequisite for human gene therapy success. Proc Natl Acad Sci U S A. 2005;102:6177–82. doi: 10.1073/pnas.0500646102. [DOI] [PMC free article] [PubMed] [Google Scholar]
- 89.Yoon MK, Roorda A, Zhang Y, Nakanishi C, Wong LJ, Zhang Q, Gillum L, Green A, Duncan JL. Adaptive optics scanning laser ophthalmoscopy images in a family with the mitochondrial DNA T8993C mutation. Invest Ophthalmol Vis Sci. 2009;50:1838–47. doi: 10.1167/iovs.08-2029. [DOI] [PMC free article] [PubMed] [Google Scholar]
- 90.Zhang Y, Poonja S, Roorda A. MEMS-based adaptive optics scanning laser ophthalmoscopy. Opt Lett. 2006;31:1268–70. doi: 10.1364/ol.31.001268. [DOI] [PubMed] [Google Scholar]
- 91.Mujat M, Ferguson RD, Patel AH, Iftimia N, Lue N, Hammer DX. High resolution multimodal clinical ophthalmic imaging system. Opt Express. 2010;18:11607–21. doi: 10.1364/OE.18.011607. [DOI] [PMC free article] [PubMed] [Google Scholar]
- 92.Bigelow CE, Iftimia NV, Ferguson RD, Ustun TE, Bloom B, Hammer DX. Compact multimodal adaptive-optics spectral-domain optical coherence tomography instrument for retinal imaging. J Opt Soc Am (A) 2007;24:1327–36. doi: 10.1364/josaa.24.001327. [DOI] [PubMed] [Google Scholar]
- 93.Burns SA, Tumbar R, Elsner AE, Ferguson D, Hammer DX. Large-field-of-view, modular, stabilized, adaptive-optics-based scanning laser ophthalmoscope. J Opt Soc Am (A) 2007;24:1313–26. doi: 10.1364/josaa.24.001313. [DOI] [PMC free article] [PubMed] [Google Scholar]
- 94.Mujat M, Ferguson RD, Iftimia N, Hammer DX. Compact adaptive optics line scanning ophthalmoscope. Opt Express. 2009;17:10242–58. doi: 10.1364/oe.17.010242. [DOI] [PMC free article] [PubMed] [Google Scholar]
- 95.Carroll J, Rossi EA, Porter J, Neitz J, Roorda A, Williams DR, Neitz M. Deletion of the X-linked opsin gene array locus control region (LCR) results in disruption of the cone mosaic. Vision Res. 2010;50:1989–99. doi: 10.1016/j.visres.2010.07.009. [DOI] [PMC free article] [PubMed] [Google Scholar]
- 96.Bhatt SS, Rha J, Carroll J, Stepien K. Imaging photoreceptor structure in punctate inner choroidopathy using adaptive optics ophthalmoscopy and spectral domain optical coherence tomography. Investigative Ophthalmology & Visual Science. 2010;51 E-Abstract 2332. [Google Scholar]
- 97.Talcott KE, Sundquist S, Solovyev A, Lujan BJ, Tao W, Roorda A, Duncan JL. High-resolution in-vivo imaging of cone photoreceptors in eyes treated with sustained-release ciliary neurotrophic factor in patients with retinitis pigmentosa. Investigative Ophthalmology and Visual Science. 2010;51 E-Abstract 1385. [Google Scholar]
- 98.Grover S, Fishman GA, Anderson RJ, Alexander KR, Derlacki DJ. Rate of visual field loss in retinitis pigmentosa. Ophthalmology. 1997;104:460–5. doi: 10.1016/s0161-6420(97)30291-7. [DOI] [PubMed] [Google Scholar]
- 99.Fishman GA, Bozbeyoglu S, Massof RW, Kimberling W. Natural course of visual field loss in patients with Type 2 Usher syndrome. Retina. 2007;27:601–8. doi: 10.1097/01.iae.0000246675.88911.2c. [DOI] [PubMed] [Google Scholar]
- 100.Carroll J, Gray DC, Roorda A, Williams DR. Recent advances in retinal imaging with adaptive optics. Optics Photon News. 2005;16:36–42. [Google Scholar]