


Abstract
A common goal in the discovery of rare functional DNA variants via medical resequencing is to incur a relatively lower proportion of false positive base-calls. We developed a novel statistical method for resequencing arrays (SRMA, sequence robust multi-array analysis) to increase the accuracy of detecting rare variants and reduce the costs in subsequent sequence verifications required in medical applications. SRMA includes single and multi-array analysis and accounts for technical variables as well as the possibility of both low- and high-frequency genomic variation. The confidence of each base-call was ranked using two quality measures. In comparison to Sanger capillary sequencing, we achieved a false discovery rate of 2% (false positive rate 1.2 × 10⁻⁵, false negative rate 5%), which is similar to automated second-generation sequencing technologies. Applied to the analysis of 39 nuclear candidate genes in disorders of mitochondrial DNA (mtDNA) maintenance, we confirmed mutations in the DNA polymerase gamma POLG in positive control cases, and identified novel rare variants in previously undiagnosed cases in the mitochondrial topoisomerase TOP1MT, the mismatch repair enzyme MUTYH, and the apurinic-apyrimidinic endonuclease APEX2. Some patients carried rare heterozygous variants in several functionally interacting genes, which could indicate synergistic genetic effects in these clinically similar disorders.
INTRODUCTION
Rare functional DNA variants (≤1% minor allele frequency, MAF) cause most Mendelian disorders, and they may underlie a large proportion of the inherited susceptibility to common human traits (1,2). These low frequency variants could be located in a variety of different genes, potentially interacting with other variants, and could be associated with variable clinical disease phenotypes. The identification of DNA variants in medical resequencing is traditionally performed using Sanger capillary sequencing. This method’s per-base accuracy is as high as 99.999% (3), although laborious manual inspections of multiple target reads are required to sequence each position. Due to substantial variability within a single read, automated base-calling of Sanger traces has been particularly limited in the detection of rare DNA variants in diploid genomes (4). As an alternative method, sequencing by hybridization (SBH) has provided a potentially more cost-effective resequencing strategy (5,6). SBH is based on the principle that the differential hybridization of target DNA to an array of oligonucleotide probes can be used to decode its primary DNA sequence (3). Resequencing array applications have successfully identified novel and potentially pathological variants in many genes and samples (7–11). A key limitation of this technology has been the high false positive rate (FPR) (estimated at 3%) in the detection of heterozygous signals (3,12) leading to relatively higher costs in subsequent data verifications. Innovative DNA sample pre-processing methods coupled with array-based sequencing have recently lowered the FPRs (<10−5) and false negative rates (FNR, 10%) (13), which is a performance level comparable to second-generation sequencing platforms (14). However, these newer sequencing methods are often not available to individual investigator laboratories interested in identifying rare variants in many samples and candidate genes.
In this study we developed and validated new statistical methods for resequencing array data analysis in order to improve the accuracy of this technology. Our goal was to maximize the number of: (i) called sequence bases (call rate); (ii) correct discoveries among all true variants (1–FNR); and (iii) correct discoveries among all variant calls [1 – false discovery rate (FDR)]. Specifically, we addressed limitations that are unique to resequencing arrays (Supplementary Table S1) including: (i) the heterogeneity in the data quality of array and oligonucleotide probe signals across a large number of target sequences; (ii) the detection of all variants in diploid samples, which occur at frequencies of 1 in 1000 bp or lower (15); and (iii) the identification of spurious signals due to technical and experimental errors to be distinguished from true signals due to sequence variation. To this end, our new methods increase the accuracy of detecting DNA variants and reduce the resequencing costs.
We applied our methods to the analysis of 39 candidate genes for disorders of mtDNA maintenance in 40 medical cases and controls using a customized Affymetrix resequencing array. Rare mutations in some of these nuclear-encoded genes (the proteins localize to mitochondria) cause secondary mtDNA deletions and depletions that are associated with debilitating multi-system diseases (16–18). While these disorders display considerable clinical overlap and often resemble those caused by mtDNA defects, they follow recessive, dominant or complex inheritance patterns (19). The medical cases we studied included eight patients with known disease mutations serving as positive controls, and 19 cases with an mtDNA maintenance disorder but unknown gene defect. Through comparative Sanger sequencing of all genes and samples (4.3 Mb), we show that our improved statistical methods for resequencing array analysis is powerful enough to detect 95% (FDR 2%) of both common and rare genetic variants in each individual. Some cases carried novel and predicted functional heterozygous variants in multiple genes indicating the need for parallel resequencing of many genes. The integrative analysis of gene and disease data with functional mitochondrial parameters remains important to establishing a definitive diagnosis.
MATERIALS AND METHODS
Selection of candidate genes and study population
We selected 39 nuclear genes based on evidence of the localization of their gene products to human mitochondria and functions in mitochondrial DNA (mtDNA) maintenance (Supplementary Table S2). Mutations in some genes are associated with mtDNA maintenance disorders including progressive external ophthalmoplegia (PEO) and Alpers syndrome (17,18). To prioritize novel candidate genes for these disorders, we compiled data on gene–functional (20) and disease–phenotypic (21) associations of these disease genes from two recent studies. In 27 patients (Supplementary Table S3), single or multiple mtDNA deletions were detected with polymerase chain reactions (PCRs) and compared through Southern blot analysis using established protocols (22). Written consent was obtained from the patient’s families and the study was approved by the institutional review boards. DNA samples were available only from index cases and not their family members. We also studied 12 healthy controls and a haploid sample (Coriell Repository: NA7489a).
Custom-designed Affymetrix resequencing array and DNA sample preparation
We designed a medical resequencing array (Affymetrix Inc., CA) for DNA sequencing of the entire coding region and exon-splice sites of the 39 candidate genes (452 exons; 106 337 bases). We downloaded exon sequences from Ensembl’s Martview (NCBI Build 36) and designed oligo primers (Supplementary Table S4) using automated Primer3 (http://primer3.sourceforge.net). Shorter exons separated by short introns were paired and amplified together as one amplicon, and longer exons (>600 bp) were amplified using multiple overlapping amplicons resulting in 438 unique amplicons. These were PCR-amplified using AmpliTaq Gold DNA Polymerase (Applied Biosystems) and established protocols in each sample and analyzed using both resequencing arrays and bidirectional Sanger capillary sequencing. In addition, all identified non-synonymous DNA variants were verified by a second round of Sanger sequencing from a newly amplified PCR product. To obtain sufficient amounts of starting material from genomic DNA (∼100 ng), we performed whole genome amplification (WGA) using the REPLI-g Mini Kit (Qiagen, Inc., CA) following Qiagen’s protocol. DNA amounts were quantified using PicoGreen reagent (Invitrogen, Inc., CA). The PCR amplicons for each sample were inspected by 1.2% Agarose gel electrophoresis, pooled together in equimolar amounts and then purified using the QIAquick PCR Purification Kit (Qiagen, Inc., CA). Array processing was performed according to Affymetrix’ user manuals.
Overview of the SRMA algorithm
For each nucleotide position i and each array j, we obtained eight numbers, which are log2 probe intensities and denoted by (θ0,+, θ1,+, θ2,+, θ3,+) and (θ0,–, θ1,–, θ2,–, θ3,–), where 0 denotes the reference match (RM) probe and 1, 2 and 3 denote the three alternative match (AM) probes, respectively. We kept sense (+) and antisense (–) values separate as they provide correlated but also different informative signals (23,24). An example of θ’s on sense strand is shown in Figure 1. SRMA performs base-calling in the following steps.
Figure 1.

Probe intensity data for array-based resequencing in three regions. In each region, the log2 intensities of four probes for the sense strand in 15 consecutive base positions are depicted. Each point represents one 25mer probe, coded for the base of interest in its center position (T—black circle; G—red square; C—green diamond; A—blue triangle), with reference sequences shown on the top of each panel. The only variants in these regions are at position 8 as confirmed by Sanger sequencing. The heterozygous AG in region (A) has equal intensities in probes RMA and AMG, whereas the heterozygous CA in region (B) has higher intensity in probe RMC than AMA, which in turn is higher than the other AM probes. This suggests region (B) is a harder position to call heterozygous. The homozygous variant GG (versus reference AA) in region (C) causes lower probe intensities in all flanking positions, all of which (RMs and AMs) have one off-center base mismatching the target sequence. This phenomenon is called the footprint effect.
Amplicon pre-processing
We used the R package aroma.affymetrix to read in raw intensity (.CEL) files and to perform data formatting. We implemented one strand base position normalization in aroma.affymetrix. To evaluate the quality and quantity of the amplified targets, we calculated three measures for amplicon k, which are averages of the corresponding strand specific values (denoted by s):
The median of the average (log2) probe intensity: Tk,s=mediani = 1,2,…,Ik(θk,i,0,s + maxa = 1,2,3 θk,i,a,s)/2,
The median of the log ratios: Dk,s = mediani = 1,2, …, Ik(θk,i,0,s – maxa = 1,2,3 θk,i,a,s).
The reference call rate: Rk=#{i: (θk,i,0,+ + θk,i,0,−) > maxa = 1,2,3 (θk,i,a,+ + θk,i,a,−)}/Ik, where Ik denotes the amplicon length and a denotes the alternative alleles.
These three measures together provide quantitative information about the target amplification and hybridization experiments. We used a simple and conservative criterion R < 0.9 to identify failed amplicons that were not suitable for base-calling (Supplementary Figures S2 and S3). In order to remove some of the unwanted array-to-array variations, we performed quantile normalization on log intensities (θ’s) in the quality-controlled data. Log intensities in the failed amplicons are replaced with NA and are not included in the normalization. Because the identity of failed amplicons varies across samples, we divided each array into sets of probes from the 438 amplicons, and performed quantile normalization within each amplicon unit, and across samples with good log intensities.
Clustering of DNA variants
For each nucleotide position i, sample j, alternative allele a and strand s, we computed the differences and the averages of the signal intensities:
| (1) |
| (2) |
It has been shown with SNP arrays that a single-chip Bayes classifier on δ can provide an approximate assignment to the variant classes for all nucleotide positions, and a subsequent multi-chip classification at each position can then designate the exact genotype classes to the biological samples (23,25). Extending this single-chip followed by multi-chip approach, our algorithm has the following steps.
Single-chip model
In chip j (notation dropped below), for each nucleotide position i and alternative allele a, we assess the probability of the position being one of the three variant classes: RR—with two copies of the reference allele; RS—with one copy of the reference allele; and SS—with no copy of the reference allele, given (δa,i,+, δa,i,–) and explanatory variables Xa,i (explained below). We use the following formula for these probabilities:
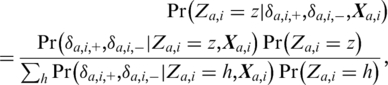 |
(3) |
where Z denotes variant class and the variables X are (functions of) average intensity A, amplicon length, probe GC content and central base pair composition, i.e. the central allele in the probe sequence strand versus the central allele in the target sequence strand. We assume a Gaussian distribution for δa,i given Za,i and Xa,i, and identical and independent distributions for each strand. The prior probabilities for the three variant classes are (0.998, 0.002, 0.000001) assuming an expected variant allele frequency of 0.001 (15) and Hardy–Weinberg Equilibrium.
Based on previous methods in SNP arrays, we account for the effect of X on log ratio δ using linear regression model within each variant class z (23). However, we cannot implement exactly the same EM procedure as that used in (23) for SNP genotyping. Because there are three pairs of log ratios at each base position, we usually do not know the principal non-reference allele, and many fewer data points are present within the non-reference clusters (Supplementary Figure S4). We therefore implemented an iterative procedure: (i) because >99% of the nucleotide positions are expected to be reference, we used data on all positions to estimate the coefficients for Xa,i at Za,i = RR using least squares. (ii) Based on observations in SNP arrays (23), we assume no effect from all the X’s for the RS class, and symmetry about zero for the SS and the RR classes (Supplementary Figure S4). We then calculated the single-chip posterior probabilities shown in Equation (3). (iii) Using the posterior probabilities calculated for all arrays, we choose one alternative allele out of three choices at each position (see ‘From single-chip to multi-chip’ subsection) and then perform (i) and (ii) on only the chosen alternative allele to obtain the final single-chip posterior probabilities and base calls.
The motivation for taking an iterative procedure as described above is that we aim to achieve two tasks at once, namely to distinguish a variant from a reference position and to determine the identity of the alternative allele for a variant. We have no information on either a priori and so first simplify these problems to the reference and fixed alternative alleles and then identify the few variants across all positions. We also observed heteroscedasticity during model fitting and used the weighted least squares method in the second iteration. Our weights come from the variance functions σ2(v) = (b + vc), where v is the fitted value based on ordinary least squares (26). These weights were computed using the R package nlme.
From single-chip to multi-chip
Assuming all variants are bi-allelic, we selected the alternative allele a at each nucleotide position i, in order to later perform genotyping. This selection enriches the variant signals by a factor of three and represents a projection of the six δ’s to the corresponding 2D space, in the case of variants. In heterozygous variants, the δ’s in the other four dimensions present approximately reference signals that are orthogonal to those in the chosen pair of δ’s (Supplementary Figure S5). In homozygous variants, these δ’s present heterozygous signals that are collinear (Supplementary Figure S6). Their contribution to calling homozygous variants will be limited because homozygous variants occur less often than heterozygous variants, and the 2D data alone present strong signals for base-calling. Thus, using single-chip posterior probabilities, we choose the alternative allele as follows:
| (4) |
In other words, we choose the alternative allele that maximizes the expected number of homozygous variants, given the data. We compared our chosen alternative allele with the known alternative at all dbSNP positions that presented variants in our samples (168 in total), and found no errors. For each nucleotide position i, we made an initial genotype designation for each sample j based on their single-chip posterior probabilities. At positions where all samples were designated as RR with the corresponding posterior probabilities >0.999, we concluded they are reference-only without going to the multi-chip model. For the remaining selected positions, we calculated the minor allele count (MAC) as the total number of alternative alleles across all samples.
Multi-chip model
At each of the selected positions, we use a Gaussian mixture model to genotype all samples based on the δa's (sense and antisense strands and selected a, see Figure 3) as previously introduced to microarray analysis (27,28). We considered positions with MAC ≥ 4 as likely common variants and positions with MAC < 4 as likely rare variants. At likely common variant positions, we obtained maximum likelihood estimates for the model parameters (m for the centers and v for the covariance matrices) using the EM algorithm (29). We allowed the orientation, volume and shape of the component distributions to vary, as determined by the covariance matrices (30). We determined the best-fitting model (i.e. a mixture of one, two or three clusters) using the Bayesian information criterion (BIC) (31). This estimation was performed using the R package mclust (32). At likely rare variant positions (MAC < 4), instead of estimating the model parameters with the observed δ’s for the non-reference clusters (a computation highly susceptible to technical errors), we pre-specified the values of these parameters based on the best available knowledge. In particular, we assumed the m for the heterozygous cluster is (0,0) and the m for the homozygous variant cluster is  which is the minus of the average values of
  for observed homozygous reference cluster across all bases. We further assumed the covariance matrices for the non-reference clusters to be identical to the corresponding reference cluster at the same base positions. This is a simple solution to a most important problem in our analysis: finding the true and unknown rare variants without making many false discoveries. As much more sequence data are collected in future, we will be able to formally implement empirical Bayes methods in order to borrow strength from observations in heterozygous and homozygous variant clusters (23). For each selected position i and alternative allele a (notations dropped below), we computed the multi-chip posterior probabilities:
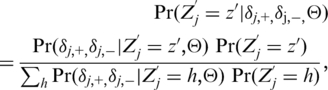 |
(5) |
where Z′ denotes the genotype class: RR, RS and SS genotypes corresponding to the reference allele and the selected a allele, and Θ denotes the parameters (means and covariances) for the mixture components. We assumed bivariate Gaussian distribution for (δj,+, δj,–) given Z′j. The prior probabilities for Z′ are (0.998, 0.002, 0.000001) for unknown variant positions and (0.98, 0.02, 0.0001) for dbSNP positions. We then assigned to each sample the class z′ with the highest posterior probability among all classes.
Figure 3.

Examples on SRMA base-calling using the single-chip (A) and then multi-chip (B–F) procedure. (A) Shown is a smoothed density plot of the log ratio δ’s: θRM – θAM, versus the average intensity A’s: (θRM+θAM)/2 for selected AM’s on a single array, where the darker color indicates higher density of data points. For one position, the X’s in red are where we expect δ to be for the three variant classes RR, RS and SS, respectively. We compared these values to the observed δ (green circle) and called this position as RR. We finalized base-calling at positions (86%) where all samples present high confidence RR calls from the single-chip procedure. We next present five positions highlighted in yellow and of varying shapes (circle, square, diamond, point-up triangle, point-down triangle and star) for this array in (A) and also in individual δ plots (B–F for positions 1–5). These plots represent our multi-chip procedure, which is based on the distribution of δ’s with selected AM’s at one position in all 40 samples. MAC denotes minor allele count. The y-axis is for sense strand (+) and the x-axis is for antisense strand (–). Black is reference, blue is heterozygous variant and red is homozygous variant. The ellipses represent 90% confidence regions of the component distributions in our multi-chip model. (B) Model-based classification across samples identified additional reference-only positions where one cluster of positive δ’s contained all samples. (C) In common SNP positions, each variant cluster contains enough samples to allow our clustering algorithm to estimate the right number of clusters, the varying shapes and locations of the clusters and assign each sample to a cluster. (D) The multi-chip clustering is more accurate than the single-chip calling when the location of δ’s is abnormal. (E, F) In rare SNP positions, we perform classification based on observed reference cluster and pre-specified locations and shapes of the variant clusters. This method identified one or two variant samples (out of 40) as heterozygous and homozygous.
Genotype post-processing
Interpreting clusters as genotypes
We often observe technical artifacts that prevent assigning genotypes to the identified clusters. These include singleton outliers caused by technical errors; multiple clusters for reference samples due to batch effects (23); and two clusters (i.e. heterozygous variant and reference) close to each other due to insufficient discrimination of probes for complete and incomplete hybridizations (Supplementary Figure S7). To accurately identify genotypes from the clusters, we applied constraints on the estimated component distributions. We established four steps with the goal of confining genotype clusters in the upper right corner, around the origin, and the lower left corner, respectively, on a δ plot (Figure 3). These steps are necessary for both common and rare variants and were established using training data from 42 Sanger-sequence exons not used in the validation study. We use (m1, m2, m3) to denote the centers of the three clusters and require: (i) m2 for heterozygous variant cluster and m3 for homozygous variant cluster are smaller than m1 for reference cluster on both strands; (ii) m3 are negative in both strands, and m1 are positive; (iii) the Euclidian distances among the centers and the origin follow ||m1||>||m2||, ||m3||>||m2||, ||m1||>||m1 – m2|| and ||m3||>||m3 – m2||; and (iv) Under Hardy–Weinberg equilibrium, having at least four homozygous variant calls suggest the existence of heterozygous variants, while having n–1 heterozygous calls (n is the total number of samples) and only one reference suggests poor probe performance and that all are reference calls. We will explicitly correct for batch effects and probe performance in our model as more new data become available.
Identifying other technical artifacts
We applied filters for heterozygous calls due to the footprint effect (Figure 1C) and to detect low-homology regions (e.g. pseudogenes), PCR errors or local array defects. In brief, rare heterozygous calls (MAF < 4) in the flanking 24 bp of a homozygous base-call for the same sample are removed if no other homozygous calls are made at those positions. More than two heterozygous calls (MAF < 4) in the same amplicon of one sample were removed. Similar procedures were used for resequencing arrays for haploid genomes (33).
Quality measure for clustering and probe performance
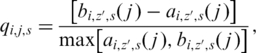
For base i, sample j in a cluster z′, we modified the silhouette width measure (34) to
 |
(6) |
as quality score, where a( j ) is the average distance from j to all points within the cluster z′, and equals 1 when j is the only data point in the cluster; b( j ) is the average distance from j to all data points outside the cluster z′, and equals the average distance to 0 when all data points are in this cluster. We define:
| (7) |
in order to evaluate the underlying probe performance at each nucleotide position. Without taking the minimum across strands, we also derived Qs for sense and antisense strand, respectively.
Among all variant positions identified from the clustering analysis, we changed the calls to ‘N’, when they were (i) identified as technical artifacts, or (ii) had low clustering quality as measured by the score q and the corresponding position was not previously reported (dbSNP v140), or (iii) at positions with low performance of all eight probes as measured by the score Q. In order to maintain a reasonable balance between FDR and FNR, we set as default the quality threshold (0.67) for the turning point on the error curve (Figure 4), which was based on the validation data. We then used this threshold to identify variants in all sequencing data. Our threshold is close to a previously suggested number (0.65) on silhouette score for SNP arrays (25).
Figure 4.

FDR versus FNR for SRMA and GSEQ at varying cutoffs of the quality scores. The cutoffs are 0–1 for the modified silhouette score in SRMA and 0–46 for the quality score (log likelihood ratio) in GSEQ. Each base-caller has three curves: for all SNPs (black), heterozygous SNPs only (blue) and homozygous SNPs only (red). The results for the default cutoffs of 0.67 (diamond) and 3 (circle) are shown for the two base-callers, respectively. As expected, heterozygous SNPs are more difficult to call and have higher error rates than homozygous SNPs. For all three categories, SRMA out-performed GSEQ by at least one order of magnitude.
RESULTS
Array-based sequencing
We sequenced 106 kb (452 exons in 438 PCR-amplicons) in each of 40 samples using both array-based and bidirectional Sanger capillary sequencing. Each array contains ∼850 k 25mer-probes, with eight probes targeting each nucleotide position including four probes for sense and antisense strand. The four probes for each strand differ only at the center positions in A, T, G and C, respectively, and match the reference sequence in the flanking 24 bases. We describe the probes completely complementary to the reference sequence as reference match probes (RMs) and the probes for the other three alternative alleles as alternative match probes (AMs). We expect highest intensities in the probes that are completely complementary to the target sequence. As shown in Figure 1, homozygous reference positions (1–7,9–15) show higher RM than AM intensities in the sense strand, and similarly in the antisense strand (not shown), while a heterozygous variant (Figure 1A and B, position 8) shows higher values for both RM and one of the AM intensities, as compared to those from the rest of the AMs. A homozygous variant position (Figure 1C, position 8) shows an AM intensity higher than those from all other probes. Because differences in the (log2) signal intensities (RM versus AMs) vary across positions and samples, it is difficult to identify true heterozygous positions when there are high AM intensities (Figure 1B). In this study, we demonstrate that by combining statistical modeling with biological knowledge we can accurately identify both homozygous and heterozygous variants at rare variant positions, where supervised learning was not feasible.
Quality assessment
We implemented two steps to assess the quality of array sequence data. First, we verified the signal quality on each array as measured by the average differences of RM and AM intensities (35) (Supplementary Figure S1). Second, because the target sequences are captured as PCR-amplicons, we evaluated the quality and quantity of each amplicon using three measures (Figure 2, see ‘Materials and Methods’ section). These include the reference call rate (R) to measure the general similarity between the amplified sequence and the reference sequence; the median log ratio (D) to measure the average signal-to-noise ratio for an amplicon; and the median average intensity (T) to measure the quantity of each amplicon in array hybridization. In failed or poorly amplified sequences, these measures have low values (R < 0.9, D < 0.9 and T < 9) and are correlated (Figure 2). In well-amplified targets, R is always close to 1 (Supplementary Figure S2), while D and T show a non-linear correlation (Figure 2) representing effects of DNA hybridization kinetics such as DNA quantity and sequence composition. The three measures in comparison provide quantitative and qualitative data on each amplicon, which is useful when monitoring many sample-preparations in parallel.
Figure 2.

Evaluation of PCR amplification products (amplicons) using resequencing arrays. The distribution of the median log ratio D and the median average intensity T for all 17 520 PCR-amplicons (438 amplicons × 40 samples) are shown. The points highlighted in red correspond to amplicons with a lower reference call rate of R < 0.9. All amplicons with the lowest values in D and T coincide with the red points and are removed from the subsequent analysis.
To identify failed PCR-amplifications across all 17 520 amplicons (438 amplicons in 40 samples), we defined the conservative criteria for the success of target amplifications as R < 0.9. This measure is based on estimated variant frequencies in protein-coding regions of diploid genomes, with >99% of all positions being reference bases. We evaluated this cutoff by manual inspections of gel-electrophoresis data of 5694 amplicons (438 amplicons in 13 samples, Supplementary Figures S2 and S3). Based on R < 0.9, we identified a total of 726 failed amplicons (4.1%) in all 40 samples, which approximates 18 amplicons per array. The 726 amplicons included 697 (3.9%) amplicons with low values in D (<0.9) and T (<9), but also 29 (0.2%) amplicons with higher values in D or T which may indiciate amplification of homologous sequences. Following our quality screening, 96% of all sample amplicons (16 794/17 520) proceeded to sequence data analysis and base-calling.
DNA sequence base-calling
The SRMA base-caller was developed using 42 exons (training set) and validated on additional 67 randomly selected exons (test set). We independently (in a blinded manner) inspected the bidirectional Sanger traces in both sets in order to provide reference data for our algorithm. SRMA was then applied to the entire quality-controlled data for variant finding. For each nucleotide position and each array, we calculated six log ratios for RM and AM probes; one for each of the three alternative alleles per strand. The genetic variation in a body of sequence data can be summarized by the nucleotide variation within each sample and measured by the variant frequency (typically <1 per 1000 bp), while the variation across samples at each variant nucleotide position is measured by the MAF with the two categories of common (MAF ≥ 5%) and rare (MAF < 5%) variants. Accordingly, we first utilized a single-array multi-position Gaussian mixture model to highlight likely variant positions, and adjusting for explanatory variables such as average intensity, GC-content and probe base-pair composition (Figure 3A). We then used a single-position multi-array Gaussian mixture model based on a selected alternative nucleotide (Figure 3B–F, Supplementary Figures S5 and S6) to identify the exact variant samples at the variant positions. Within a rare variant position, the low population frequency precludes using training data with samples of known variant genotypes to derive the genotype specific distributions of log ratios as utilized in SNP arrays (23). On the other hand, when only a few variant samples present log ratios that are different from those of the reference samples (Figure 3E and F), these outliers are often confounded with technical variations. To overcome this, we determined how many variant samples are expected at a position using single-array initial calls. We then used different estimation procedures for the likely common and the likely rare variant positions (see examples in Figure 3). The multi-array classification results are susceptible to batch effects presenting multiple clusters for the reference samples (23), and to weak probe performance making the heterozygous samples more similar to the reference samples (Supplementary Figure S7). We inferred genotypes from the classification results using constraints on the location of the genotype groups to merge reference clusters, and by leveraging information from high confidence homozygous variant calls to identify additional heterozygous variants based on Hardy–Weinberg equilibrium.
In some instances we identified strings of heterozygous calls within neighboring positions in one sample. This may occur due to a ‘footprint’ effect incorrectly depressing reference base signals neighboring a homozygous variant position (Figure 1C), PCR errors that passed our quality controls or other array-specific defects (Supplementary Figure S8). We applied filters to recognize the known patterns of these artifacts and to remove the corresponding variant calls (see ‘Materials and Methods’ section). Visual inspection of Sanger traces for these positions (total 472) identified only a single true heterozygous variant, which was confounded by artifactual variant signals in this sample. Finally, we used two quality measures to rank the confidence of each base-call. The score q was used to evaluate the quality of base-calls for each position and sample, while score Q is used to measure the probe-performance at each position (four probes/strand). Measuring the ability of probe quartets to discriminate between reference and alternative base signals is important (Supplementary Table S7), because the inherent design of resequencing arrays require the tiling of all probe sequences to complement a reference. Our position-specific Q score identified 5.7% of all nucleotide positions with at least one probe quartet with suboptimal performance. At these positions, SRMA base-calling is still possible when all samples are reference. Only 0.4% of all positions had both probe quartets affected. The main steps and the number of bases processed in SRMA are shown in Supplementary Figure S9.
Accuracy of base-calling in the validation data
We assessed the accuracy of SRMA and the current most commonly used algorithm GSEQ (12,36) by comparing all quality-controlled base-calls to visually inspected Sanger sequence (674 kb; Supplementary Table S5), which included 371 variant calls across samples (5.5 × 10⁻⁴ per base) corresponding to 52 unique positions (3 × 10⁻³ per position). We measured the performance at various thresholds by: (i) the proportion of variant calls in the Sanger sequence that were called as either reference or ‘N’ due to low confidence by the array base-caller (FNR); and (ii) the proportion of array variant calls that were called as reference bases in Sanger sequencing (FDR). Similar to previous studies (4,14), we based our validations on base-calls in each sample (sample-positions), as compared to unique base positions across a number of samples. Overall, SRMA made more reliable base-calls than GSEQ, while substantially reducing the FNR and FDR (Figure 4). At the default thresholds of 0.67 for SRMA and 3 for GSEQ (see ‘Materials and Methods’ section), the estimated call rates (proportion of reliable calls among all sequences) were 99.86 versus 96.8%; the estimated FDR was 2 versus 58%; and the FNR was 5 versus 28%. SRMA found all Sanger-identified variant positions, with eight additional positions as false discoveries (Table 1). At a higher score threshold of 0.78, 13% of Sanger variants were called as reference or ‘N’ without false discoveries. The missed calls were from four unique positions (8% of variant positions) with one being a common SNP (MAC ≥ 4) and three being rare variants (MAC < 4). As expected, SRMA achieved a lower FDR (0.01) for homozygous than for heterozygous calls at the default threshold 0.67 with zero false negatives (Figure 4, Table 1).
Table 1.
Validation of the SRMA base-caller
| Call rate | FPR | FDR | FNR | |
|---|---|---|---|---|
| SNP sites | 1.00 | 4.6 × 10⁻⁴ | 0.13 | 0 |
| SNP calls | 0.9986 | 1.2 × 10⁻⁵ | 0.02 | 0.05 |
| Heterozygous calls | 0.03 | 0.07 | ||
| Homozygous calls | 0.01 | 0 |
The validation data include 67 randomly selected exons with manually inspected Sanger traces (674 kb; 17 551 positions). Sanger sequencing identified 371 sample-positions from 52 unique positions and called the remaining sequences (∼674 kb) as reference. Based on this data, SRMA made reference calls at 19 heterozygous sample-positions, all of which are for only one common SNP position, which was found heterozygous in Sanger analysis. However, SRMA identified the same position through homozygous variant calling in the other 10 variant samples. In total, SRMA had eight false positive calls out of 674-kb references, with one false variant sample call per position. These eight positions represent the difficulty in accurate resequencing, which is to differentiate between rare variants and technical errors, both occurring at low frequencies.
At the SRMA default threshold, 99.99% (674 249) of the base-calls were identical to Sanger calls, with only 37 discordant calls between the two methods. These included 10 homozygous calls at three positions (10% of all homozygous calls) that SRMA misclassified as heterozygous variants, and eight false positive calls (seven heterozygous and one homozygous) at eight unique positions with one false positive per position (Supplementary Figures S10–S17). In contrast, the 19 false negative calls, all of which were true heterozygous for the same common SNP position, presented very similar signals as the reference samples (Supplementary Figure S18) and were therefore missed. In summary, the accuracy of array-based sequencing is limited by the number of technical variations giving signals highly similar to those of rare variants, and by heterozygous positions presenting with signals similar to reference signals.
Accuracy of base-calling and SNP detection in all data
We assessed the accuracy of SNP detection by comparing all SRMA variant calls to manually inspected positions in the corresponding Sanger traces. At default threshold (see ‘Materials and Methods’ section), SRMA predicted 2326 variant sample-positions (366 unique positions, Table 2) and we confirmed 2186 true variant calls (FDR 6%). These included 118 (5.5%) sample-positions that SRMA misclassified between homozygous and heterozygous variants. Notably, most of the correctly detected non-dbSNPs (35% of all variant sites) had a moderately rare minor allele (MAC < 4), which included 72 (81%) singleton heterozygous variants (MAC = 1). In contrast, most false positives occurred at positions with only one variant sample, which is consistent with findings in our validation data. Cross hybridization between similar probes is a possible explanation for false positive base-calls. We found 10 of 69 false positive positions (Supplementary Table S7) with probe sets of ≥23 bases matching another probe set, while only 2 of 259 true positive positions had similar probes (P < 0.001).
Table 2.
Variant count spectrum in 39 candidate genes and 40 samples
| MAC |
|||||
|---|---|---|---|---|---|
| 1 | 2 | 3 | ≥4 | Total | |
| Total SRMA SNPs | 166 | 33 | 17 | 112 | 328 |
| Total SNPs found | 103 | 30 | 16 | 110 | 259 |
| dbSNPs found | 31 | 17 | 12 | 110 | 170 |
| Non-dbSNPs found | 72 | 13 | 4 | 0 | 89 |
| False discoveries | 63 | 3 | 1 | 2 | 69 |
SRMA identified 366 variant positions, among which 338 had Sanger traces available for inspection, and including 10 positions identified as insertion/deletions. The MAC represents the number of times the variant allele is detected in all samples. The ‘found SNPs’ (259 in total) are positions with at least one variant call confirmed by Sanger sequencing. A comparison with dbSNP identified 89 (34%) novel SNPs, all of which had MAC <4 (i.e. MAF <0.05). The false discoveries (69 in total) are positions marked by our algorithm but unconfirmed in Sanger sequence analysis. A majority of these positions (97%) had less than four alternative alleles, which demonstrates the challenge in discriminating between technical errors and true rare variant positions.
We also analyzed the performance of SRMA for common variants using Sanger verification. Of 805 dbSNPs reported in our sequences, we selected 76 positions with a MAF ≥ 0.05 in our study population (CEU) and confirmed 74 positions using both methods. Only one position (rs11085147, MAF = 0.11) did not present any variant samples in our data, while one other position (rs495935, MAF = 0.075) was missed by SRMA at the default threshold. This position contained three variant heterozygous samples that were initially called as variants, but subsequently marked as N’s because the position-specific quality score was below the default threshold, suggesting suboptimal probe performance.
Finding insertion and deletions
SRMA identified several small-scale insertion and deletions (indels) including a rare 1bp heterozygous deletion (Supplementary Figure S19), a common 1bp insertion (rs33964928, Supplementary Figure S20), and a common 4-bp deletion (rs10568542, Supplementary Figure S21) by calling these as heterozygous variants. Because small-scale deletions present strings of heterozygous calls, those with low population frequencies may be confounded with our filters for technical artifacts. To evaluate the impact of such confounding, we visually inspected the Sanger traces for the 52 strings (472 positions) filtered out by SRMA and found no additional insertions or deletions at these positions. In summary, small-scale indels in diploid genomes can be detected by resequencing arrays, while follow-up sequencing is required to identify their architecture.
Analysis of DNA variants in the study population
Our ad-hoc criterion (MAC < 4) for deciding how to proceed in multi-chip analysis depends on the crude base-calls from a single-chip analysis, which carries some level of uncertainty. As a sensitivity analysis, we used a criterion that is less stringent on the confidence of single-chip base-calls and results in performing EM at more positions. This procedure had improved performance in detecting true common variants at MAC>= 4 (FNR = 0), but resulted in a slightly higher number of false positives as more technical errors were called as rare variants in our validation data. We selected this less stringent criterion to record all potential variants in our study population for new biomedical discoveries. SRMA predicted 375 unique DNA variants (2740 sample-positions) with a FDR of 9% based on careful inspections of each variant in the corresponding Sanger traces (Supplementary Table S6). In our analysis we focused on non-synonymous variants, splice site mutations, and small insertions and deletions (indels) in protein coding regions and removed all variants identified in the 13 control samples. In the medical cases only, we detected in total 58 non-synonymous variants (69 sample-positions) that included nine dbSNP positions (17 sample-positions) indicating that most variants are rare singletons. We confirmed more than half of these variants (33 out of 58) in Sanger analysis, while 17 positions could not be confirmed and for eight positions Sanger traces were not available. A heterozygous SRMA variant was identified as a one-base deletion (A–) in Sanger trace inspections.
Our study included eight cases (P01–08) with known mutations in the polymerase gamma (POLG) gene serving as positive controls (Figure 5). Array-based sequencing confirmed all mutations in four cases (P01 homozygous, P04 and 07 compound heterozygous, and P06 heterozygous), while in two cases one of two compound heterozygous variants was missed by the array but confirmed in Sanger analysis (P02 p.A467T; P03 p.R627Q). Lowering the threshold of the array quality measures would have detected the heterozygous p.R627Q in P03. In both of the remaining two positive control cases (P05 and P08), we could not confirm one of the two previously reported heterozygous variants at position p.R627Q using either array or Sanger sequencing from newly amplified PCR products. This result may be explained by allele-specific amplification. Another difference to previous findings was a heterozygous p.R1096H in P05 that we found as a homozygous variant. In addition to the above cases, we studied 19 cases (P09–27) presenting with mtDNA maintenance disorders but unknown gene defects. In 15 of these cases, we found 19 different DNA variant positions (23 sample-positions).
- (i) DNA variants in genes previously associated with mtDNA maintenance disorders:
- (a) POLG: We found a heterozygous p.A467T in P14, which is a common POLG mutation that was also confirmed in P01 and P02. This mutation is mostly recessive and unlikely to cause disease by itself (http://tools.niehs.nih.gov/polg). We did not detect a second variant in this or other genes in P14. In P18 we found a homozygous p.R1146C, which is a neutral polymorphism (rs2307440), while one study reported it as a heterozygous variant suggesting a moderate biochemical effect (37). PolyPhen, a computational tool to predict the impact of amino acid substitutions on protein structure and function (38), predicted p.R1146C as ‘probably damaging’ (score 2.2), which is on average higher than all known POLG disease mutations (Supplementary Figure S22). A novel heterozygous variant p.Y282D in P21 located at a conserved position in the exonuclease domain is probably damaging (3.4).
- (c) C10orf2: A heterozygous p.V368I was detected in P25 and P27, which is a neutral polymorphism (rs2307440) and predicted benign (0.1) and showed no segregation with the disease phenotype in autosomal dominant progressive external ophthalmoplegia (39).
- (d) SUCLA2: We identified a novel heterozygous p.R17G in P09, which is located at a highly conserved position 17 in the mitochondrial transit peptide sequence (position 1–60) of the Succinyl-CoA ligase beta subunit and predicted as probably damaging (2.3). An analysis for subcellular targeting using Predotar (40) showed a significant difference for the variant protein (0.46 mitochondrial, 0.49 elsewhere; Prediction: possibly mitochondrial) in comparison to the reference sequence (0.68 mitochondrial, 0.28 elsewhere; Prediction: mitochondrial). Subcellular mislocalization due to missense mutations in protein target signals was shown in other disorders (41).
- (e) POLG2: A heterozygous p.G416A was detected in P16 and P20, which is a neutral polymorphism (rs17850455) and predicted as possibly damaging (1.9). A biochemical analysis of the mutant protein showed no alteration in its chromatographic properties (42).
- (ii) DNA variants in disease genes with suspected functions in mtDNA maintenance:
- (a) GFM1: This gene encodes a mitochondrial translation elongation factor. We found a heterozygous p.N43D in P23, which is reported as polymorphisms (rs35942089) and predicted benign (0.5).
- (b) MUTYH: In P20, a novel heterozygous single base deletion (A–) was identified at cDNA position 1307 causing an amino acid substitution p.E364D (codon: GAA-GAC), frameshift and premature termination (TGA) at peptide position 393 (p.E364Dfs393X). This mutation truncates the wild-type peptide involving the DNA-Glycosylase-C domain, and may lead to nonsense-mediated mRNA decay. Another novel heterozygous MUTYH variant (p.S501F) that is predicted benign (1.3) was found in P17. P17 also carried a heterozygous and possibly damaging (1.8) SNP p.Q324H (rs3219489).).
Figure 5.

Candidate gene analysis of mtDNA maintenance disorders. (A) The 39 genes include 10 genes causing mtDNA maintenance disorders (green nodes), 15 disease genes with suspected functions in mtDNA metabolism and/or similarities in their disease phenotypes (purple nodes), and 14 non-disease candidate genes with functions in mtDNA maintenance (grey nodes) (Supplementary Table S2). Gene relationships are predicted through functional interactions (likelihood ratios; LR) (20) and disease-phenotypic similarities (quantitative phenotypic associations; QPA) (21) with the edge colors: red—gene pairs with highest correlation of LR and QPA; blue—gene pairs with LR only; and orange—gene pairs with QPA only (≥0.4). The six genes at bottom left have multiple functional interactions to this network through intermediate genes (data not shown). Five disease genes (asterisk) are associated with dominant inheritance patterns and four of these genes (C10Orf2, OPA1, POLG, SLC25A4) are also causing recessive disorders (17,18). In this study we identified novel DNA variants in several cases in POLG, APEX2, MUTYH, TOP1MT (underlined). (B) The table shows amino acid changes (acronym p. not shown) identified in only the 23 cases and not controls. Five of these 14 genes (in bold) are known to cause mtDNA maintenance disorders (green nodes in A). The color codes indicate PolyPhen’s functional predictions (38) with ‘possibly damaging’ (yellow) and ‘probably damaging’ (orange), while all other amino acid changes are predicted benign (Supplementary Table S6). Positions that escaped array detection are shown in parenthesis, (asterisk) indicate dbSNP positions, and (caret symbol) are cases with rare variants in multiple genes hypothesizing a synergistic effect on the disease phenotype.
We further detected novel heterozygous variants that are predicted benign in SPAST in P22 (p.I163T, score 0.3), and in SURF1 in P15 (p.N249D, score 0.8).
- (iii) DNA variants in non-disease candidate genes with functions in mtDNA maintenance:
- (a) APEX2: This gene is involved in post-replicative nuclear and mitochondrial base excision repair. We identified a novel homozygous p.H269Y in P22, which is located in the conserved endo-exonuclease-phosphatase domain and possibly damaging (1.9). In addition we found a novel homozygous variant p.N392H (PolyPhen 1.8) in P05; a case which also carried compound heterozygous POLG mutations.
- (b) LIG3: DNA ligase 3 is thought to function in mitochondrial base excision repair (43) and interacts with POLG. A novel heterozygous p.Y768H was found in P12, which is located in the highly conserved ATP-dependent DNA ligase C terminal region and possibly damaging (2.0).
- (c) LONP1: LONP1 functions in mitochondrial proteolysis and catalyzes the initial steps of protein degradation. We identified novel homozygous p.V675L in P09 and P17 located at a moderately conserved position in the ATPase-AAA-core domain and predicted benign (0.2). In addition, we found the known p.V911I polymorphism (rs1062373) as a heterozygous variant in P05, P19, P21, and homozygous in P01, which is predicted benign (0.8).
- (d) PPID: In P21, we found a heterozygous p.V177I (rs61756415) that is predicted benign (0.4).
- (e) TOP1MT: Mitochondrial topoisomerase 1 consists of 14 exons encoding a 601 amino acid peptide, which controls the mtDNA topology during transcription. In P22 we identified a novel heterozygous nonsense mutation p.Q172X in exon 5 (c.533C > T) causing a termination (CAA-TAA) at peptide position 172 likely leading to a truncated product and nonsense-mediated mRNA decay. We further identified a novel heterozygous p.R571W in P13, which is predicted probably damaging (2.4), and a novel heterozygous p.Q171R in P05 that is predicted benign (1.4). P05 and P13 also had a heterozygous non-synonymous SNP p.R525W (rs2293925), and P13 and P22 a heterozygous variant p.V256I (rs11544484), both of which are predicted benign (0.1 and 0.5, respectively). These two SNPs were also detected in several controls (Supplementary Table S6). In P22 we also detected three synonymous SNPs in a heterozygous state (rs61631623, rs2450772, rs11544482) making an intragenic deletion in trans adjacent to p.Q172X less likely. Haplotype insufficiency was proposed as a disease cause in mtDNA maintenance disorders [POLG2 (44)] but we did not find support for such mechanism for TOP1MT homologues in other organisms such as yeast (45).
DISCUSSION
The identification of rare functional DNA variants (MAF < 1%) requires the application of high quality DNA sequencing to well-phenotyped disease populations. These will often include sporadic cases due to purifying selection against high-risk alleles. Here we analyzed 39 candidate genes for mtDNA maintenance disorders (Supplementary Table S2) with a custom resequencing array and confirmatory Sanger sequencing. We studied 27 medical cases with these rare disorders in comparison to 13 controls and data from dbSNP. To identify DNA variants in each sample with a minimal number of false discoveries, we developed a novel statistical method that builds on the success in microarray data analysis and SNP genotyping (23,25,27,28). In this context, SRMA accounts for technical limitations such as differences in average probe intensities, base pair composition, GC content and amplicon length. In addition, while SNP arrays typically contain only two probes per base with optimal probe performance, resequencing arrays require querying all four alleles at each base position (Figure 1) in order to detect rare and unknown sample variants (expected <1 variant/1 kb). Our novel base-caller utilizes mixture models at two different data levels: (i) across all bases within a single array to predict variant positions, and (ii) for a single base across all arrays to accurately identify all variant samples at this position (Figure 3). More than 97% of the initially predicted variant positions were removed through multi-array analysis. In addition, we ranked the confidence of each base-call using a position-specific quality score measuring a probe’s ability to discriminate between a variant and reference signal. Only 0.4% of all nucleotide positions had probe sets with suboptimal performance on both sequenced strands. Our QC and genotype post-processing contains numbers that represent an optimal balance between false negative and false positive discoveries in our training data (5694 amplicons; 500 kb). We generated this extensive data set through gel-electrophoresis experiments and manual Sanger sequence analysis (Figure 2, Supplementary Figures S2 and S3). Overall, SRMA detected variant positions with only one, two or three heterozygous variant samples (MAF: 1.25–3.75%), with on average 96% target sequence coverage per sample. With increased sample size and only one array per sample (2× sequence coverage), SRMA will have the power to identify very rare variants with MAF of 1% or less.
Array-based sequencing predicted 375 variant positions (2740 sample-variants, Supplementary Table S6) including 31 non-synonymous variants detected in only the medical cases (Figure 5). Each sample-variant was verified through Sanger sequencing. In the eight positive control cases with known POLG mutations (P01–08), SRMA missed only one of two heterozygous variants in each of two samples (P02 p.A467T; P03 p.R627Q). In case P05 we identified additional novel variants in two candidate genes: APEX2 (p.N392H) and TOP1MT (p.Q171R). PolyPhen, a computational tool that we evaluated for functional effects of DNA variants (Supplementary Figure S22), predicted the APEX2 variant as possibly damaging. Another case (P22) with a predicted functional homozygous APEX2 variant (p.H269Y) also carried a heterozygous nonsense mutation in TOP1MT (p.Q172X) removing two thirds of this gene product including the catalytic topoisomerase domain. Another conserved missense variant in TOP1MT (p.R571W) was found in P13. In addition, we detected a heterozygous single base deletion (A–) in MUTYH (P20) causing a frameshift and stop at the conserved DNA-Glycosylase-C domain (p.E364Dfs393X). Decreased expression levels and DNA repair capability of MUTYH has been proposed as a cause of mtDNA damage in aged rodent retinal pigment epithelium (46). Notably, MUTYH is associated with inherited colorectal tumors (47), which immediately provides new candidate genes from this mtDNA maintenance network for the study of human cancers. Another mitochondria-related gene associated with cancer and mtDNA depletion is TP53 (48), while fumarate hydratase (FH) and the RNA component of mitochondrial RNA processing endoribonuclease (RMRP) are examples of genes causing both cancer and other diseases. Although no unequivocal biallelic mutations were detected, rare variants in the gene’s promoter and control regions cannot be ruled out, and considering that five of the known disease genes are linked to dominant traits (18) (Figure 5), our results prioritize APEX2, MUTYH and TOP1MT as new disease candidate genes for mtDNA maintenance disorders. Studies of other cases and functional validations are now indicated, which is particularly challenging in cases carrying rare heterozygous variants in multiple genes (2,49,50). At present, no experimental approach exists to quantitatively measure the combined phenotypic effects of multiple alleles in an individual. A number of functional variants in different genes may be compatible with normal existence (51) but it is conventional to believe that these defects are more likely pathologic in functionally interacting genes.
Approximately 20–30% of the individuals with mtDNA maintenance disorders remain without diagnosis (17,18). Our results highlight the need for high quality resequencing of multiple candidate genes in these diseases. In order to make a prediction as to which methods may be best applied for such studies, we compared the performance of current high-throughput technologies. The accuracy of array-based sequencing with SRMA (FDR 2–6%, FNR ∼5%; Figure 4) is higher than for automated Sanger sequence analysis [FDR 13%, FNR 3%; (4)], and comparable to second-generation sequencing platforms with either optimal coverage [FDR 2–8%, FNR 0–3%; (14)], or minimal coverage and improved base-calling [FDR <10%, FNR ∼5%; (52)]. The newer platforms are promising tools for large-scale exome and whole-genome analysis (53), while resequencing arrays could provide a robust and cost-effective alternative in some applications (54). These include the clinical resequencing of candidate genes in individuals with a specific disorder with the flexibility to introduce additional arrays over time. We sequenced samples in parallel (20 arrays/fluidics station/day) and quickly identified sample processing failures (Figure 2). SRMA was computationally efficient by calling each base in all samples in ∼0.1 s. Further increase in throughput, at reduced costs, could be achieved with targeted multiplex amplification (55) of hundreds of candidate genes coupled with second-generation resequencing arrays (>500 genes/array) (13). In these array applications, our new methods can be used for monitoring sample preparations and for resequencing (unpublished results). As more medical cases are analyzed, the accuracy of DNA variant discovery will continuously improve through an iterative model-training process.
ACCESSION NUMBERS
ArrayExpress accession: E-MTAB-346.
SUPPLEMENTARY DATA
Supplementary Data are available at NAR Online.
FUNDING
National Eye Institute grant (R01EY016240 to R.W.D. and C.S.); T.K. is a member of MitoNET funded by the German Ministry of Education and Research (BMBF). Funding for open access charge: National Institutes of Health.
Conflict of interest statement. None declared.
ACKNOWLEDGEMENTS
The authors thank Marcus Yu and Marilyn Fukushima for experimental support, Anjo Chi for help in preparing supplemental material, Henrik Bengtsson for extending aroma.affymetrix to resequencing arrays, Chunlin Wang and Weihong Xu for bioinformatics support, and Nancy Zhang, Pierre Neuvial, Martin O’Hely and Marian Thieme for questions and comments.
REFERENCES
- 1.Botstein D, Risch N. Discovering genotypes underlying human phenotypes: past successes for mendelian disease, future approaches for complex disease. Nat. Genet. 2003;33(Suppl.):228–237. doi: 10.1038/ng1090. [DOI] [PubMed] [Google Scholar]
- 2.Bodmer W, Bonilla C. Common and rare variants in multifactorial susceptibility to common diseases. Nat. Genet. 2008;40:695–701. doi: 10.1038/ng.f.136. [DOI] [PMC free article] [PubMed] [Google Scholar]
- 3.Shendure JA, Porreca GJ, Church GM. Overview of DNA sequencing strategies. Curr. Protoc. Mol. Biol. 2008 doi: 10.1002/0471142727.mb0701s81. Chapter 7, Unit 7.1. [DOI] [PubMed] [Google Scholar]
- 4.Stephens M, Sloan JS, Robertson PD, Scheet P, Nickerson DA. Automating sequence-based detection and genotyping of SNPs from diploid samples. Nat. Genet. 2006;38:375–381. doi: 10.1038/ng1746. [DOI] [PubMed] [Google Scholar]
- 5.Chee M, Yang R, Hubbell E, Berno A, Huang XC, Stern D, Winkler J, Lockhart DJ, Morris MS, Fodor SP. Accessing genetic information with high-density DNA arrays. Science. 1996;274:610–614. doi: 10.1126/science.274.5287.610. [DOI] [PubMed] [Google Scholar]
- 6.Warrington JA, Shah NA, Chen X, Janis M, Liu C, Kondapalli S, Reyes V, Savage MP, Zhang Z, Watts R, et al. New developments in high-throughput resequencing and variation detection using high density microarrays. Hum. Mutat. 2002;19:402–409. doi: 10.1002/humu.10075. [DOI] [PubMed] [Google Scholar]
- 7.Hacia JG, Sun B, Hunt N, Edgemon K, Mosbrook D, Robbins C, Fodor SP, Tagle DA, Collins FS. Strategies for mutational analysis of the large multiexon ATM gene using high-density oligonucleotide arrays. Genome Res. 1998;8:1245–1258. doi: 10.1101/gr.8.12.1245. [DOI] [PubMed] [Google Scholar]
- 8.Mandal MN, Heckenlively JR, Burch T, Chen L, Vasireddy V, Koenekoop RK, Sieving PA, Ayyagari R. Sequencing arrays for screening multiple genes associated with early-onset human retinal degenerations on a high-throughput platform. Invest. Ophthalmol. Vis. Sci. 2005;46:3355–3362. doi: 10.1167/iovs.05-0007. [DOI] [PubMed] [Google Scholar]
- 9.Lebet T, Chiles R, Hsu AP, Mansfield ES, Warrington JA, Puck JM. Mutations causing severe combined immunodeficiency: detection with a custom resequencing microarray. Genet. Med. 2008;10:575–585. doi: 10.1097/gim.0b013e31818063bc. [DOI] [PubMed] [Google Scholar]
- 10.Waldmuller S, Muller M, Rackebrandt K, Binner P, Poths S, Bonin M, Scheffold T. Array-based resequencing assay for mutations causing hypertrophic cardiomyopathy. Clin. Chem. 2008;54:682–687. doi: 10.1373/clinchem.2007.099119. [DOI] [PMC free article] [PubMed] [Google Scholar]
- 11.Szoke D, Molnar B, Solymosi N, Racz K, Gergics P, Blasko B, Vasarhelyi B, Vannay A, Mandy Y, Klausz G, et al. Polymorphisms of the ApoE, HSD3B1, IL-1beta and p53 genes are associated with the development of early uremic complications in diabetic patients: results of a DNA resequencing array study. Int. J. Mol. Med. 2009;23:217–227. [PubMed] [Google Scholar]
- 12.Cutler DJ, Zwick ME, Carrasquillo MM, Yohn CT, Tobin KP, Kashuk C, Mathews DJ, Shah NA, Eichler EE, Warrington JA, et al. High-throughput variation detection and genotyping using microarrays. Genome Res. 2001;11:1913–1925. doi: 10.1101/gr.197201. [DOI] [PMC free article] [PubMed] [Google Scholar]
- 13.Zheng J, Moorhead M, Weng L, Siddiqui F, Carlton VE, Ireland JS, Lee L, Peterson J, Wilkins J, Lin S, et al. High-throughput, high-accuracy array-based resequencing. Proc. Natl Acad. Sci. USA. 2009;106:6712–6717. doi: 10.1073/pnas.0901902106. [DOI] [PMC free article] [PubMed] [Google Scholar]
- 14.Harismendy O, Ng PC, Strausberg RL, Wang X, Stockwell TB, Beeson KY, Schork NJ, Murray SS, Topol EJ, Levy S, et al. Evaluation of next generation sequencing platforms for population targeted sequencing studies. Genome Biol. 2009;10:R32. doi: 10.1186/gb-2009-10-3-r32. [DOI] [PMC free article] [PubMed] [Google Scholar]
- 15.Wang DG, Fan JB, Siao CJ, Berno A, Young P, Sapolsky R, Ghandour G, Perkins N, Winchester E, Spencer J, et al. Large-scale identification, mapping, and genotyping of single-nucleotide polymorphisms in the human genome. Science. 1998;280:1077–1082. doi: 10.1126/science.280.5366.1077. [DOI] [PubMed] [Google Scholar]
- 16.Van Goethem G, Dermaut B, Lofgren A, Martin JJ, Van Broeckhoven C. Mutation of POLG is associated with progressive external ophthalmoplegia characterized by mtDNA deletions. Nat. Genet. 2001;28:211–212. doi: 10.1038/90034. [DOI] [PubMed] [Google Scholar]
- 17.Poulton J, Hirano M, Spinazzola A, Arenas Hernandez M, Jardel C, Lombes A, Czermin B, Horvath R, Taanman JW, Rotig A, et al. Collated mutations in mitochondrial DNA (mtDNA) depletion syndrome (excluding the mitochondrial gamma polymerase, POLG1) Biochim. Biophys. Acta. 2009;1792:1109–1112. doi: 10.1016/j.bbadis.2009.08.016. [DOI] [PubMed] [Google Scholar]
- 18.Spinazzola A, Zeviani M. Disorders from perturbations of nuclear-mitochondrial intergenomic cross-talk. J. Intern. Med. 2009;265:174–192. doi: 10.1111/j.1365-2796.2008.02059.x. [DOI] [PubMed] [Google Scholar]
- 19.Suomalainen A, Kaukonen J. Diseases caused by nuclear genes affecting mtDNA stability. Am. J. Med. Genet. 2001;106:53–61. doi: 10.1002/ajmg.1379. [DOI] [PubMed] [Google Scholar]
- 20.Franke L, Bakel H, Fokkens L, de Jong ED, Egmont-Petersen M, Wijmenga C. Reconstruction of a functional human gene network, with an application for prioritizing positional candidate genes. Am. J. Hum. Genet. 2006;78:1011–1025. doi: 10.1086/504300. [DOI] [PMC free article] [PubMed] [Google Scholar]
- 21.Scharfe C, Lu HH, Neuenburg JK, Allen EA, Li GC, Klopstock T, Cowan TM, Enns GM, Davis RW. Mapping gene associations in human mitochondria using clinical disease phenotypes. PLoS Comput. Biol. 2009;5:e1000374. doi: 10.1371/journal.pcbi.1000374. [DOI] [PMC free article] [PubMed] [Google Scholar]
- 22.Ferlin T, Guironnet G, Barnoux MC, Dumoulin R, Stepien G, Mousson B. Detection of mitochondrial DNA deletions by a screening procedure using the polymerase chain reaction. Mol. Cell. Biochem. 1997;174:221–225. [PubMed] [Google Scholar]
- 23.Carvalho B, Bengtsson H, Speed TP, Irizarry RA. Exploration, normalization, and genotype calls of high-density oligonucleotide SNP array data. Biostatistics. 2007;8:485–499. doi: 10.1093/biostatistics/kxl042. [DOI] [PubMed] [Google Scholar]
- 24.Wang W, Carvalho B, Miller ND, Pevsner J, Chakravarti A, Irizarry RA. Estimating genome-wide copy number using allele-specific mixture models. J. Comput. Biol. 2008;15:857–866. doi: 10.1089/cmb.2007.0148. [DOI] [PMC free article] [PubMed] [Google Scholar]
- 25.Xiao Y, Segal MR, Yang YH, Yeh RF. A multi-array multi-SNP genotyping algorithm for Affymetrix SNP microarrays. Bioinformatics. 2007;23:1459–1467. doi: 10.1093/bioinformatics/btm131. [DOI] [PubMed] [Google Scholar]
- 26.Pinheiro JC, Bates DM. Mixed-Effects Models in S and S-PLUS. New York: Springer; 2000. [Google Scholar]
- 27.Liu WM, Di X, Yang G, Matsuzaki H, Huang J, Mei R, Ryder TB, Webster TA, Dong S, Liu G, et al. Algorithms for large-scale genotyping microarrays. Bioinformatics. 2003;19:2397–2403. doi: 10.1093/bioinformatics/btg332. [DOI] [PubMed] [Google Scholar]
- 28.Rabbee N, Speed TP. A genotype calling algorithm for affymetrix SNP arrays. Bioinformatics. 2006;22:7–12. doi: 10.1093/bioinformatics/bti741. [DOI] [PubMed] [Google Scholar]
- 29.Dempster AP, Laird NM, Rubin DB. Maximum likelihood from incomplete data via the EM algorithm. J. Roy. Stat. Soc. Ser. B. 1977;39:1–38. [Google Scholar]
- 30.Banfield JD, Raftery AE. Model-based gaussian and non-gaussian clustering. Biometrics. 1993;49:803–821. [Google Scholar]
- 31.Schwarz G. Estimating the dimension of a model. Ann. Stat. 1978;6:461–464. [Google Scholar]
- 32.Fraley C, Raftery AE. Model-based clustering, discriminant analysis, and density estimation. JASA. 2002;97:611–631. [Google Scholar]
- 33.Pandya GA, Holmes MH, Sunkara S, Sparks A, Bai Y, Verratti K, Saeed K, Venepally P, Jarrahi B, Fleischmann RD, et al. A bioinformatic filter for improved base-call accuracy and polymorphism detection using the Affymetrix GeneChip whole-genome resequencing platform. Nucleic Acids Res. 2007;35:e148. doi: 10.1093/nar/gkm918. [DOI] [PMC free article] [PubMed] [Google Scholar]
- 34.Rousseeuw PJ. Silhouettes: a graphical aid to the interpretation and validation of cluster analysis. J. Comput. Appl. Mathematics. 1987;20:53–65. [Google Scholar]
- 35.Bengtsson H, Ray A, Spellman P, Speed TP. A single-sample method for normalizing and combining full-resolution copy numbers from multiple platforms, labs and analysis methods. Bioinformatics. 2009;25:861–867. doi: 10.1093/bioinformatics/btp074. [DOI] [PMC free article] [PubMed] [Google Scholar]
- 36.Di X, Cawley S. Alternative base calling method for resequencing microarrays. Conf. Proc. IEEE Eng. Med. Biol. Soc. 2005;3:2809–2812. doi: 10.1109/IEMBS.2005.1617057. [DOI] [PubMed] [Google Scholar]
- 37.Gonzalez-Vioque E, Blazquez A, Fernandez-Moreira D, Bornstein B, Bautista J, Arpa J, Navarro C, Campos Y, Fernandez-Moreno MA, Garesse R, et al. Association of novel POLG mutations and multiple mitochondrial DNA deletions with variable clinical phenotypes in a Spanish population. Arch. Neurol. 2006;63:107–111. doi: 10.1001/archneur.63.1.107. [DOI] [PubMed] [Google Scholar]
- 38.Ramensky V, Bork P, Sunyaev S. Human non-synonymous SNPs: server and survey. Nucleic Acids Res. 2002;30:3894–3900. doi: 10.1093/nar/gkf493. [DOI] [PMC free article] [PubMed] [Google Scholar]
- 39.Arenas J, Briem E, Dahl H, Hutchison W, Lewis S, Martin MA, Spelbrink H, Tiranti V, Jacobs H, Zeviani M. The V368i mutation in Twinkle does not segregate with AdPEO. Ann. Neurol. 2003;53:278. doi: 10.1002/ana.10430. [DOI] [PubMed] [Google Scholar]
- 40.Small I, Peeters N, Legeai F, Lurin C. Predotar: a tool for rapidly screening proteomes for N-terminal targeting sequences. Proteomics. 2004;4:1581–1590. doi: 10.1002/pmic.200300776. [DOI] [PubMed] [Google Scholar]
- 41.Purdue PE, Allsop J, Isaya G, Rosenberg LE, Danpure CJ. Mistargeting of peroxisomal L-alanine:glyoxylate aminotransferase to mitochondria in primary hyperoxaluria patients depends upon activation of a cryptic mitochondrial targeting sequence by a point mutation. Proc. Natl Acad. Sci. USA. 1991;88:10900–10904. doi: 10.1073/pnas.88.23.10900. [DOI] [PMC free article] [PubMed] [Google Scholar]
- 42.Ferraris S, Clark S, Garelli E, Davidzon G, Moore SA, Kardon RH, Bienstock RJ, Longley MJ, Mancuso M, Gutierrez Rios P, et al. Progressive external ophthalmoplegia and vision and hearing loss in a patient with mutations in POLG2 and OPA1. Arch. Neurol. 2008;65:125–131. doi: 10.1001/archneurol.2007.9. [DOI] [PMC free article] [PubMed] [Google Scholar]
- 43.Bacman SR, Williams SL, Moraes CT. Intra- and inter-molecular recombination of mitochondrial DNA after in vivo induction of multiple double-strand breaks. Nucleic Acids Res. 2009;37:4218–4226. doi: 10.1093/nar/gkp348. [DOI] [PMC free article] [PubMed] [Google Scholar]
- 44.Longley MJ, Clark S, Yu Wai Man C, Hudson G, Durham SE, Taylor RW, Nightingale S, Turnbull DM, Copeland WC, Chinnery PF. Mutant POLG2 disrupts DNA polymerase gamma subunits and causes progressive external ophthalmoplegia. Am. J. Hum. Genet. 2006;78:1026–1034. doi: 10.1086/504303. [DOI] [PMC free article] [PubMed] [Google Scholar]
- 45.Deutschbauer AM, Jaramillo DF, Proctor M, Kumm J, Hillenmeyer ME, Davis RW, Nislow C, Giaever G. Mechanisms of haploinsufficiency revealed by genome-wide profiling in yeast. Genetics. 2005;169:1915–1925. doi: 10.1534/genetics.104.036871. [DOI] [PMC free article] [PubMed] [Google Scholar]
- 46.Wang AL, Lukas TJ, Yuan M, Neufeld AH. Increased mitochondrial DNA damage and down-regulation of DNA repair enzymes in aged rodent retinal pigment epithelium and choroid. Mol. Vis. 2008;14:644–651. [PMC free article] [PubMed] [Google Scholar]
- 47.Al-Tassan N, Chmiel NH, Maynard J, Fleming N, Livingston AL, Williams GT, Hodges AK, Davies DR, David SS, Sampson JR, et al. Inherited variants of MYH associated with somatic G:C–>T:A mutations in colorectal tumors. Nat. Genet. 2002;30:227–232. doi: 10.1038/ng828. [DOI] [PubMed] [Google Scholar]
- 48.Lebedeva MA, Eaton JS, Shadel GS. Loss of p53 causes mitochondrial DNA depletion and altered mitochondrial reactive oxygen species homeostasis. Biochim. Biophys. Acta. 2009;1787:328–334. doi: 10.1016/j.bbabio.2009.01.004. [DOI] [PMC free article] [PubMed] [Google Scholar]
- 49.Ji W, Foo JN, O'Roak BJ, Zhao H, Larson MG, Simon DB, Newton-Cheh C, State MW, Levy D, Lifton RP. Rare independent mutations in renal salt handling genes contribute to blood pressure variation. Nat. Genet. 2008;40:592–599. doi: 10.1038/ng.118. [DOI] [PMC free article] [PubMed] [Google Scholar]
- 50.Cole SA, Butte NF, Voruganti VS, Cai G, Haack K, Kent JW, Jr, Blangero J, Comuzzie AG, McPherson JD, Gibbs RA. Evidence that multiple genetic variants of MC4R play a functional role in the regulation of energy expenditure and appetite in Hispanic children. Am. J. Clin. Nutr. 2010;91:191–199. doi: 10.3945/ajcn.2009.28514. [DOI] [PMC free article] [PubMed] [Google Scholar]
- 51.Tarpey PS, Smith R, Pleasance E, Whibley A, Edkins S, Hardy C, O'Meara S, Latimer C, Dicks E, Menzies A, et al. A systematic, large-scale resequencing screen of X-chromosome coding exons in mental retardation. Nat. Genet. 2009;41:535–543. doi: 10.1038/ng.367. [DOI] [PMC free article] [PubMed] [Google Scholar]
- 52.Shen Y, Wan Z, Coarfa C, Drabek R, Chen L, Ostrowski EA, Liu Y, Weinstock GM, Wheeler DA, Gibbs RA, et al. A SNP discovery method to assess variant allele probability from next-generation resequencing data. Genome Res. 2010;20:273–280. doi: 10.1101/gr.096388.109. [DOI] [PMC free article] [PubMed] [Google Scholar]
- 53.Shendure J. The beginning of the end for microarrays? Nat. Methods. 2008;5:585–587. doi: 10.1038/nmeth0708-585. [DOI] [PubMed] [Google Scholar]
- 54.Gresham D, Curry B, Ward A, Gordon DB, Brizuela L, Kruglyak L, Botstein D. Optimized detection of sequence variation in heterozygous genomes using DNA microarrays with isothermal-melting probes. Proc. Natl Acad. Sci. USA. 2010;107:1482–1487. doi: 10.1073/pnas.0913883107. [DOI] [PMC free article] [PubMed] [Google Scholar]
- 55.Krishnakumar S, Zheng J, Wilhelmy J, Faham M, Mindrinos M, Davis R. A comprehensive assay for targeted multiplex amplification of human DNA sequences. Proc. Natl Acad. Sci. USA. 2008;105:9296–9301. doi: 10.1073/pnas.0803240105. [DOI] [PMC free article] [PubMed] [Google Scholar]
Associated Data
This section collects any data citations, data availability statements, or supplementary materials included in this article.