Abstract
Cancer stem cells are responsible for tumor formation through self-renewal and differentiation into multiple cell types, and thus represent a new therapeutic target for tumors. Glycoproteins play a critical role in determining the fates of stem cells such as self-renewal, proliferation and differentiation. Here we applied a multi-lectin affinity chromatography and quantitative glycoproteomics approach to analyze alterations of glycoproteins relevant to the differentiation of a glioblastoma-derived stem cell line HSR-GBM1. Three lectins including concanavalin A (Con A), wheat germ agglutinin (WGA) and peanut agglutinin (PNA) were used to capture glycoproteins, followed by LC-MS/MS analysis. A total of 73 and 79 high-confidence (FDR < 0.01) glycoproteins were identified from the undifferentiated and differentiated cells, respectively. Label-free quantitation resulted in the discovery of 18 differentially expressed glycoproteins, wherein 9 proteins are localized in the lysosome. All of these lysosomal glycoproteins were up-regulated after differentiation, where their principal function was hydrolysis of glycosyl residues. Protein-protein interaction and functional analyses revealed the active involvement of lysosomes during the process of glioblastoma stem cell differentiation. This work provides glycoprotein markers to characterize differentiation status of glioblastoma stem cells which may be useful in stemcell therapy of glioblastoma.
Keywords: glycoprotein, cell differentiation, glioblastoma, stem cell, LC-MS/MS, lectin affinity chromatography
Introduction
There is increasing evidence that cancer stem cells are responsible for tumor formation and growth.1–3 These cells represent a new target for the treatment of tumors. The existence of cancer stem cells has been shown in various tumors4–7, including glioblastoma8–9, which is the most malignant brain tumor with a median survival of only 9 to 12 months10. Our previous work demonstrated that targeting cancer stem cells by blocking Notch or BMP pathway prevents glioblastoma or medulloblastoma propagation both in vitro and in vivo and prolongs survival in mice bearing intracranial xenografts.11–14 Cancer stem cells share “stem-like” properties with normal stem cells, including self-renewal and differentiation capacity, and these cells may generate tumors through self-renewal and differentiation into multiple cell types. Therefore, it is of intense interest to understand the molecular alterations and signaling pathways involved in the differentiation of these cancer stem cells.
Glycoproteins are a group of proteins with oligosaccharide chains attached to them. These proteins are ubiquitously distributed in various tissues and cells, and are primarily localized on the cell surface. According to some studies, cancer is associated with alterations in glycoproteins.15–17 Glycoproteins play important roles not only in cell-cell interaction and signal transduction, but also in determining the fates of stem cells such as self-renewal, proliferation and differentiation.18 Most of the known markers of cancer stem cells in solid tumors are glycoproteins2, 19, indicating the significance of glycoproteins for cancer stem cells.
Glycoproteomics is a branch of proteomics that studies the entire complement of glycoproteins. Mass spectrometry plays a vital role in the analysis of glycoproteins and the structures of their glycan moieties.19–22 Glycoproteomics has been greatly facilitated by the use of lectin affinity chromatography23–25 and chemical methods26–27 for the enrichment of glycoproteins or glycopeptides. Although many proteins associated with the differentiation of stem cells28–32 have been identified by quantitative proteomic approaches, little is known about the alterations of glycoproteins during the differentiation of stem cells, especially cancer stem cells. In related work, the study by Janot et al. has investigated glycogenome expression dynamics during mouse C2C12 myoblast differentiation and identified 37 highly deregulated glycogenes.33 In another study, potential stage-specific glycobiomarkers of murine embryonic stem cells were identifed using a concanavalin A (Con A) enrichment and an LC-MS/MS approach.34 However, these studies did not investigate the cancer stem cell problem where these cells have unique proliferative and survival mechanisms.
In an effort to identify glycoproteins relevant to the differentiation of glioblastoma stem cells, we have applied a lectin-assisted glycoproteomics approach. Glycoproteins captured from both undifferentiated and differentiated stem cells were identified using LC-MS/MS and a set of differentially expressed glycoproteins found with a label-free quantitation method. Based on the differentially expressed glycoproteins we developed a protein-protein interaction network to elucidate their potential functions.
Materials and Methods
Cell Culture
The HSR-GBM1 neurosphere cells were cultured as previously described13, 35 and maintained in the NeuroCult proliferation medium (Stem Cell Technologies, Vancouver, Canada) supplemented with 10 ng/ml EGF (PeproTech, Rocky Hill, NJ), 10 ng/ml FGFb (PeproTech), and 2 ug/ml heparin (Sigma, Saint Louis, MO). Differentiation of the neurospheres was achieved by plating 0.9–1 × 10⁵ cells/cm2 on a poly-ornithine (15 µg/ml) coated culture plate and maintaining in the NeuroCult differentiation medium (Stem Cell Technologies) as described previously35.
Protein Extraction
Approximately 20 million cells were harvested and washed twice with 10 mL of PBS (0.01 M phosphate, 0.15 M NaCl, pH 7.4) to remove culture medium. The cell pellets were then resuspended in 1 ml of lysis buffer (1% octyl-β-D-glucopyranoside, 20 mM Tris-HCl, pH7.4, 150 mM NaCl and 1% protease inhibitor cocktail (Sigma-Aldrich, St. Louis, MO)), and homogenized with 25 strokes in a Dounce glass homogenizer with a tight-fitting pestle. After 10-minute incubation on ice, the process was repeated. The cell lysates were centrifuged at 40,000g for 30 min at 4 °C. The supernatants were collected and the protein concentrations were determined by the Bradford method36. In order to obtain accurate results, the assay was performed twice using different dilutions of cell lysates.
Western Blotting
Western blotting was performed essentially as described before37. Briefly, 12 µg of proteins from the undifferentiated and differentiated HSR-GBM1 cells were separated by 4–20% SDS-PAGE and then transferred to PVDF membranes (Bio-Rad, CA). The membranes were blocked by 1% BSA in PBST (0.05% Tween-20 in PBS) for 2 h, and then incubated with various primary antibodies in 1% BSA for 4 h or overnight. Anti-Glial fibrillary acidic protein (GFAP), anti-Receptor-type tyrosine-protein phosphatase zeta (PTPRZ1) and anti-Proactivator polypeptide (PSAP) were obtained from Sigma-Aldrich (St. Louis, MO); anti-Epidermal growth factor receptor (EGFR) and anti-Cathepsin D (CTSD) were from BD Transduction Laboratories (Lexington, KY); anti-CD133 and anti-beta actin were from Abcam (Cambridge, MA); anti-Tenascin-C (TNC) was from Abnova (Taipei, China). After being washed with PBST three times, the membranes were incubated with peroxidase-conjugated IgG (H+L) for 1 h, washed three times, and detected by Supersignal West Pico Chemiluminescent HRP Substrate (Thermo Scientific, IL).
Lectin Microarray
Eight lectins listed in Supplementary Table S1 were used in this study. Each lectin was dissolved in PBS buffer to a concentration of 1 mg/ml and printed on Whatman FAST slides using a piezoelectric noncontact printer (Nano plotter; GeSiM, GmbH, Germany). Each lectin was printed in triplicate in each block. The total volume of each spot was 2.5 nL, which resulted from spotting of 500 pL for 5 times. The slides were incubated in a humidity-controlled incubator (> 45% humidity) overnight to allow lectin immobilization. After incubation, the slides were blocked with 1% BSA/PBS for 1 h and washed three times with PBST (0.1% Tween 20 in PBS). Ten micrograms of proteins from each sample were labeled with EZ-link iodoacetyl-LC-biotin (Thermo Scientific, IL) in lysis buffer for 90 min, and then the reaction was stopped with 1 µl of 2-mercaptoethanol. Each lectin block on the slide was incubated with 2 µg of labeled proteins for 1 h, followed by three washes with PBST. The slides were subsequently incubated with 10 ml of streptavidinylated fluorescent dye Alexa 555 (Invitrogen, CA) in PBST for 1 h, and scanned with a microarray scanner (Genepix 4000A; Axon). Genepix 6.0 was used to analyze the images.
Lectin Affinity Chromatography
Two centrifuge columns (Thermo Scientific, IL) were packed with the same agarose-bound lectin mixtures including 0.8 mL of concanavalin A (Con A), 0.8 mL of wheat germ agglutinin (WGA) and 0.8 mL of peanut agglutinin (PNA). All the lectins were obtained from Vector Laboratories (Burlingame, CA). The columns were washed with 7.2 mL of binding buffer (20 mM Tris-HCl, pH7.4, 150 mM NaCl, 1mM MgCl2, 1mM CaCl2 and 1mM MnCl2). Cell lysates containing 1.8 mg of proteins were diluted four times with ice-cold binding buffer, and passed through the columns twice, followed by column washing with 9.6 mL of binding buffer to remove nonspecific binding proteins. The glycoproteins captured in each column were released with 2.4 mL of elution buffer (300 mM methyl-R-D-mannopyroside, 300 mM N-acetylglucosamine and 200 mM D-galactose in binding buffer, pH 7.4). This step was repeated twice, and the eluted fractions of the same sample were pooled and filtered through Microcon YM-10 centrifugal filter devices to a volume of ~ 0.2 mL, reduced with 5mM TCEP for 30 min at 37 °C, alkylated with 25 mM iodoacetamide for 20 min at room temperature, digested with trypsin and PNGase F, and evaporated to dryness using a SpeedVac concentrator (Thermo Savant, Milford, MA) at low temperature.
Mass Spectrometry
The peptide mixtures were resolubilized in 70 µl of 0.1% formic acid and analyzed by LC-MS/MS using an LTQ mass spectrometer (Thermo Finnigan, San Jose, CA). Chromatographic separation of peptides was performed on a Paradigm MG4 micropump system (Michrom Biosciences Inc., Auburn, CA) equipped with a C18 separation column (0.1 mm × 150 mm, C18 AQ particles, 5 µm, 120 Å, Michrom Biosciences Inc., Auburn, CA). Ten microliters of the peptide mixtures were separated with a linear gradient of acetonitrile/water containing 0.1% formic acid at a flow rate of 300 nl/min. A 90 min linear gradient from 5 to 40% acetonitrile was used. The MS instrument was operated in positive ion mode. The ESI spray voltage was set at 1.5 KV, and the capillary voltage at 30 V. The ion activation was achieved by utilizing helium at a normalized collision energy of 35%. The data were acquired in data-dependent mode using the Xcalibur software (2.1.0 build 1139). For each cycle of one full mass scan (range of m/z 400−2000), the five most intense ions in the spectrum were selected for tandem MS analysis, unless they appeared in the dynamic or mass exclusion lists.
Data Analysis
All MS/MS spectra were searched against the Swiss-prot database Release 57. The search was performed using SEQUEST algorithm38 incorporated in Proteome Discoverer software version 1.1.0.263. The search parameters were as follows: (1) Fixed modification, Carbamidomethyl of C; (2) variable modification, oxidation of M and Asn -> Asp; (3) allowing two missed cleavages; (4) peptide ion mass tolerance 1.50 Da; (5) fragment ion mass tolerance 0.0 Da; (6) peptide charges +1, +2, and +3. False discovery rate (FDR) was set to be < 0.05 or < 0.01 for each database search. The Xcorr values for all the charge states (+1, +2, and +3) were automatically adjusted to achieve the predetermined FDR value. If multiple proteins share the same peptide sequences, they will be reported as a protein group.
Label-free quantification of proteins
Proteins identified from the undifferentiated and differentiated HSR-GBM1 cells were quantified using a label-free method termed the normalized spectral index (SIN)39. SIN is defined as the cumulative fragment ion intensities for all spectra counted for a protein (SI) normalized by the sum of SI over all proteins and by the length of the protein. The SIN approach is a good choice to quantify MS data generated by an ion-trap mass spectrometer.40 SIN fold-change of a given protein was calculated as the ratio of the average SIN for the protein between two samples. A 4-fold change was considered as a significant difference.
Results and Discussion
Morphology of the Undifferentiated and Differentiated HSR-GBM1 Cells
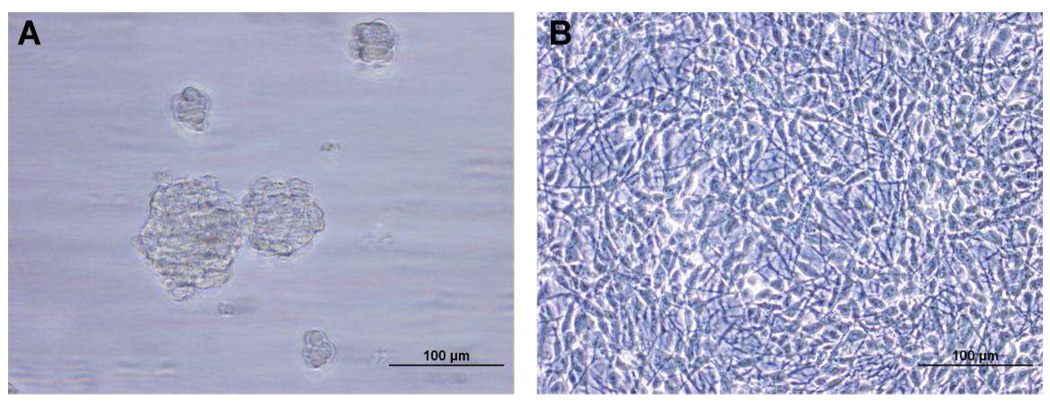
The HSR-GBM1 neurosphere line is derived from human glioblastoma, and it displayed all of the critical features of neural stem cells such as self-renewal and multilineage differentiation.35 A representative phase micrograph showed that the undifferentiated HSR-GBM1 neurospheres were growing as spheres in the proliferating medium (Figure 1A). However, when the neurospheres were forced to differentiate, the cells became attached and grew as a monolayer (Figure 1B).
Figure 1. Phase micrographs of undifferentiated HSR-GBM1 neurospheres (A) and its differentiated counterpart (B).
Evaluation of Cell Differentiation
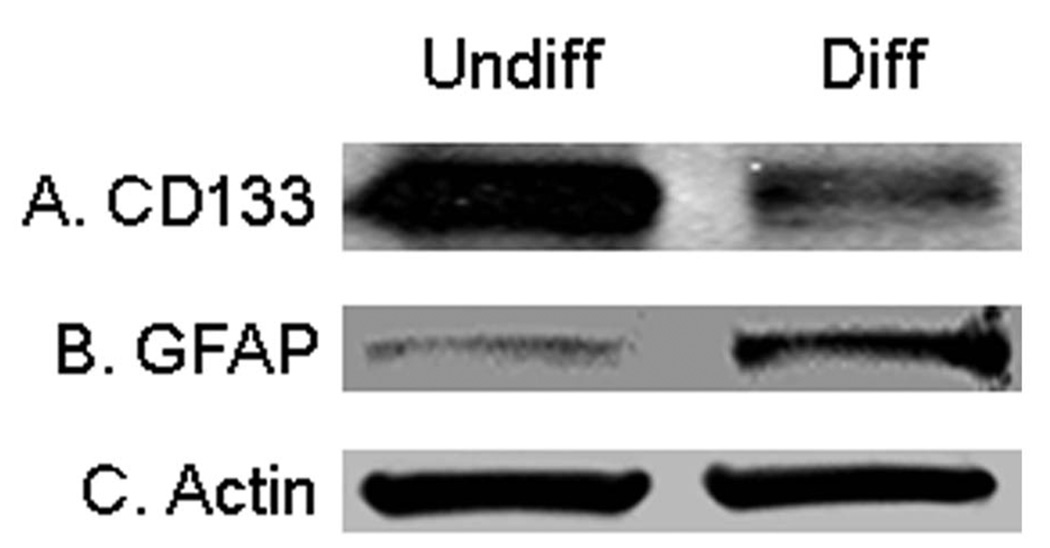
A neural stem cell marker CD133 and a glial cell differentiation marker GFAP were used to evaluate the differentiation of HSR-GBM1 neurospheres. When the neurospheres were induced to differentiate, the expression level of CD133 was reduced about 7 folds (Figure 2A). This implies that most of stem cell markers were lost after differentiation as expected. At the same time, a 4-fold increase of GFAP was also observed (Figure 2B), indicating that the induction of cell differentiation was successful in this work.
Figure 2. Western blotting analysis of the differentiation of HSR-GBM1 neurospheres.
(A) Expression of the neural stem cell marker CD133 was reduced after cell differentiation. (B) The glial cell differentiation marker GFAP was up-regulated in the differentiated cells. Undiff represents undifferentiated HSR-GBM1 neurospheres, and Diff represents differentiated HSR-GBM1 cells.
Profiling of Glycoproteins by Lectin Microarray
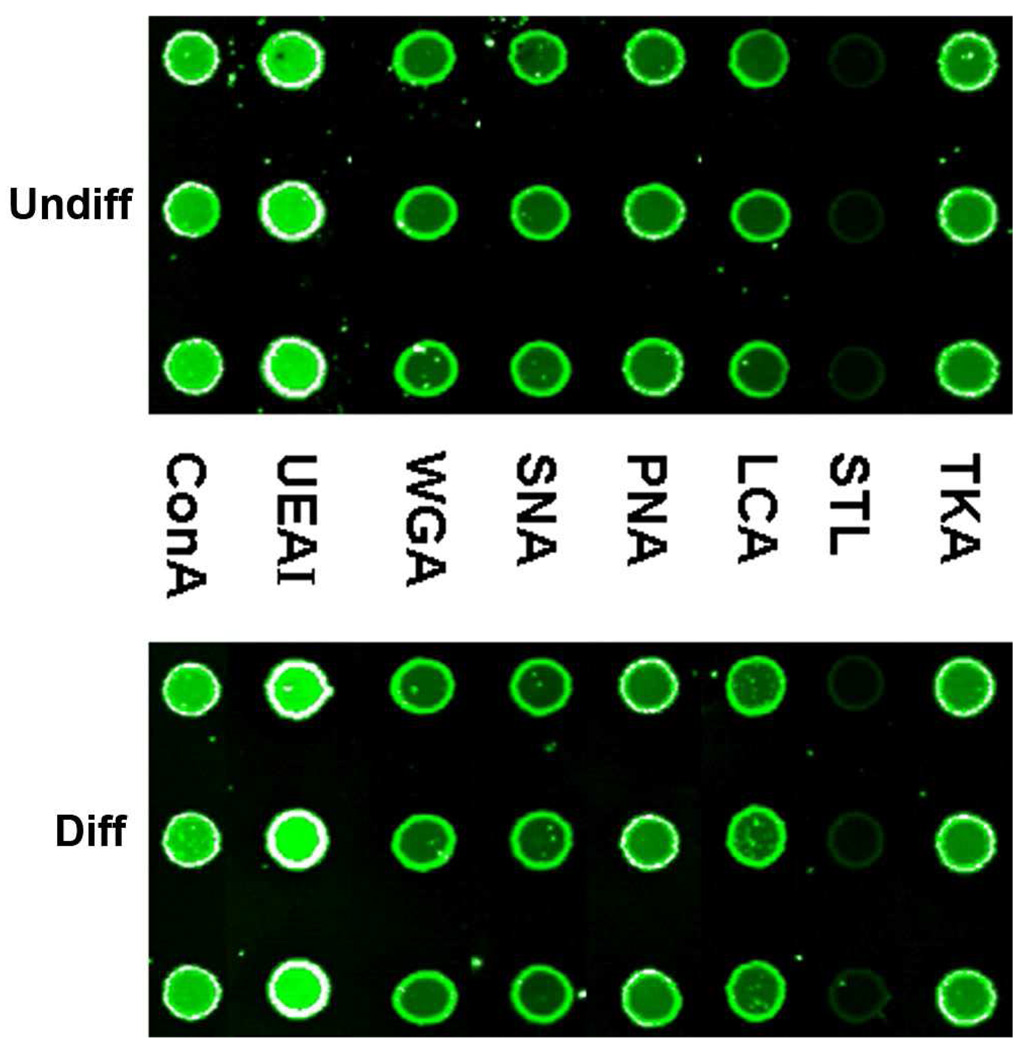
Lectin microarrays consisting of 8 lectins were used to profile glycoproteins from cell lysates of the undifferentiated and differentiated HSR-GBM1 cells. The specificities and other information of these lectins are shown in Supplementary Table S1. Similar binding patterns of various lectins to glycoproteins were observed for the two states of HSR-GBM1 cells (Figure 3). This suggests that the amount of total glycoproteins is not significantly changed. However, we believe that the expression levels of individual glycoproteins change along with the differentiation of HSR-GBM1 neurospheres. Lectin blot analysis of the cell lysate separated by 1-D gel showed obvious changes of individual glycoproteins, especially those at high molecular weight, although the total glycoprotein expression levels were similar between the undifferentiated and differentiated cells (Figure S1).
Figure 3. Binding patterns of 8 lectins to glycoproteins in the undifferentiated and differentiated HSR-GBM1 cells.
Undiff represents undifferentiated HSR-GBM1 neurospheres; Diff represents differentiated HSR-GBM1 cells.
Enrichment of Glycoproteins by Lectin Affinity Chromatography
The combination of lectins with broad carbohydrate specificities could elevate the binding efficiency of glycoproteins and increase the coverage of glycoprotein identifications. N-linked glycans have a common core structure (Man)3(GlcNAc)2, where both Con A and WGA lectins have high affinity. Due to their wide specificity, Con A and WGA have been most commonly used to capture glycoproteins. In our previous work19, we found higher expression of galactosylated glycoproteins on the cell surface of HSR-GBM1 stem cells compared with a traditional glioblastoma cell line U373, and the beta-galactose specific lectin PNA could distinguish the difference. Therefore, we use the combination of Con A, WGA and PNA to capture glycoproteins in this work.
Identification of Glycoproteins
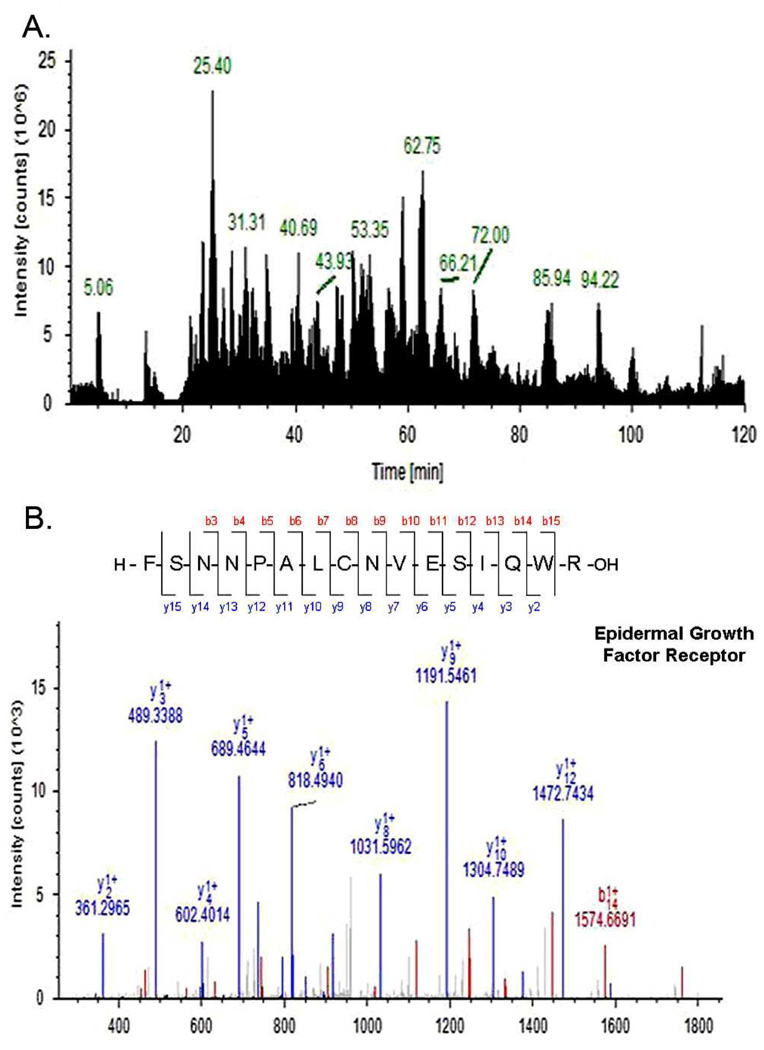
The proteins eluted from lectin columns were digested and analyzed by LC-MS/MS using an LTQ mass spectrometer. A representative base peak chromatogram and an MS/MS spectrum are shown in Figure 4. When the FDR was set to < 0.05, the database search using SEQUEST algorithm resulted in the identification of 112 glycoproteins from the undifferentiated cells (Supplementary Table S2), and 131 glycoproteins from the differentiated cells (Supplementary Table S3). When the FDR was set to < 0.01, the number of glycoprotein identifications was 73 and 79 for the undifferentiated and differentiated cells, respectively (Supplementary Table S4 and Table S5). The numbers of glycoproteins are comparable to those from similar studies.34, 41 In the present work, we focus on the glycoproteins with high confidence (FDR < 0.01).
Figure 4. LC-MS/MS analysis.
(A) A representative base peak chromatogram of undifferentiated HSR-GBM1 neurosphere. (B) MS/MS spectrum of a peptide from Epidermal growth factor receptor. The sequence of the peptide was identified as FSNNPALCNVESIQWR.
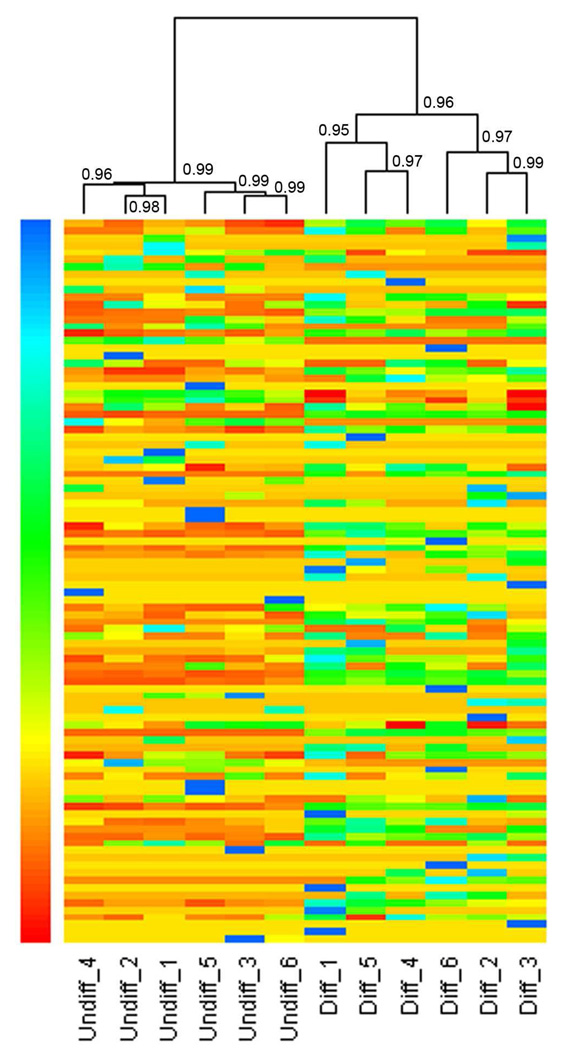
The high-confidence glycoproteins from six replicate MS measurements were clustered in a heat map based on the similarities in their normalized spectral indexes (Figure 5). As shown in the heat map, all of the six MS replicates for each cell line were successfully clustered. The Pearson correlation coefficient between any replicate experiments was higher than 0.95. This indicates that our experiments are highly reproducible. Meanwhile, the undifferentiated and differentiated HSR-GBM1 cells could be visually separated due to the different expression patterns of the glycoproteins in the two cell samples.
Figure 5. Heat maps with dendrograms of hierarchical clustering for six replicate experiments.
The heat maps were based on the spectral indexes of all high-confidence glycoproteins identified in this work. Each column indicates a replicate experiment, and each row indicates a glycoprotein identified by LC-MS/MS. The number of spectral index increased from red color to blue color. The Pearson correlation coefficients were indicated at each branching point. The heat map was generated with R language. Undiff represents undifferentiated HSR-GBM1 neurospheres, and Diff represents differentiated HSR-GBM1 cells.
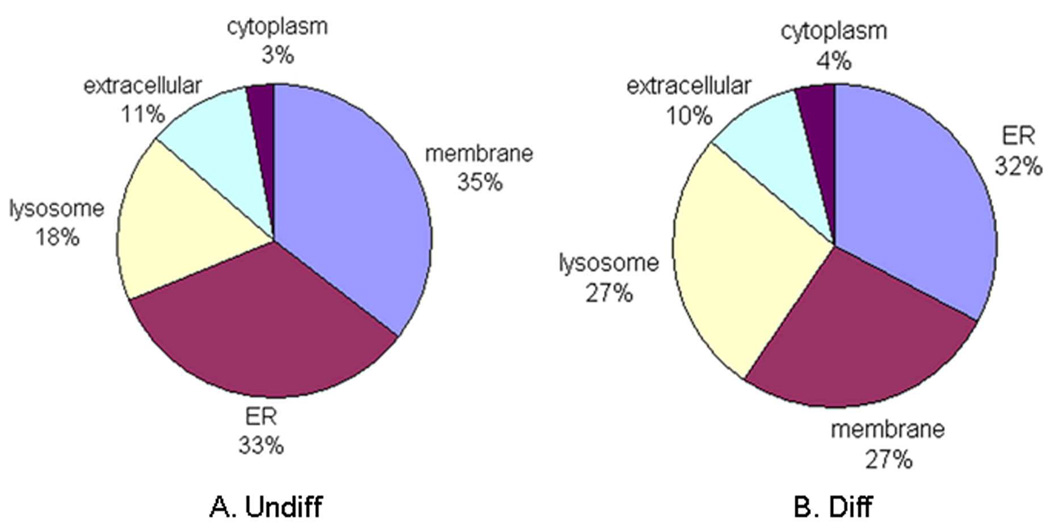
The glycoproteins identified from both undifferentiated and differentiated cells were mainly localized to the membrane, endoplasmic reticulum and lysosome (Figure 6). However, the subcellular distribution patterns were different between the two states of HSR-GBM1 cells. The most dramatic difference was observed for lysosomal glycoproteins. Along with cell differentiation, the number of lysosomal glycoproteins increased from 13 (18%, Figure 6A) to 21 (27%, Figure 6B). This phenomenon is likely to be associated with the activation of lysosomal function during cell differentiation, as observed from dendritic cells42 and osteoblasts43. As the disposal system of the cell, lysosomes may play an important role in the degradation of the damaged or internalized proteins during the process of stem cell differentiation.42, 44
Figure 6. Subcellular location of glycoproteins identified from undifferentiated and differentiated HSR-GBM1 cells.
Undiff represents undifferentiated HSR-GBM1 neurospheres; Diff represents differentiated HSR-GBM1 cells.
Differentially Expressed Glycoproteins
The glycoproteins identified from undifferentiated and differentiated HSR-GBM1 cells were quantified using a label-free normalized spectral index method, which combines fragment ion intensity with spectral count and peptide count. This quantitative method can accurately determine protein abundance more often than the other label-free methods such as spectral count, area under the curve and peak area.39
A total of 18 differentially expressed glycoproteins between undifferentiated and differentiated HSR-GBM1 cells were identified. The detailed information of these proteins are listed in Table 1. Interestingly, 9 (50%) of these proteins were localized in the lysosome, all of which were up-regulated in the differentiated cells. This further confirmed the critical role of lysosomes in cell differentiation.
Table 1.
Differentially expressed glycoproteins between the undifferentiated and differentiated HSR-GBM1 cells.
| Accession | Protein name | Gene | Location | Ratioa | p-valueb |
|---|---|---|---|---|---|
| PGCB_HUMAN | Brevican core protein | BCAN | Membrane | 8.27 | 1.54E-09 |
| GGH_HUMAN | Gamma-glutamyl hydrolase | GGH | Extracellular | 7.65 | 2.90E-07 |
| CATD_HUMAN | Cathepsin D | CTSD | Lysosome | 4.10 | 3.35E-07 |
| EGFR_HUMAN | Epidermal growth factor receptor | EGFR | Membrane | NAc | 1.19E-06 |
| LYAG_HUMAN | Lysosomal alpha-glucosidase | GAA | Lysosome | 25.73 | 8.96E-06 |
| BGAL_HUMAN | Beta-galactosidase | GLB1 | Lysosome | 12.54 | 5.04E-05 |
| SAP_HUMAN | Proactivator polypeptide | PSAP | Lysosome | 4.12 | 5.57E-05 |
| PTPRZ_HUMAN | Receptor-type tyrosine-protein phosphatase zeta | PTPRZ1 | Membrane | 0 | 0.00011 |
| PPGB_HUMAN | Lysosomal protective protein | CTSA | Lysosome | 6.44 | 0.00025 |
| PLOD1_HUMAN | Procollagen-lysine,2-oxoglutarate 5-dioxygenase 1 | PLOD1 | ERd | 0.17 | 0.00031 |
| LG3BP_HUMAN | Galectin-3-binding protein | LGALS3BP | Extracellular | 21.84 | 0.00041 |
| NAGAB_HUMAN | Alpha-galactosidase B | NAGA | Lysosome | NA | 0.00059 |
| APMAP_HUMAN | Adipocyte plasma membrane -associated protein | APMAP | Membrane | 4.331 | 0.0018 |
| ARSA_HUMAN | Arylsulfatase A Precursor | ARSA | Lysosome | NA | 0.0056 |
| HEXA_HUMAN | Beta-hexosaminidase subunit alpha | HEXA | Lysosome | NA | 0.0061 |
| P4HA1_HUMAN | Prolyl 4-hydroxylase subunit alpha-1 | P4HA1 | ER | 0 | 0.0075 |
| LAMP2_HUMAN | CD107b antigen | LAMP2 | Lysosome & membrane | 8.00 | 0.0089 |
| TENA_HUMAN | Tenascin-C | TNC | Extracellular | 0 | 0.0097 |
The ratio of the spectral index of a target protein identified from differentiated HSR-GBM1 cells to that identified from undifferentiated HSR-GBM1 neurosphere.
p-value: statistical significance of differentially expressed proteins between differentiated and undifferentiated HSR-GBM1 cells. The values were generated by Student’s t-test for six replicate experiments. The differential expression of a protein was considered to be significant if the p-value was less than 0.01.
NA means the protein was only identified from differentiated HSR-GBM1 cells.
ER represents endoplasmic reticulum.
According to the label-free quantitation, four glycoproteins were up-regulated in the undifferentiated cells compared with differentiated cells. These include Receptor-type tyrosine-protein phosphatase zeta (PTPRZ1), Procollagen-lysine,2-oxoglutarate 5-dioxygenase 1 (PLOD1), Prolyl 4-hydroxylase subunit alpha-1 (P4HA1) and Tenascin-C (TNC). The other 14 differentially expressed glycoproteins displayed a significant increase in the differentiated cells. CD133, the well-known marker of the undifferentiated HSR-GBM1 neurospheres, was not among the list in Table 1. As shown in Supplementary Table S4, CD133 was identified from the undifferentiated cells in only one LC-MS/MS experiment with only one peptide. This may be attributed to the low solubility and poor tryptic digestion efficiency of the five-transmembrane protein.
Verification of Differential Expression by Western Blotting
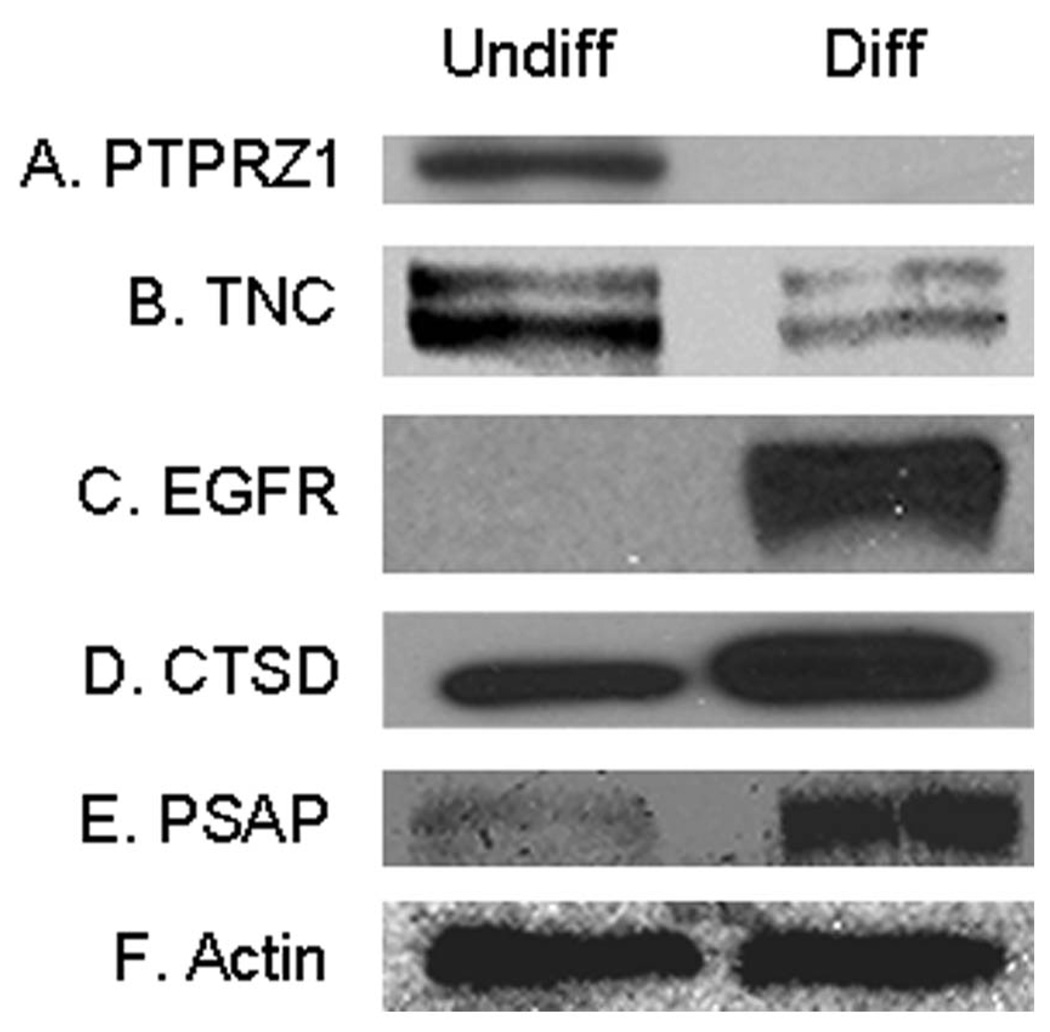
We applied Western blotting analysis to further verify the changes of the glycoproteins in Table 1. Five interesting proteins were selected for the verification, including PTPRZ1, TNC, Epidermal growth factor receptor (EGFR), Cathepsin D (CTSD) and Proactivator polypeptide (PSAP). The down-regulation of PTPRZ1 and TNC, as well as the up-regulation of EGFR, CTSD and PSAP in the differentiated HSR-GBM1 cells was confirmed (Figure 7). It is noteworthy that consistent with the label-free quantitation results shown in Table 1, PTPRZ1 was detected exclusively in the undifferentiated cells (Figure 7A), while EGFR was detected exclusively in the differentiated cells (Figure 7C).
Figure 7. Verification of the differential expression of selected proteins by Western blotting.
Twelve micrograms of proteins were separated by 4–20% SDS-PAGE and transferred to PVDF membranes. The blots were probed with antibodies against (A) Receptor-type tyrosine-protein phosphatase zeta (PTPRZ1); (B) Tenascin-C (TNC); (C) Epidermal growth factor receptor (EGFR); (D) Cathepsin D (CTSD); (E) Proactivator polypeptide (PSAP) and (F) Beta-actin. Undiff represents undifferentiated HSR-GBM1 neurospheres, and Diff represents differentiated HSR-GBM1 cells.
Protein Interaction Network
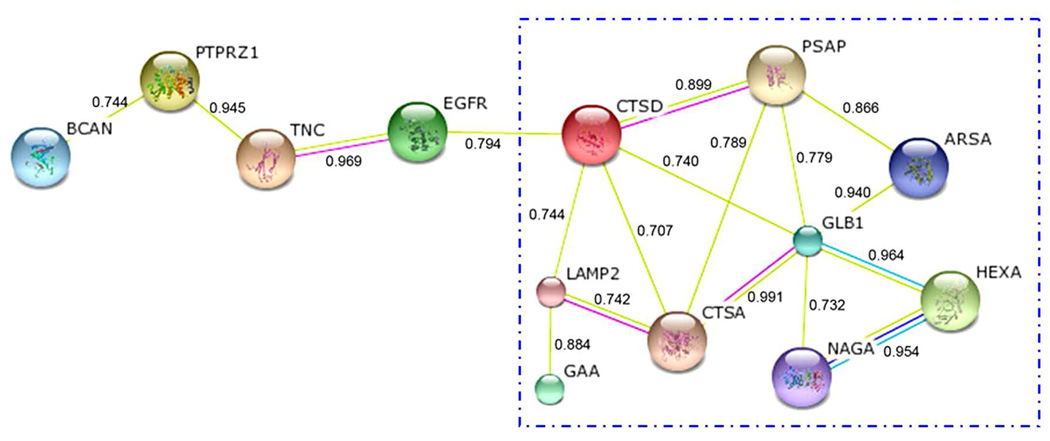
A protein-protein interaction network of the differentially expressed glycoproteins was generated using the STRING database45, which integrates interaction data from various sources, including experimental repositories, computational analysis methods and previous knowledge. In STRING, a confidence score is assigned to each protein-protein interaction. An interaction will be considered as “high confidence” if the score is higher than 0.7. In our work, the interaction network of the differentially expressed glycoproteins contains 18 high-confidence interactions for 13 differentially expressed glycoproteins (Figure 8).
Figure 8. High-confidence protein-protein interaction network of the differentially expressed glycoproteins derived from the STRING database.
Each node represents a protein, and each edge represents an interaction. A confidence score of each interaction is shown beside the corresponding edge.
Note that the 9 proteins inside the box in Figure 8 are localized in the lysosome, and all of them displayed higher expression levels in the differentiated cells. The major function of these glycoproteins is associated with the hydrolysis of glycosyl residues. There are 4 glycosyl hydrolases among these lysosomal glycoproteins, including Beta-galactosidase (GLB1), Alpha-galactosidase B (NAGA), Beta-hexosaminidase subunit alpha (HEXA) and Lysosomal alpha-glucosidase (GAA). They are responsible for the removal of beta-D-galactose, N-acetyl-D-galactosamine, N-acetyl-D-hexosamine and alpha-D-glucose residues from glycoproteins or other molecules containing these residues, respectively. The other 5 lysosomal glycoproteins may function as activators of these glycosyl hydrolases through various interactions. For example, CTSD binds to PSAP and accelerates the maturation of PSAP into saposins, which further stimulate the hydrolysis of sphingolipids by enzymes such as arylsulfatase A (ARSA) and GLB1.46–48 The up-regulation of ARSA and GLB1 in the differentiated cells may be promoted by the higher expression of CTSD and PSAP. In addition, Lysosomal protective protein (CTSA) can associate with GLB1 and protect the stability and activity of this lysosomal enzyme.49–50 Thus, the up-regulation of CTSA may also facilitate the higher expression of GLB1 in the differentiated cells. These above-mentioned lysosomal glycoproteins may work together to hydrolyze the glycosyl residues from molecules such as glycoproteins and glycolipids.
All of the 4 proteins outside the box in Figure 8 are localized to the plasma membrane. Both PTPRZ1 and TNC have been identified as cell surface markers for the undifferentiated HSR-GBM1 neurospheres in a previous work.19 These two proteins interact with each other51, and their overexpression is associated with human glioblastomas.52–53 PTPRZ1, which is a receptor-type tyrosine phosphatase, was specifically expressed in the undifferentiated HSR-GBM1 cells (Figure 7A). In contrast, a receptor tyrosine kinase EGFR was detected exclusively in the differentiated cells (Figure 7C). The function of PTPRZ1 and EGFR may be related to regulation of cell proliferation and differentiation by control of tyrosine phosphorylation. Previously, Filvaroff et al. 54 found that tyrosine phosphorylation played an important regulatory role in the differentiation of keratinocytes, and tyrosine kinase inhibitors showed the ability to interfere with cell differentiation. In our work, the tyrosine phosphatase PTPRZ1, which can reduce tyrosine phosphorylation, was highly expressed in the undifferentiated cells. This may represent an important way to keep the HSR-GBM1 stem cells undifferentiated.
Conclusions
We identified a set of glycoproteins associated with the differentiation of a glioblastoma-derived stem cell line HSR-GBM1 using a multi-lectin affinity chromatography and label-free quantitative proteomics method. The 7-fold decrease of a neural stem cell marker CD133 indicates a drastic loss of stem cell markers after differentiation. After enrichment of glycoproteins using a lectin column, LC-MS/MS analysis resulted in the identification of 73 and 79 high-confidence (FDR < 0.01) glycoproteins from the undifferentiated and differentiated cells, respectively. These glycoproteins were quantified using a label-free spectral index method, and 18 differentially expressed glycoproteins associated with the differentiation of HSR-GBM1 neurospheres were identified. Half of these changed proteins are localized in the lysosome, all of which were up-regulated in the differentiated cells, indicating the active involvement of lysosomes in cell differentiation. The primary function of these lysosomal glycoproteins may lie in hydrolysis of glycosyl residues. The differential expression patterns of a receptor-type tyrosine phosphatase PTPRZ1 and a receptor tyrosine kinase EGFR suggest an important role of these proteins in the regulation of cell proliferation by affecting tyrosine phosphorylation.
An improved understanding of these protein alterations and the signaling pathways where they are involved will broaden our knowledge about the differentiation of glioblastoma stem cells, and may provide useful information for the therapy of glioblastoma.
Supplementary Material
Acknowledgement
This work was funded under the National Institute of Health Grant No. R01 49500 (D.M.L.) and the National Cancer Institute Grant No. R21 CA134623 (D.M.L.) and R21 CA124441 (D.M.L.). We would like to acknowledge grant support to Dr. Fan from Accelerate Brain Cancer Cure Project Award, American Brain Tumor Association Translational Grant, and Voices Against Brain Cancer Research Grant.
Footnotes
Supporting Information Available: Lectin blot analysis of glycoprotein expression levels of the undifferentiated and differentiated HSR-GBM1 cells (Figure S1). Detailed information of the 8 lectins used for lectin microarray (Table S1). Glycoproteins identified from the undifferentiated and differentiated HSR-GBM1 cells with FDR < 0.05 (Table S2 and Table S3). Glycoproteins identified from the undifferentiated and differentiated HSR-GBM1 cells with FDR < 0.01 (Table S4 and Table S5). This material is available free at http://pubs.acs.org.
Contributor Information
Jintang He, Email: jintang@umich.edu.
Yashu Liu, Email: yashul@umich.edu.
Thant S. Zhu, Email: thant@umich.edu.
Xiaolei Xie, Email: xlxie@umich.edu.
Mark A. Costello, Email: macos@umich.edu.
Caroline E. Talsma, Email: ctalsma@umich.edu.
Callie G. Flack, Email: cgflack@umich.edu.
Jessica G. Crowley, Email: crowljes@umich.edu.
Francesco DiMeco, Email: fdimeco1@jhmi.edu.
Angelo L. Vescovi, Email: vescovi@tin.it.
Xing Fan, Email: xingf@umich.edu.
David M. Lubman, Email: dmlubman@umich.edu.
References
- 1.Reya T, Morrison SJ, Clarke MF, Weissman IL. Stem cells, cancer, and cancer stem cells. Nature. 2001;414(6859):105–111. doi: 10.1038/35102167. [DOI] [PubMed] [Google Scholar]
- 2.Visvader JE, Lindeman GJ. Cancer stem cells in solid tumours: accumulating evidence and unresolved questions. Nat Rev Cancer. 2008;8(10):755–768. doi: 10.1038/nrc2499. [DOI] [PubMed] [Google Scholar]
- 3.Jordan CT, Guzman ML, Noble M. Cancer stem cells. N Engl J Med. 2006;355(12):1253–1261. doi: 10.1056/NEJMra061808. [DOI] [PubMed] [Google Scholar]
- 4.Bonnet D, Dick JE. Human acute myeloid leukemia is organized as a hierarchy that originates from a primitive hematopoietic cell. Nat Med. 1997;3(7):730–737. doi: 10.1038/nm0797-730. [DOI] [PubMed] [Google Scholar]
- 5.Al-Hajj M, Wicha MS, Benito-Hernandez A, Morrison SJ, Clarke MF. Prospective identification of tumorigenic breast cancer cells. Proc Natl Acad Sci U S A. 2003;100(7):3983–3988. doi: 10.1073/pnas.0530291100. [DOI] [PMC free article] [PubMed] [Google Scholar]
- 6.O'Brien CA, Pollett A, Gallinger S, Dick JE. A human colon cancer cell capable of initiating tumour growth in immunodeficient mice. Nature. 2007;445(7123):106–110. doi: 10.1038/nature05372. [DOI] [PubMed] [Google Scholar]
- 7.Hermann PC, Huber SL, Herrler T, Aicher A, Ellwart JW, Guba M, Bruns CJ, Heeschen C. Distinct populations of cancer stem cells determine tumor growth and metastatic activity in human pancreatic cancer. Cell Stem Cell. 2007;1(3):313–323. doi: 10.1016/j.stem.2007.06.002. [DOI] [PubMed] [Google Scholar]
- 8.Singh SK, Clarke ID, Terasaki M, Bonn VE, Hawkins C, Squire J, Dirks PB. Identification of a cancer stem cell in human brain tumors. Cancer Res. 2003;63(18):5821–5828. [PubMed] [Google Scholar]
- 9.Singh SK, Hawkins C, Clarke ID, Squire JA, Bayani J, Hide T, Henkelman RM, Cusimano MD, Dirks PB. Identification of human brain tumour initiating cells. Nature. 2004;432(7015):396–401. doi: 10.1038/nature03128. [DOI] [PubMed] [Google Scholar]
- 10.Maher EA, Furnari FB, Bachoo RM, Rowitch DH, Louis DN, Cavenee WK, DePinho RA. Malignant glioma: genetics and biology of a grave matter. Genes Dev. 2001;15(11):1311–1333. doi: 10.1101/gad.891601. [DOI] [PubMed] [Google Scholar]
- 11.Fan X, Matsui W, Khaki L, Stearns D, Chun J, Li YM, Eberhart CG. Notch pathway inhibition depletes stem-like cells and blocks engraftment in embryonal brain tumors. Cancer Res. 2006;66(15):7445–7452. doi: 10.1158/0008-5472.CAN-06-0858. [DOI] [PubMed] [Google Scholar]
- 12.Fan X, Eberhart CG. Medulloblastoma stem cells. J Clin Oncol. 2008;26(17):2821–2827. doi: 10.1200/JCO.2007.15.2264. [DOI] [PMC free article] [PubMed] [Google Scholar]
- 13.Fan X, Khaki L, Zhu TS, Soules ME, Talsma CE, Gul N, Koh C, Zhang J, Li YM, Maciaczyk J, Nikkhah G, Dimeco F, Piccirillo S, Vescovi AL, Eberhart CG. NOTCH pathway blockade depletes CD133-positive glioblastoma cells and inhibits growth of tumor neurospheres and xenografts. Stem Cells. 2010;28(1):5–16. doi: 10.1002/stem.254. [DOI] [PMC free article] [PubMed] [Google Scholar]
- 14.Piccirillo SG, Reynolds BA, Zanetti N, Lamorte G, Binda E, Broggi G, Brem H, Olivi A, Dimeco F, Vescovi AL. Bone morphogenetic proteins inhibit the tumorigenic potential of human brain tumour-initiating cells. Nature. 2006;444(7120):761–765. doi: 10.1038/nature05349. [DOI] [PubMed] [Google Scholar]
- 15.Reis CA, Osorio H, Silva L, Gomes C, David L. Alterations in glycosylation as biomarkers for cancer detection. J Clin Pathol. 2010;63(4):322–329. doi: 10.1136/jcp.2009.071035. [DOI] [PubMed] [Google Scholar]
- 16.Hakomori S. Aberrant glycosylation in tumors and tumor-associated carbohydrate antigens. Adv Cancer Res. 1989;52:257–331. doi: 10.1016/s0065-230x(08)60215-8. [DOI] [PubMed] [Google Scholar]
- 17.Fuster MM, Esko JD. The sweet and sour of cancer: glycans as novel therapeutic targets. Nat Rev Cancer. 2005;5(7):526–542. doi: 10.1038/nrc1649. [DOI] [PubMed] [Google Scholar]
- 18.Yanagisawa M, Yu RK. The expression and functions of glycoconjugates in neural stem cells. Glycobiology. 2007;17(7):57R–74R. doi: 10.1093/glycob/cwm018. [DOI] [PubMed] [Google Scholar]
- 19.He J, Liu Y, Xie X, Zhu T, Soules M, DiMeco F, Vescovi AL, Fan X, Lubman DM. Identification of cell surface glycoprotein markers for glioblastoma-derived stem-like cells using a lectin microarray and LC-MS/MS approach. J Proteome Res. 2010;9(5):2565–2572. doi: 10.1021/pr100012p. [DOI] [PMC free article] [PubMed] [Google Scholar]
- 20.Wang Y, Wu SL, Hancock WS. Approaches to the study of N-linked glycoproteins in human plasma using lectin affinity chromatography and nano-HPLC coupled to electrospray linear ion trap--Fourier transform mass spectrometry. Glycobiology. 2006;16(6):514–523. doi: 10.1093/glycob/cwj091. [DOI] [PubMed] [Google Scholar]
- 21.Xiong L, Andrews D, Regnier F. Comparative proteomics of glycoproteins based on lectin selection and isotope coding. J Proteome Res. 2003;2(6):618–625. doi: 10.1021/pr0340274. [DOI] [PubMed] [Google Scholar]
- 22.North SJ, Hitchen PG, Haslam SM, Dell A. Mass spectrometry in the analysis of N-linked and O-linked glycans. Curr Opin Struct Biol. 2009;19(5):498–506. doi: 10.1016/j.sbi.2009.05.005. [DOI] [PMC free article] [PubMed] [Google Scholar]
- 23.Qiu R, Regnier FE. Use of multidimensional lectin affinity chromatography in differential glycoproteomics. Anal Chem. 2005;77(9):2802–2809. doi: 10.1021/ac048751x. [DOI] [PubMed] [Google Scholar]
- 24.Kaji H, Saito H, Yamauchi Y, Shinkawa T, Taoka M, Hirabayashi J, Kasai K, Takahashi N, Isobe T. Lectin affinity capture, isotope-coded tagging and mass spectrometry to identify N-linked glycoproteins. Nat Biotechnol. 2003;21(6):667–672. doi: 10.1038/nbt829. [DOI] [PubMed] [Google Scholar]
- 25.Yang Z, Harris LE, Palmer-Toy DE, Hancock WS. Multilectin affinity chromatography for characterization of multiple glycoprotein biomarker candidates in serum from breast cancer patients. Clin Chem. 2006;52(10):1897–1905. doi: 10.1373/clinchem.2005.065862. [DOI] [PubMed] [Google Scholar]
- 26.Zhang H, Li XJ, Martin DB, Aebersold R. Identification and quantification of N-linked glycoproteins using hydrazide chemistry, stable isotope labeling and mass spectrometry. Nat Biotechnol. 2003;21(6):660–666. doi: 10.1038/nbt827. [DOI] [PubMed] [Google Scholar]
- 27.Bond MR, Kohler JJ. Chemical methods for glycoprotein discovery. Curr Opin Chem Biol. 2007;11(1):52–58. doi: 10.1016/j.cbpa.2006.11.032. [DOI] [PubMed] [Google Scholar]
- 28.Tian R, Wang S, Elisma F, Li L, Zhou H, Wang L, Figeys D. Rare cell proteomic reactor applied to SILAC based quantitative proteomic study of human embryonic stem cell differentiation. Mol Cell Proteomics. 2010 doi: 10.1074/mcp.M110.000679. [DOI] [PMC free article] [PubMed] [Google Scholar]
- 29.Nasrabadi D, Rezaei Larijani M, Pirhaji L, Gourabi H, Shahverdi A, Baharvand H, Salekdeh GH. Proteomic analysis of monkey embryonic stem cell during differentiation. J Proteome Res. 2009;8(3):1527–1539. doi: 10.1021/pr800880v. [DOI] [PubMed] [Google Scholar]
- 30.Prokhorova TA, Rigbolt KT, Johansen PT, Henningsen J, Kratchmarova I, Kassem M, Blagoev B. Stable isotope labeling by amino acids in cell culture (SILAC) and quantitative comparison of the membrane proteomes of self-renewing and differentiating human embryonic stem cells. Mol Cell Proteomics. 2009;8(5):959–970. doi: 10.1074/mcp.M800287-MCP200. [DOI] [PMC free article] [PubMed] [Google Scholar]
- 31.Puente LG, Borris DJ, Carriere JF, Kelly JF, Megeney LA. Identification of candidate regulators of embryonic stem cell differentiation by comparative phosphoprotein affinity profiling. Mol Cell Proteomics. 2006;5(1):57–67. doi: 10.1074/mcp.M500166-MCP200. [DOI] [PubMed] [Google Scholar]
- 32.Steiniger SC, Coppinger JA, Kruger JA, Yates J, 3rd, Janda KD. Quantitative mass spectrometry identifies drug targets in cancer stem cell-containing side population. Stem Cells. 2008;26(12):3037–3046. doi: 10.1634/stemcells.2008-0397. [DOI] [PMC free article] [PubMed] [Google Scholar]
- 33.Janot M, Audfray A, Loriol C, Germot A, Maftah A, Dupuy F. Glycogenome expression dynamics during mouse C2C12 myoblast differentiation suggests a sequential reorganization of membrane glycoconjugates. BMC Genomics. 2009;10:483. doi: 10.1186/1471-2164-10-483. [DOI] [PMC free article] [PubMed] [Google Scholar]
- 34.Alvarez-Manilla G, Warren NL, Atwood J, 3rd, Orlando R, Dalton S, Pierce M. Glycoproteomic analysis of embryonic stem cells: identification of potential glycobiomarkers using lectin affinity chromatography of glycopeptides. J Proteome Res. 2010;9(5):2062–2075. doi: 10.1021/pr8007489. [DOI] [PMC free article] [PubMed] [Google Scholar]
- 35.Galli R, Binda E, Orfanelli U, Cipelletti B, Gritti A, De Vitis S, Fiocco R, Foroni C, Dimeco F, Vescovi A. Isolation and characterization of tumorigenic, stem-like neural precursors from human glioblastoma. Cancer Res. 2004;64(19):7011–7021. doi: 10.1158/0008-5472.CAN-04-1364. [DOI] [PubMed] [Google Scholar]
- 36.Bradford MM. A rapid and sensitive method for the quantitation of microgram quantities of protein utilizing the principle of protein-dye binding. Anal Biochem. 1976;72:248–254. doi: 10.1016/0003-2697(76)90527-3. [DOI] [PubMed] [Google Scholar]
- 37.He J, Liu Y, He S, Wang Q, Pu H, Ji J. Proteomic analysis of a membrane skeleton fraction from human liver. J Proteome Res. 2007;6(9):3509–3518. doi: 10.1021/pr070197v. [DOI] [PubMed] [Google Scholar]
- 38.Link AJ, Eng J, Schieltz DM, Carmack E, Mize GJ, Morris DR, Garvik BM, Yates JR., 3rd Direct analysis of protein complexes using mass spectrometry. Nat Biotechnol. 1999;17(7):676–682. doi: 10.1038/10890. [DOI] [PubMed] [Google Scholar]
- 39.Griffin NM, Yu J, Long F, Oh P, Shore S, Li Y, Koziol JA, Schnitzer JE. Label-free, normalized quantification of complex mass spectrometry data for proteomic analysis. Nat Biotechnol. 2010;28(1):83–89. doi: 10.1038/nbt.1592. [DOI] [PMC free article] [PubMed] [Google Scholar]
- 40.Sardiu ME, Washburn MP. Enriching quantitative proteomics with SI(N) Nat Biotechnol. 2010;28(1):40–42. doi: 10.1038/nbt0110-40. [DOI] [PubMed] [Google Scholar]
- 41.Wang Y, Ao X, Vuong H, Konanur M, Miller FR, Goodison S, Lubman DM. Membrane glycoproteins associated with breast tumor cell progression identified by a lectin affinity approach. J Proteome Res. 2008;7(10):4313–4325. doi: 10.1021/pr8002547. [DOI] [PMC free article] [PubMed] [Google Scholar]
- 42.Trombetta ES, Ebersold M, Garrett W, Pypaert M, Mellman I. Activation of lysosomal function during dendritic cell maturation. Science. 2003;299(5611):1400–1403. doi: 10.1126/science.1080106. [DOI] [PubMed] [Google Scholar]
- 43.Nabavi N, Urukova Y, Cardelli M, Aubin JE, Harrison RE. Lysosome dispersion in osteoblasts accommodates enhanced collagen production during differentiation. J Biol Chem. 2008;283(28):19678–19690. doi: 10.1074/jbc.M802517200. [DOI] [PubMed] [Google Scholar]
- 44.Hernebring M, Brolen G, Aguilaniu H, Semb H, Nystrom T. Elimination of damaged proteins during differentiation of embryonic stem cells. Proc Natl Acad Sci U S A. 2006;103(20):7700–7705. doi: 10.1073/pnas.0510944103. [DOI] [PMC free article] [PubMed] [Google Scholar]
- 45.Jensen LJ, Kuhn M, Stark M, Chaffron S, Creevey C, Muller J, Doerks T, Julien P, Roth A, Simonovic M, Bork P, von Mering C. STRING 8--a global view on proteins and their functional interactions in 630 organisms. Nucleic Acids Res. 2009;37(Database issue):D412–D416. doi: 10.1093/nar/gkn760. [DOI] [PMC free article] [PubMed] [Google Scholar]
- 46.O'Brien JS, Kishimoto Y. Saposin proteins: structure, function, and role in human lysosomal storage disorders. FASEB J. 1991;5(3):301–308. doi: 10.1096/fasebj.5.3.2001789. [DOI] [PubMed] [Google Scholar]
- 47.Kishimoto Y, Hiraiwa M, O'Brien JS. Saposins: structure, function, distribution, and molecular genetics. J Lipid Res. 1992;33(9):1255–1267. [PubMed] [Google Scholar]
- 48.Haidar B, Kiss RS, Sarov-Blat L, Brunet R, Harder C, McPherson R, Marcel YL. Cathepsin D, a lysosomal protease, regulates ABCA1-mediated lipid efflux. J Biol Chem. 2006;281(52):39971–39981. doi: 10.1074/jbc.M605095200. [DOI] [PubMed] [Google Scholar]
- 49.Galjart NJ, Gillemans N, Harris A, van der Horst GT, Verheijen FW, Galjaard H, d'Azzo A. Expression of cDNA encoding the human "protective protein" associated with lysosomal beta-galactosidase and neuraminidase: homology to yeast proteases. Cell. 1988;54(6):755–764. doi: 10.1016/s0092-8674(88)90999-3. [DOI] [PubMed] [Google Scholar]
- 50.Galjart NJ, Morreau H, Willemsen R, Gillemans N, Bonten EJ, d'Azzo A. Human lysosomal protective protein has cathepsin A-like activity distinct from its protective function. J Biol Chem. 1991;266(22):14754–14762. [PubMed] [Google Scholar]
- 51.Milev P, Friedlander DR, Sakurai T, Karthikeyan L, Flad M, Margolis RK, Grumet M, Margolis RU. Interactions of the chondroitin sulfate proteoglycan phosphacan, the extracellular domain of a receptor-type protein tyrosine phosphatase, with neurons, glia, and neural cell adhesion molecules. J Cell Biol. 1994;127(6 Pt 1):1703–1715. doi: 10.1083/jcb.127.6.1703. [DOI] [PMC free article] [PubMed] [Google Scholar]
- 52.Muller S, Kunkel P, Lamszus K, Ulbricht U, Lorente GA, Nelson AM, von Schack D, Chin DJ, Lohr SC, Westphal M, Melcher T. A role for receptor tyrosine phosphatase zeta in glioma cell migration. Oncogene. 2003;22(43):6661–6668. doi: 10.1038/sj.onc.1206763. [DOI] [PubMed] [Google Scholar]
- 53.Bourdon MA, Wikstrand CJ, Furthmayr H, Matthews TJ, Bigner DD. Human glioma-mesenchymal extracellular matrix antigen defined by monoclonal antibody. Cancer Res. 1983;43(6):2796–2805. [PubMed] [Google Scholar]
- 54.Filvaroff E, Stern DF, Dotto GP. Tyrosine phosphorylation is an early and specific event involved in primary keratinocyte differentiation. Mol Cell Biol. 1990;10(3):1164–1173. doi: 10.1128/mcb.10.3.1164. [DOI] [PMC free article] [PubMed] [Google Scholar]
Associated Data
This section collects any data citations, data availability statements, or supplementary materials included in this article.


