

Abstract
The present study determined whether: 1) the response to alcohol varied as a function of menstrual cycle phase and 2) women with a paternal history of alcoholism (FHP) were less sensitive to the effects of alcohol compared to women without a family history of alcoholism (FHN). The behavioral effects of alcohol (0.00, 0.25, 0.75 g/kg) were evaluated in 21 FHN and 24 FHP women; each dose was tested during both the midfollicular and late luteal phases of the menstrual cycle. Baseline negative mood was increased during the luteal phase compared to the follicular phase (increased Beck Depression scores and decreased Vigor, Arousal, and Friendly scores). Alcohol increased ratings of Drug Liking and Good Drug Effect more in the luteal phase than the follicular phase. FHP women had greater negative mood during the luteal phase and some of these dysphoric effects were increased by alcohol more in FHP women than FHN women. Alcohol impaired performance, with no group or menstrual cycle differences. However, consistent with previous studies, FHP women were less impaired by alcohol than FHN women on the balance task. These data indicate that 1) the differences in response to alcohol across the menstrual cycle are subtle, although alcohol is liked more during the luteal phase; 2) increases in dysphoric mood during the luteal phase are more pronounced in FHP women compared to FHN women, particularly after alcohol; and 3) the differences observed in response to alcohol between FHP and FHN women are less pronounced than previously shown in men.
Keywords: Alcohol, Females, Menstrual cycle, Family history of alcoholism, Subjective effects, Psychomotor performance
1. Introduction
Even though women generally consume less alcohol than men (Dawson and Archer, 1992) and have lower rates of alcoholism than men (Kessler et al., 1994), alcohol consumption among women has been increasing, particularly in young women (Mercer and Khavari, 1990; Wilsnack et al., 1994). A recent study confirmed that the gender gap in the U.S. is decreasing with respect to both alcohol consumption and alcohol use disorders (Keyes et al., 2008). Specifically, Keyes et al. (2008) found that among the youngest cohort of women, 16% reported a lifetime prevalence of frequent binge drinking compared to only 2% of the oldest cohort of women. Further, among the youngest cohort, the odds of men binge drinking was 2.66 times higher than for women, whereas in the oldest cohort, men were 10.55 times more likely to binge drink than women. Clearly alcohol consumption is increasing among women. Given that earlier studies showed that women progressed more rapidly to alcoholism (i.e. “telescoping”), despite drinking substantially less alcohol than men (Piazza et al., 1989; Ross, 1989), the rise in alcohol consumption among women is particularly concerning as it will likely further increase the prevalence of alcohol abuse and dependence in women.
Despite the increases in alcohol consumption among women, relatively few studies have adequately evaluated the behavioral effects of alcohol in women and the factors that may influence their response to alcohol under controlled conditions. One factor that may influence alcohol consumption or the behavioral response to alcohol in women is the menstrual cycle. In terms of alcohol pharmacokinetics across the menstrual cycle, the results of initial studies were inconclusive (see reviews by Gill, 1997; Lammers et al., 1995), while more recent studies have consistently failed to observe differences in alcohol pharmacokinetics across the menstrual cycle (Correa and Oga, 2004; Holdstock and de Wit, 2000). Similarly, early studies provided some suggestive evidence that the behavioral effects of alcohol varied across the menstrual cycle, but the findings across studies have been inconsistent and inconclusive in large part due to design limitations such as relying on self-reported drinking, not carefully monitoring or verifying menstrual cycle phase with hormone levels of estradiol and progesterone, small sample sizes, or a combination of these factors.
Only a few studies have carefully assessed the role of the menstrual cycle on the behavioral response to alcohol in women under controlled laboratory conditions in which menstrual cycle was confirmed with hormone levels. One study reported a greater reduction in saccadic eye movement in the late luteal phase compared to the midfollicular phase in 12 women with premenstrual dysphoric disorder, but not in 12 control women, following an intravenous infusion of alcohol (Nyberg et al., 2004). However, in that study, ratings of intoxication did not vary as a function of menstrual cycle phase in either group. Mumenthaler et al. (2001) found no differences in flight simulator performance or alcohol pharmacokinetics between the early follicular and midluteal phases of the menstrual cycle following alcohol administration (0.67 g/kg) among 24 female pilots. Lastly, Holdstock and de Wit (2000) tested 16 women at four distinct phases of the menstrual cycle (early follicular, late follicular, midluteal, late luteal) using a cumulative dosing alcohol procedure and the subjective effects, performance effects and alcohol choice did not vary across the menstrual cycle. At this time, there is limited evidence that menstrual cycle phase substantially alters either the pharmacokinetic or behavioral effects of alcohol, but these conclusions are based on a small number of carefully controlled laboratory studies and more definitive studies are needed.
Another factor that has been shown to alter the response to alcohol, particularly in men, is having a family history of alcoholism. In fact, a family history of alcoholism is one of the best predictors of subsequent alcohol abuse or dependence (Hinckers et al., 2006; Warner et al., 2007). A number of studies, primarily by Schuckit and colleagues, have shown that males with a first-degree family history of alcoholism (FHP) are less sensitive (i.e., have a low level of response) to the subjective and performance-impairing effects of alcohol (e.g., Pollock et al., 1986; Schuckit, 1984, 1985). These results were supported by a meta-analysis of 17 independent studies (Pollock, 1992) and a 10-year follow-up study showed that males who were less sensitive to the behavioral effects of alcohol were more likely to develop alcoholism, particularly if they had an alcoholic father (Schuckit, 1994). It should be noted that not all alcohol challenge studies in FHP males have shown a low response compared to FHN males (McCaul et al., 1990, 1991a, 1991b; Newlin and Thompson 1991, 1999; O’Malley and Maisto, 1985).
In contrast to the abundant number of alcohol challenge studies in FHP men, substantially fewer studies have assessed the behavioral response to alcohol in FHP women, with early studies reporting inconsistent differences between FHP and FHN females (Lex et al., 1988, 1994; Savoie et al., 1988). Over the last decade, studies with larger sample sizes have been conducted in FHP women. For instance, Schuckit et al. (2000) reported that FHP males (n = 75) and FHP females (n = 38) showed decreased ratings of intoxication and less impairment on body sway following a single dose of alcohol compared to FHN males (n = 68). However, that study reported no significant differences between FHP females and FHN females and this was attributed to the small sample of FHN females (n = 11). A more recent study compared ratings of intoxication and body sway following a single dose of alcohol in 25 FHP and 25 FHN females (Eng et al., 2005). Despite this larger sample, FHP women only showed significantly lower intoxication ratings at a single time point. Even after drug use, drinking history and breath alcohol levels were used as covariates and body sway data were corrected and transformed for skewness, there were minimal differences between FHP and FHN women on ratings of intoxication or body sway. In a previous study conducted in our laboratory (Evans and Levin, 2003), the role of a paternal history of alcoholism in response to alcohol (0, 0.25, 0.50, 0.75 g/kg) was assessed in 16 FHP women compared to 16 FHN women. Consistent with previous studies showing that FHP individuals have a lower response to alcohol, FHP women were less impaired by alcohol than FHN women, as shown by scores on the Digit Symbol Substitution Task (DSST) and observer-ratings of drug effect, but FHP women tended to report greater positive subjective effects than FHN women. Thus, at this time, in contrast to men, there is limited compelling evidence that FHP women have a low response to alcohol compared to FHN women.
A potential limitation of the alcohol response studies in FHP women conducted thus far is that the role of the menstrual cycle has been ignored. However, the study by Evans and Levin (2003) observed that FHP women reported more dysphoric mood than FHN women in the absence of drug administration, a finding that has been reported by other studies in FHP individuals (Ciraulo et al., 1996; Evans et al., 2000; Moss et al., 1989; de Wit and McCracken, 1990). At least among the studies involving FHP women (Ciraulo et al., 1996; Evans et al., 2000; Evans and Levin, 2003), these baseline differences in dysphoric mood might be related to dysphoric mood changes that occur in some women during different phases of the menstrual cycle, particularly the late luteal phase and the early follicular phase. To our knowledge, no studies have directly addressed whether the response to alcohol varies in FHP women across the menstrual cycle and studies that did investigate the effects of alcohol across the menstrual cycle either did not measure or did not report whether participants had family histories of alcoholism (e.g., Mumenthaler et al., 2001; Nyberg et al., 2004; but see Holdstock and de Wit, 2000). Thus, it remains unknown whether the response to alcohol varies across the menstrual cycle in FHP women.
Therefore, the present study was designed to improve and extend the previous alcohol challenge studies in women, with three primary objectives. The first objective was to conduct a controlled laboratory study to comprehensively assess the behavioral and subjective response to alcohol at different phases of the menstrual cycle in a large sample of women (n = 45). Since there is some evidence that women may drink more during the late luteal phase, we compared the effects of alcohol during the late luteal phase to the midfollicular phase (e.g., Harvey and Beckman, 1985; McLeod et al., 1994; Podolsky, 1963; Mello et al., 1990). The second objective was to extend our previous findings (Evans and Levin, 2003) and those of Eng et al. (2005) on the role of a family history of alcoholism in response to alcohol in women since this sample of 45 women consisted of 24 FHP and 21 FHN women. In the present study, FHP women had a confirmed paternal history of alcoholism (those with a maternal history of alcoholism were excluded) and FHN women had no first-degree family history of alcoholism or substance abuse. Lastly, in light of the baseline dysphoric mood changes observed previously in FHP women compared to FHN women, the third objective was to determine if there were any interactions between family history status and menstrual cycle phase on mood.
2. Materials and methods
2.1 Participants
Women who participated in this study responded to an advertisement in local newspapers recruiting female volunteers with and without a family history of alcoholism. Individuals were told that the purpose of the study was to determine the effects of various drugs (non-prescription or prescription) and alcohol on mood, vital signs and ability to perform certain tasks across the menstrual cycle. The Institutional Review Board of the New York State Psychiatric Institute approved this study. Participants gave their written informed consent before beginning the study and were paid for their participation.
A total of 55 women met full study criteria and started the study. All women were medically and psychiatrically healthy based on a complete physical examination, a structured clinical interview, 12-lead electrocardiogram, clinical blood chemistries, and urinalyses. None of the participants were pregnant based on plasma levels of circulating chorionic gonadotropin hormone (hCG), or nursing, and no one had been pregnant or had an abortion within the previous six months. All women were normally cycling and were not using hormonal contraceptives or any other prescription medications. In addition, no one had any current DSM-IV Axis I psychiatric disorders (American Psychiatric Association, 1994) within the last year, including psychoactive substance abuse or dependence (other than nicotine) based on the Structured Clinical Interview for DSM-IV (SCID I, First et al., 1995), which was conducted by a trained Master's level clinical interviewer. Participants were interviewed on three occasions: first by the investigator during the initial consent meeting, then by the Master’s level clinical interviewer, and finally by the physician during the physical examination. Few women met criteria for any lifetime Axis I disorders; 3 women in each group met past criteria for major depression and 3 women in the FHP group met past criteria for alcohol abuse. Women who abstained from alcohol or typically drank more than 20 drinks per week in the past year were also excluded. Our original intention was to recruit FHN and FHP women who were all light drinkers, similar to our previous studies comparing FHP and FHN women (Evans et al., 2000; Evans and Levin, 2003). However, in the ensuing years, we have seen a dramatic increase in alcohol consumption in women overall (see Keyes et al., 2008) and particularly FHP women. Therefore, in this study FHP women could be moderate drinkers as long as they did not meet criteria for alcohol abuse or dependence and drank less than 20 drinks/week. However, we maintained our previous criteria of requiring FHN women to be light drinkers because we have previously shown differences in the response to alcohol between light and moderate female drinkers (Evans and Levin, 2004) without a first-degree family history of alcoholism. Women who smoked cigarettes or used marijuana occasionally (< 1 time/week) were eligible. Individuals who consumed > 4 cups of coffee/day (the frequency and amount of all sources of caffeine use including coffee, tea, soft drinks and energy drinks was converted to cups of coffee/day for a standard reference) were excluded. None of the participants suffered from premenstrual dysphoric disorder based on the Premenstrual Assessment Form (Halbreich et al., 1982) and the modified Daily Ratings Form (see Evans et al., 1998 for details) that participants completed each evening throughout the study.
2.2 Assessment of family history of alcoholism and substance abuse
Family histories of alcoholism and drug abuse were assessed using the Family History Assessment Module (FHAM), a structured diagnostic instrument to assess major psychiatric disorders among biological first-, second- and third-degree relatives of the informant, originally developed for the Collaborative Study on the Genetics of Alcoholism (COGA; Rice et al., 1995). The screening question for alcoholism was “have any of your relatives ever had any family, job, school, police, or health problems because of drinking?” Similar questions were asked regarding substance abuse. For those relatives identified by the research participant as positive for alcohol and/or substance abuse, specific symptoms of alcohol and drug abuse were assessed using the Individual Assessment Module (IAM) questions related specifically to alcoholism (16 questions) and drug abuse/dependence (14 questions). For the diagnosis of alcoholism or drug abuse/dependence to be considered present, at least three questions had to be scored positively, respectively. Similar information on the density and presence of second-degree family histories of alcoholism and substance abuse was also obtained. Participants also gave written permission to contact several first-degree biological relatives (parents, siblings, children of ≥18 years of age) and provided the names, addresses and telephone numbers of these relatives. The relatives were then mailed a separate consent form telling them that their relative (e.g., daughter or sister) was participating in a survey regarding women's medical and psychological health, and that part of survey involved contacting relatives to ask similar questions. First-degree relatives who signed consent and participated in the telephone interview were sent a $25 money order for the interview.
Participants were accepted only if at least one, and usually two, adult first-degree relatives confirmed the family history of alcoholism and/or substance abuse (or lack of) in a telephone interview (see Evans et al., 2000 for details); this confirmation is crucial given that participants do not always have accurate information. In addition to the 55 women who started this study, another 11 women (17%) were specifically excluded because we could not corroborate the participants reported family history of alcohol or substance abuse when family members were interviewed. Females in the FHN group had no first-degree biological relatives (parents, siblings, children) with histories of alcohol or substance abuse. Females in the FHP group were required to have an alcoholic biological father and first-degree family histories of alcohol or substance abuse were allowed, with the exception of the mother to avoid the potential confound of in utero exposure associated with maternal alcoholism (Lipscomb and Nathan, 1980).
Out of the 55 women who started the study, 7 did not complete the study (6 due to lack of interest or schedule problems, 1 became pregnant) and another 3 completed the study, but their hormone levels indicated that the experimental sessions were not conducted during the correct menstrual cycle phases. Thus, data from 45 women were analyzed: 21 FHN women and 24 FHP women. Attempts were made to match the two groups on age, race, level of education, as well as their current and lifetime patterns of other drug use.
2.3 Design and experimental procedures
The women participated as outpatients at the New York State Psychiatric Institute. Data were collected on a range of subject-rated, observer-rated and performance measures before drug administration and over a 4 h time course following drug administration. After participants had passed all study entry criteria, they had a training session and a practice session; placebo capsules and a placebo beverage were administered during the practice session. The purpose of these sessions was to 1) familiarize participants with the routines to be followed, 2) provide training on the performance tasks, and 3) reduce expectancies related to capsule and beverage administration. Data from these sessions were not analyzed. Participants then started the double-blind testing phase: sessions were scheduled during the late luteal phase (1–5 days before the onset of menstruation) and during the midfollicular phase (6–10 days after the onset of menstruation). During each menstrual cycle phase participants received alcohol (0.0, 0.25, and 0.75 g/kg) on separate days. The dose order was randomized within each group and across the FHP and FHN groups.
The order of menstrual cycle phase was counterbalanced between the two groups and across women (i.e., half of the women in each group started testing in the follicular phase). Menstrual cycle phase was estimated based on the modified Daily Ratings Form (see Evans et al., 1998 for details) and ovulation kits, validated using hormone levels. Participants completed the modified Daily Ratings Form each evening throughout the study to track changes in mood symptoms across the menstrual cycle, document the onset and duration of menstruation, and record the number of standard alcoholic beverages consumed each day (one drink = one 12-oz beer, one 5-oz wine, or one shot of liquor). To determine the time of ovulation, participants provided daily urine samples during the midfollicular phase using OvuQuick® (QUIDEL Corp., San Diego, CA; Martini et al., 1994). This test is simple to use and is 96–99% accurate at detecting luteinizing hormone (LH) in urine. Participants were instructed to call the laboratory when they started menstruating or the ovulation kit turned positive. In the event that a woman began menstruating earlier than expected, failed to ovulate, or a session could not be scheduled for other reasons, missed sessions were rescheduled during the correct phase of the next menstrual cycle.
2.4 Experimental sessions
For each session, participants reported to the laboratory at 0830 and remained until 1430. They were instructed not to eat breakfast before reporting to the laboratory and to refrain from using all psychoactive drugs (with the exception of tobacco, caffeinated products and alcohol) for the duration of their participation in the study. Participants were instructed not to drink alcohol 24 h prior to, or following a session. Upon arrival to the laboratory, a urine specimen was collected and a breath alcohol test was conducted (Alco-Sensor III, Intoximeters, Inc., St. Louis, MO). Urine specimens were analyzed for the presence of illicit drugs. Out of all the urine samples collected throughout the study, only two participants (both in the FHN group) had positive urine drug screens: one participant was positive for opioids on one session due to a previous dental procedure and another participant was positive for cannabinoids. There were no positive breath alcohol tests on any sessions. When possible, each menstrual cycle phase blood samples were drawn for hormone assays in the morning before the tasks began (between 9–10 am) with the goal of measuring hormone levels on each woman at least once each menstrual cycle phase. Since women are often reluctant to have blood drawn repeatedly, participants were compensated $10 for each blood sample drawn for hormone levels. Hormone levels were obtained for 87% of the women. Weekly, urine pregnancy tests were performed. During sessions, cigarette smoking was only permitted after lunch, 30 min before an assessment battery (including vital signs) to limit the effects of nicotine on mood and performance.
After the drug and alcohol tests, participants ate a light breakfast (with a caffeinated beverage for those individuals who regularly consumed caffeine) and then completed the baseline assessment battery that consisted of computerized questionnaires and performance tasks. Immediately following the baseline assessment battery, participants ingested two capsules and a 350 ml beverage. The assessment battery was repeated at 0.5, 1, 2, 3 and 4 h after dosing. Additional breath alcohol levels were measured at 15 min and 90 min after dosing. After the 3 h assessment battery, participants were given 30 min to eat lunch. At the end of each session, participants were evaluated for signs of intoxication and were required to pass a field sobriety test. Participants were not allowed to leave the laboratory until breath alcohol concentrations were ≤20 mg/dl. As a safety precaution, they were not allowed to drive to and from the laboratory; they were provided subway fare at the end of each session. If the participant was still impaired, she either remained at the laboratory until the drug effects subsided or she was transported home in a car service. Participants were also instructed that they should not drive a car for eight hours after drug administration and should not take any medications or alcohol.
2.5 Assessment battery
Each assessment battery consisted of subjective-effects questionnaires and performance tasks. Participants were instructed to answer the subjective-effects questions based on how they felt at that time. The Beck Depression Inventory (BDI-II; Beck et al., 1996) and the State component of the State-Trait Anxiety Inventory (Spielberger et al., 1970) were completed at baseline, 2 and 4 h after dosing. The 72-item Profile of Mood States questionnaire (POMS; McNair et al., 1971) and a 50-item Visual Analog Scale (VAS) were completed at baseline, 0.5, 1, 2, 3 and 4 hr after dosing. For the POMS questionnaire, 10 scales were analyzed (see Evans et al., 2000 for details). To have all scales on a similar 5-point scale, total scores for each of the 8 major scales were divided by the number of items used to determine the scale score. The VAS was subjected to a cluster analysis that resulted in five clusters comprising 41 of the 50 items (see Evans and Levin, 2002). The “Personality Traits” cluster consisted of 8 items related to personality traits (e.g. “I feel friendly”), the “Physical Symptoms” cluster consisted of 12 items related to physical symptoms (e.g. “I have a headache”), the “Bad Effects” cluster consisted of 9 items related to negative subjective effects (e.g. “I feel miserable”), the “Elevated Mood” cluster consisted of 6 items related to positive drug effects (e.g. “I feel high”) and the “Sedation” cluster consisted of 4 items related to sedation (e.g. “I feel tired”). During each assessment battery after dosing, participants also completed a Drug Effect Questionnaire (DEQ; see Evans et al., 2000 for details).
The performance measures included four computerized tasks and two non-computerized tasks (see Evans et al., 2000 for details). All of the performance measures described below, with the exception of the word recall task, were conducted during the experimental sessions at baseline (before dosing) and 0.5, 1, 2, 3 and 4 h after dosing. The computerized tasks consisted of a 3-min Digit Symbol Substitution Test (DSST; McLeod et al., 1982), a 5-min Divided Attention task (DAT; Miller et al., 1988), and an immediate and delayed Digit Recall task (Roache and Griffiths, 1987). A balance task measured motor coordination (Evans et al., 1990) by assessing the participant's ability to stand upright for a maximum of 30 sec on each foot with eyes closed. Lastly, a paper/pencil Word Recall and Recognition task was conducted with immediate recall at 1.5 h, delayed recall at 2.5 h and 4 h, and delayed recognition at 4 h after drug administration (Evans et al., 1998).
2.6 Other measures
Observer ratings were completed by trained research assistants who were blinded to the drugs being administered. Observer ratings were conducted before dosing and 0.5, 1, 2, 3 and 4 h after dosing. Ratings were based on the overall level of effect that the staff member observed on each item since the last rating, based on observation of the participant's behavior rather than on the participant's verbal reports or ratings. The participant was rated on a 5-point scale, from 0, indicating normal, to 4, indicating extreme impairment or disruption, on 8 dimensions (e.g., sedation, strength of drug effect; see Evans et al., 1990 for details). A total observer-rating score was calculated by taking the sum of the 8 items at each time point. Heart rate and blood pressure were measured after approximately a 30-min rest period before each assessment battery while participants were in a seated position using a Sentry II vital signs monitor (Model 6100; NBS Medical Services, Costa Mesa, CA).
2.7 Drugs
To reduce alcohol expectancy effects, a double-dummy design was used and each participant ingested two capsules containing placebo and a beverage each laboratory session. Placebo capsules (size 0 gelatin) were filled with lactose powder. Alcohol dose was calculated based on the estimated total body water (TBW) of each participant using the following regression equation for females (Watson et al., 1980): TBW (l)= −2.097 + 0.1069 (height in cm) + 0.2466 (weight in kg). The volume of the beverage was held constant at 350 ml to control for any alcohol expectancy effects. The placebo and active beverage for a given individual were isocaloric (no more than a 10-calorie difference between beverages), using regular or low calorie tonic and juice and dextrose or Equal ® sweetener. The placebo beverage consisted of Canada Dry Tonic ® water and Ocean Spray Cranberry Juice Cocktail ® in a 3:1 ratio. The alcohol beverage consisted of the same mixture, with 100 proof Absolute ® vodka added, as needed. Each beverage was topped with 1 ml of vodka and 1 drop of peppermint oil. Participants had 5 min to consume the capsules and the entire beverage (placebo or alcohol) under the supervision of an investigator. Alcohol was given in doses of 0.5 and 1.5 g/l of total body water that approximates 0.25 and 0.75 g/kg, respectively. Both the staff and the participants were blind to the dose of alcohol.
2.8 Data analysis
Analyses were based on the 45 women who completed the entire study (21 FHN and 24 FHP). Student's t-tests and chi-square tests were used to compare demographic characteristics, depression and anxiety scores at screening, as well as current patterns of drug use, between females in the FHN and FHP groups.
The results from the training and practice sessions were not included in the data analyses. For all measures, separate four-factor repeated measures analyses of variance (ANOVA) using SUPERANOVA software were conducted with Group (FHN vs. FHP) as the between-subjects factor and Phase (follicular and luteal), Dose (0, 0.25, 0.75 g/kg) and Time (0, .5, 1, 2, 3 and 4 hr) and as the within-subjects factors.
Data were also analyzed based on peak drug effect. For peak effects, the direction (maximum or minimum) was determined based on inspection of the time course graphs for each measure. Separate three-factor repeated measures ANOVAs were conducted with Group as the between-subjects factor and Phase and Dose as the within-subjects factors.
Since the FHP group was comprised of an equal number of light drinkers and moderate drinkers, exploratory analyses, i.e., analyses not planned in the original design, were conducted to determine if drinking level altered the response to alcohol between light (n = 12) and moderate drinkers (n = 12) in the FHP group relative to the FHN group that consisted of light drinkers. The specific measures selected were based on measures that showed a group by dose or group by phase interaction between the FHN and FHP groups. Separate three-factor repeated measures analyses of variance (ANOVA) were conducted with Group (FHN, FHP light drinkers, FHP moderate drinkers) as the between-subjects factor and Phase (follicular and luteal), and Dose (0, 0.25, 0.75 g/kg) as within-subjects factors. Planned contrasts were used to compare FHP light drinkers to FHP moderate drinkers, FHP light drinkers to FHN women, and FHP moderate drinkers to FHN women.
For all analyses, results were considered statistically significant if p < 0.05 and Huynh-Feldt corrections were used.
3. Results
3.1 Demographics
Table 1 shows the demographic characteristics of females in the FHN and FHP groups. The two groups did not differ in terms of race, body mass index, education, and depression scores at screening. The FHP group tended to be slightly older than the FHN group and had small, but statistically higher anxiety scores at initial screening than FHN women. Table 1 also shows prospective alcohol consumption during the study based on the Daily Ratings Forms that participants completed each evening (mean of 80 days per participant). As mentioned above, participants were instructed that they could not drink the day before a session or the evening of a session. Only the days that participants were allowed to drink were included in the analyses. Although mean alcohol consumption was on the light end (average of 1–6 drinks each week), FHP women consumed significantly more alcohol than FHN women in terms of mean drinks/week, the percentage of drinking days, and the maximum drinks/occasion. However, there was no difference between the two groups in the number of participants who had a least a single binge-drinking episode (≥ 4 drinks on a single occasion). Upon further inspection of the alcohol consumption data, 50% of women in the FHP group drank at a moderate drinker level (≥ 7 drinks/week; mean = 9.9 drinks/week) and 50% of women in the FHP group drank at a light drinker level (< 7 drinks/week; mean = 2.3 drinks/week). FHP women also tended to consume more caffeine than FHN women. Among those who drank caffeine daily, the mean consumption was the equivalent of 0.78 and 1.67 cups of coffee for the FHN and FHP groups respectively, with a maximum of 4 cups/day in both groups. There were no significant differences between the two groups with respect to the number of individuals who smoked tobacco cigarettes or marijuana. None of the 7 women who reported currently smoking cigarettes met criteria for nicotine dependence and only 4 women reported smoking on a daily basis (range of 4–7 cigarettes/day). For those women who smoked marijuana, marijuana use was less than once per month.
Table 1.
Demographic Characteristics of Participants
| FHN Group (n = 21) | FHP Group (n = 24) | Significancea | |
|---|---|---|---|
| Age (mean years) | 27.9 (1.1) b range (21–40) | 31.5 (1.5) range (22–45) | p<0.06 |
| Race (White/Black/ Hispanic/Asian/Mixed) | 12 /4 /0/2 /3 | 18 /2 /0/2 /2 | n.s. |
| Body Mass Index (mean; kg/m2) | 22.7 (0.6) | 22.5 (0.7) | n.s. |
| Education (mean years) | 15.8 (0.3) | 16.0 (0.3) | n.s. |
| Beck Depression Inventory (mean) | 3.1 (0.8) | 4.1 (1.1) | n.s. |
| Trait Anxiety Inventory (mean) | 30.5 (1.5) | 37.4 (1.7) | p<0.005 |
| State Anxiety Inventory (mean) | 27.5 (1.1) | 32.5 (1.5) | p<0.02 |
| Menstrual Cycle Length (mean) | 28.6 (0.8) | 29.3 (0.7) | n.s. |
| Prospective Alcohol Consumptionc | |||
| Alcohol (mean drinks/week) | 1.9 (0.5) | 6.1 (0.9) | p< 0.001 |
| Absolute Range (drinks/week) | 0–6 | 1–16 | |
| Drinking Days (%) | 22.9 (4.1) | 43.5 (4.7) | p< 0.002 |
| Drinks/drinking day (mean) | 1.7 (0.1) | 2.4 (0.2) | p<0.02 |
| Maximum drinks/occasion (mean) | 3.7 (0.5) | 5.6 (0.5) | p< 0.02 |
| Binge drinkers ≥ 4 drinks/occasion (n) | 11 | 17 | n.s. |
| Other Current Drug Use | |||
| Caffeine (# participants) | 15 | 23 | p<0.06 |
| Tobacco (# participants) | 2 | 5 | n.s. |
| Marijuana (# participants) | 2 | 3 | n.s. |
| Family History Members with Alcoholism | |||
| Father only # (%) | NA | 16 (66.7) | |
| Father + 1st degree # (%) | NA | 3 (12.5) | |
| Father + 1st + 2nd degree # (%) | NA | 1 (4.2) | |
| Father + 2nd degree # (%) | NA | 4 (16.6) | |
| 2nd degree only # (%) | 2 (9.5) | NA | |
Quantitative data were tested with t-tests and frequency data were tested with chi-square or Fischer’s tests.
When mean data are given, standard errors are shown in parentheses.
Prospective alcohol consumption is somewhat lower than it would normally be if participants were allowed to drink every day. Women were instructed that they could not drink the day before a session or the evening of a session. Therefore, only the days that participants were allowed to drink were included.
n.s. Not significant.
NA Not applicable.
Table 1 also shows the distribution and density of first- and second-degree family members with a history of alcoholism for each group. Only 2 women in the FHN group had a second-degree family history of alcoholism, while 8 women in the FHP group had additional first-or second-degree family histories of alcoholism in addition to the father. With respect to substance abuse (data not shown), 1 FHN woman had a second-degree family history of substance abuse whereas 6 FHP women had family histories of substance abuse (5 first-degree and 1 second-degree family members).
When the FHP group was categorized into light and moderate drinkers, the density of a family history of alcoholism or substance abuse was much greater in the FHP women who were also moderate drinkers. Specifically, 7 FHP women who were moderate drinkers had additional first-or second-degree family histories of alcoholism or substance abuse compared to 3 FHP women who were light drinkers.
3.2 Hormone levels
Based on prospective tracking of the menstrual cycle and urinary ovulation kits, all women had ovulatory menstrual cycles that ranged from 24 to 40 days (mean of 29 days). To further confirm this, blood samples were collected to measure the hormones estradiol and progesterone. Based on the women who had blood samples collected (87%) in both menstrual cycle phases, estradiol levels were not significantly different in the luteal phase compared to the follicular phase (93.71 ± 7.06 pg/ml vs. 74.28 ± 10.68 pg/ml; p ≥ 0.05), whereas progesterone levels in the luteal phase were significantly higher than in the follicular phase in both FHN and FHP women (7.40 ± 0.76 ng/ml vs. 0.61 ± 0.04 ng/ml; p ≤ 0.0001), and there were no differences between the two groups.
3.3 Baseline differences
There were no main Group differences on any of the mood or performance measures at baseline (before dosing). However, a few measures showed a significant effect of Phase or a Group × Phase interaction at baseline. Specifically, scores on the Beck Depression Inventory [F(1,43) = 4.53; p <0.05], the Depression-Dejection subscale of the POMS [F(1,43) = 3.95; p <0.053], and the Bad Drug Effect cluster [F(1,43) = 9.25; p <0.01]were significantly higher in the luteal phase compared to the follicular phase. There was also a significant Phase × Group interaction on the Beck Depression Inventory [F(1,43) = 4.05; p <0.05] and the Tension-Anxiety subscale of the POMS [F(1,43) = 5.81; p <0.03] in that FHP women were more depressed and anxious during the luteal phase compared to FHN women. Similar trends were observed on the State Anxiety scale (p<0.09), and the Friendly subscale of the POMS (p<0.07), in that FHP women reported more dysphoric effects in the luteal phase compared to FHN women at baseline.
3.4 Breath alcohol levels
Breath alcohol levels increased as a function of Dose [F(2,86) = 1274.55; p <0.0001] and changed over Time [F(7,301) = 102.77; p <0.0001] in both FHP and FHN women, with breath alcohol levels peaking within one hour. For example, the top panel of Figure 1 shows breath alcohol levels following the 0.75 g/kg dose as a function of Group, Phase and Time. There was a trend for FHP women to have higher breath alcohol levels during the luteal phase after the 0.75 g/kg dose of alcohol (Phase × Group × Dose interaction; p < 0.07). The bottom panel of Figure 1 shows peak breath alcohol levels as a function of Group, Phase and Dose; in addition to a main effect of Dose, there was a trend for breath alcohol levels to be higher in the luteal phase (Phase effect, p< 0.07), primarily observed in FHP women. There were no other main effects or interactions.
Fig. 1.

Top panel: time course function of breath alcohol levels as a function of group and menstrual cycle phase for the 0.75 g/kg dose of alcohol only. X-axes: 0 indicates predrug baseline. Data points show means (FHN =21; FHP = 24), vertical bars show ± 1 S.E.M. Some error bars have been omitted for clarity and the absence of any bars indicates 1 S.E.M. fell within the area of the data symbol. Bottom panel: peak breath alcohol levels for the two active doses of alcohol as a function of group and phase. Data points show means (FHN =21; FHP = 24); vertical bars show + 1 S.E.M.
3.5 Effects of alcohol on subjective measures
Based on the time course analyses, alcohol produced significant Dose [Fs >3.6, Ps<0.04], Time [Fs>4.1, Ps<0.03], and/or Dose × Time interactions [Fs>2.7, Ps<0.03], for all of the POMS subscales, the WAS clusters, the Beck Depression Inventory, the State Anxiety Scale and all items on the Drug Effect Questionnaire. Only ratings of “Take Again” showed a main effect of Group [F(1,43) = 6.83; p <0.01] with FHP more willing to take the drug again, regardless of alcohol dose or menstrual cycle phase.
In addition, there were several subjective measures that showed Phase, Phase × Dose or Phase × Group interactions. Overall, Beck Depression scores were significantly higher during the luteal phase compared to the follicular phase [Phase effect; F(1,43) = 6.81; p <0.02], whereas Vigor scores were significantly lower during the luteal phase [Phase effect; F(1,43) = 4.52; p <0.04]. Similarly, Arousal scores (Phase; p < 0.07) and Friendly scores (Phase; p < 0.08) tended to be lower during the luteal phase compared to the follicular phase. Alcohol produced greater dose-related increases in Good Drug Effect ratings [Phase × Dose interaction; F(2,86) = 3.2; p <0.05] during the luteal phase, whereas alcohol produced greater Tension-Anxiety scores [Phase × Dose interaction; F(2,86) = 3.30; p <0.05] during the follicular phase in both groups of women.
FHP women had higher Confusion-Bewilderment scores than FHN women following the high dose of alcohol [Dose × Time × Group interaction; F(10,430) = 2.72; p <0.04]. Also during the luteal phase, FHP women had lower Friendly scores [Phase × Group interaction; F(1,43) = 4.72; p <0.04] and higher Depression-Dejection scores [F(1,43) = 5.81; p <0.03] than FHN women, regardless of alcohol dose. The high dose of alcohol increased ratings of Drug Liking to a similar extent in both groups of women during the luteal phase, but ratings of Drug Liking were lower in FHN women during the follicular phase compared to the luteal phase [Phase × Dose × Time × Group interaction; F(8,344) = 2.33; p <0.04; see peak effects in Fig. 2].
Fig. 2.

Peak scores on the Beck Depression Inventory, ratings of Good Drug Effect and Drug Liking as a function of group, menstrual cycle phase and alcohol dose. Data points show means (FHN =21; FHP = 24); vertical bars show + 1 S.E.M.
Figure 2 shows peak data for selected subjective measures. Beck Depression scores were significantly higher in the luteal phase compared to the follicular phase [Phase effect; F(1,43) = 7.59; p <0.01] and were increased by alcohol administration [Dose effect; F(2,86) = 6.69; p <0.004]. There was also a trend for alcohol to increase Beck Depression scores more in FHP women than FHN women during the luteal phase (Phase × Dose × Group interaction; p<0.09). Similarly, FHP women had slightly higher Depression-Dejection scores than FHN women during the luteal phase [Phase × Group interaction; F(1,43) = 5.33; p <0.03]. Figure 3 also shows that alcohol produced dose-related increases on ratings of Good Drug Effect [Dose effect; F(2,86) = 72.21; p <0.0001], with the high dose of alcohol increasing ratings more during the luteal phase compared to the follicular phase [Phase × Dose interaction; F(2,86) = 4.07; p <0.03]. A similar pattern was observed for ratings of Drug Liking, but was not statistically significant.
Fig. 3.
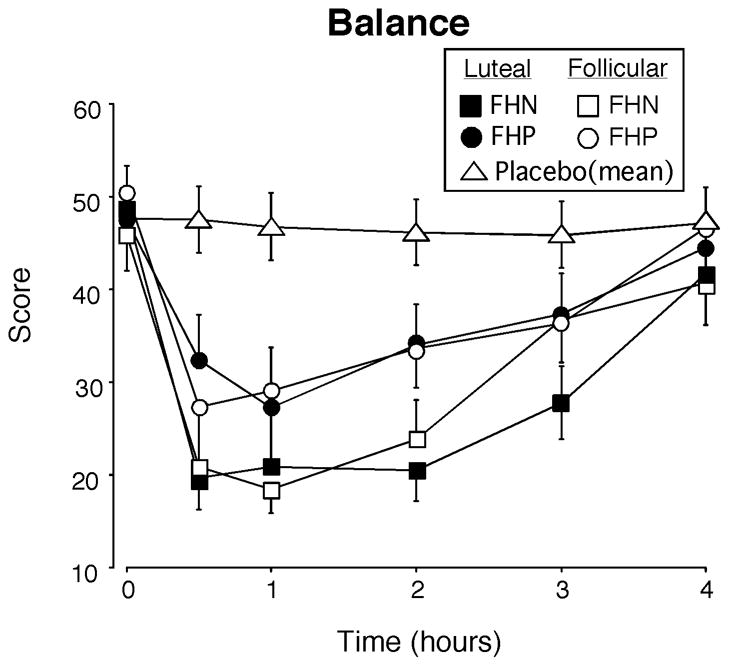
Time course function for the balance task as a function of group and menstrual cycle phase. For clarity, only the 0.75 g/kg dose of alcohol is illustrated and the placebo data represent the mean for the two groups combined across the two phases. Balance scores could range from 0–60. X-axes: 0 indicates predrug baseline. Data points show means (FHN =21; FHP = 24), vertical bars show ± 1 S.E.M. Some error bars have been omitted for clarity and the absence of any bars indicates 1 S.E.M. fell within the area of the data symbol.
3.6 Effects of alcohol on performance and observer ratings
Based on the time course analyses, alcohol impaired all of the performance measures and the total Observer Rating score as indicated by main effects of Dose [Fs >4.12, Ps<0.04], Time [Fs>2.95, Ps<0.04], and/or Dose × Time interactions [Fs>2.98, Ps<0.03]. For all but one of the performance tasks, there were no differences on performance between the luteal and follicular phases or between FHP and FHN women. However, Figure 3 shows that performance on the balance task (a measure of motor coordination) was significantly more impaired during the luteal phase compared to the follicular phase [Phase effect; F(1,43)=6.42, P<0.02], in both groups of women and that FHP women recovered more rapidly than FHN women [Group × Time interaction; F(5,215)=2.38, p<0.05].
Alcohol also produced significant dose-related impairment on all of the performance measures when data were analyzed as peak scores. Figure 4 illustrates peak data for the balance task, the DSST and 2 hour delayed word recall. There was an overall trend for FHP women to be less impaired on the balance task than FHN women (p<0.07); as shown in Figure 4, FHP women were less impaired by alcohol than FHN women, but there were no differences between the two groups when placebo was administered and there were no differences as a function of menstrual cycle phase. Figure 4 also shows that alcohol impaired DSST performance and delayed word recall, but there were no significant differences as a function of menstrual cycle phase or between the two groups. Similar effects were observed for all of the other performance measures and total Observer-rating scores.
Fig. 4.

Peak scores for selected performance tasks, including balance, the DSST (number correct) and delayed word recall as a function of group, menstrual cycle phase and alcohol dose. Data points show means (FHN =21; FHP = 24); vertical bars show + 1 S.E.M.
3.7 FHP women: Effects of alcohol in light vs. moderate drinkers
Given that FHP women differed in their pattern of alcohol consumption compared to FHN women, additional analyses compared light (n = 12) and moderate drinkers (n = 12) in the FHP group relative to the FHN group for peak Beck Depression scores, ratings of Drug Liking, and balance scores. Beck Depression scores were higher in the luteal phase [Phase effect; F(2,42) = 9.18; p <0.005] relative to the follicular phase and increased as a function of alcohol dose [Dose effect; F(2,84) = 6.96; p <0.004], but there were no differences between the 3 subgroups and no interactions. Ratings of Drug Liking increased as a function alcohol dose [Dose effect; F(2,84) = 28.93; p <0.0001] and balance scores decreased as a function of alcohol dose [Dose effect; F(2,84) = 60.39; p <0.0001], with no differences as a function of menstrual cycle phase or between the 3 subgroups. Figure 5 shows peak data for balance scores collapsed between the two menstrual cycle phases in each of the 3 subgroups; there were no differences between FHP light and FHP moderate drinkers at any dose. However, FHP light drinkers and FHP moderate drinkers were both less impaired than FHN women on the balance task following the high dose of alcohol (Ps<0.04), whereas only FHP moderate drinkers were less impaired than FHN women following the lower dose of alcohol (p=0.005).
Fig. 5.
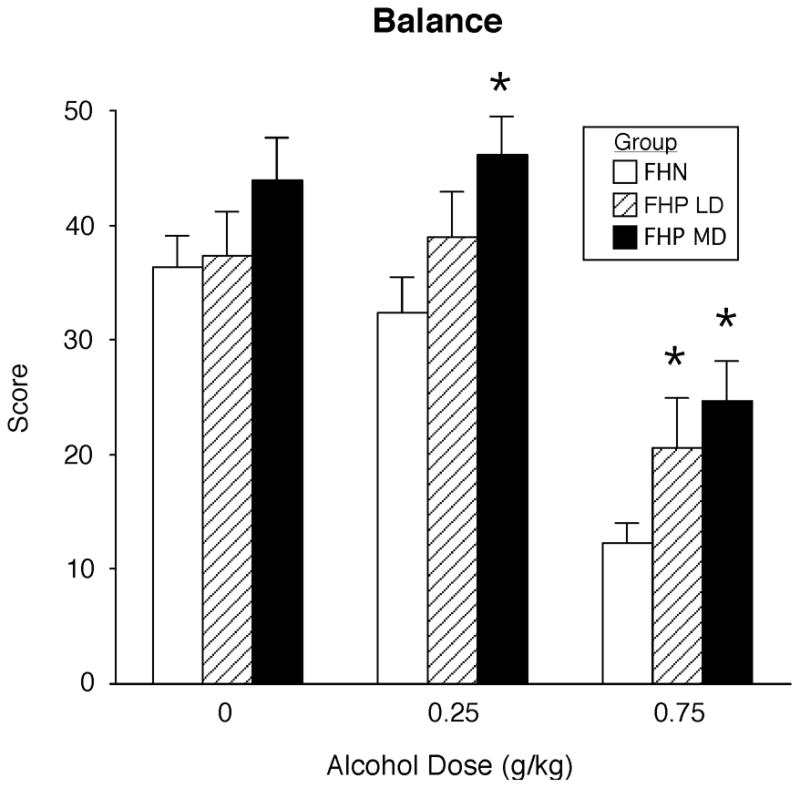
Peak scores for the balance task compared across the FHN group (21), the FHP light drinkers (LD = 12) and the FHP moderate drinkers (MD = 12) as a function of alcohol dose. For clarity, data are collapsed across the two menstrual cycle phases. Data points show means and vertical bars show + 1 S.E.M. * above a bar indicates a significant difference between that group and the FHN group.
4. Discussion
4.1 Baseline differences
There were several baseline differences between the two groups of women; FHP women tended be older, were more anxious and drank more alcohol than FHN women. In addition, FHP women reported more anxiety and depression during the luteal phase compared to FHN women before alcohol administration. This was noteworthy given that women were excluded if they experienced moderate to severe premenstrual symptoms and both groups had a similar number of women (3) who had a past history of depression. Similar changes in mood across the menstrual cycle have also been reported in normal women without PMDD (Reed et al., 2008), but not all studies have observed differences in mood across the menstrual cycle (e.g., Holdstock and de Wit, 2000). It is unclear what accounts for these discrepancies across studies.
4.2 Alcohol effects and the menstrual cycle
Alcohol produced two distinct effects related to menstrual cycle phase. First, alcohol administration actually enhanced some of the dysphoric mood effects observed at baseline during the luteal phase. Conversely, alcohol also produced greater positive subjective effects (i.e., Drug Liking and Good Drug Effect) in the luteal phase compared to the follicular phase. The modest increases in dysphoric mood and the positive subjective response to alcohol observed during the luteal phase lend support to previous clinical studies and surveys suggesting that women drink more alcohol in the late luteal phase to alleviate dysphoric symptoms, particularly women with moderate to severe premenstrual symptoms (e.g., Harvey and Beckman, 1985; McLeod et al., 1994; Podolsky, 1963). In fact, one controlled laboratory study showed that among women with premenstrual symptoms, alcohol consumption increased during the late luteal phase corresponding to self-reported increases in negative mood and discomfort (Mello et al., 1990). Although women with PMDD, or even moderate to severe premenstrual symptoms, were excluded in the present study, these findings suggest that clinically insignificant mood fluctuations among normal women may lead to increased positive effects from alcohol that could lead to increased drinking.
Several other studies have failed to observe differences in the subjective response to alcohol across the menstrual cycle (e.g., Freitag and Adesso, 1993; Nyberg et al., 2004; see review by Terner and de Wit, 2006). In fact, one of the most carefully designed and controlled laboratory studies (Holdstock and de Wit, 2000) found no differences in the subjective response to alcohol across the menstrual cycle, despite using some of the same subjective questionnaires as the present study. In that study, women were also allowed to self-administer additional doses of alcohol, but there were no differences across the menstrual cycle in either the number of women choosing to drink or the number of additional drinks consumed. There are several possible explanations for the inconsistent findings between the two studies. First, in the present study, the response to acute doses of alcohol were tested over a 5-hour period on separate days, whereas a cumulative dosing procedure was used by Holdstock and de Wit (2000), in which a low dose of alcohol (0.2 g/kg) was administered every 30 min for a maximal dose of 0.6 g/kg and peak breath alcohol levels were lower than 75 mg/dl. A higher dose of alcohol was used in the present study (0.75 g/kg), with correspondingly higher peak breath alcohol levels (over 90 mg/dl). Another difference is that the sample size in the Holdstock and de Wit (2000) study was substantially smaller (n=16) than the present study (n=45). Another important difference is that we specifically recruited women with a paternal history of alcoholism (n=25), whereas Holdstock and de Wit (2000) reported that only two women were FHP. As addressed in the Introduction and discussed below, the presence of a family history of alcoholism can alter the response to alcohol.
Lastly, only a few well-controlled studies have assessed the effects alcohol on performance at different phases of the menstrual cycle and although alcohol impaired performance on the DSST (Holdstock and de Wit, 2000) and flight simulator performance among female pilots (Mumenthaler et al., 2001), no menstrual cycle phase differences were observed. The results of the present study confirm and extend these previous studies in that, with the exception that alcohol produced slightly greater impairment on the balance task during the luteal phase, alcohol impaired a wide range of performance tasks to a similar extent in both menstrual cycle phases.
4.3 Alcohol effects and family history of alcoholism
While FHP women reported somewhat more dysphoric mood effects than FHN women at baseline, these differences were observed primarily during the luteal phase. Further, the range and magnitude of symptoms was less pronounced than has been previously reported in other studies that did not control for menstrual cycle phase (Ciraulo et al., 1996; Evans et al., 2000; Evans and Levin, 2003), or were conducted primarily in FHP and FHN men (e.g., Moss et al., 1989; de Wit and McCracken, 1990). For instance, in one of our previous studies (Evans and Levin, 2003), FHP women differed from FHN women at baseline on most of the POMS subscales. It is unclear why FHP women in the present study reported less dysphoric mood. One possibility is that in the present study FHP women drank significantly more than FHN women (6.1 vs 1.9 drinks/week) compared to our previous study (Evans and Levin, 2003), although none of the women had an alcohol used disorder. This increase in alcohol consumption among the FHP women could simply reflect the general increase in alcohol consumption among women in the U.S. (Keyes et al., 2008), although one would have expected a corresponding increase in alcohol consumption in the FHN group as well. While it is possible that alcohol consumption may be increasing more among FHP women relative to FHN women, additional epidemiological studies are needed to determine if this is true. Alternatively, FHP women may be drinking more to improve their underlying dysphoric mood. One study that prospectively monitored premenstrual symptoms and drinking behavior found that alcohol consumption increased during the luteal phase in FHP women, but not in FHN women, although there was no relationship between premenstrual symptoms and alcohol use (Svikis et al., 2006). Unfortunately, since women in that study were instructed to complete the forms at the end of the day (similar to the Daily Ratings Form used in the present study), it is unknown whether the lower premenstrual ratings in FHP women compared to FHN women were related to their increased alcohol consumption.
For the most part, FHP women showed a similar subjective response following alcohol administration compared to FHN women. For instance, alcohol produced similar increases in positive subjective effects in FHP and FHN women, and these ratings were higher during the luteal phase. These results contrast to some extent with our previous study (Evans and Levin, 2003) showing that FHP women tended to have higher ratings of Good Drug Effect and Drug Liking than FHN women in response to alcohol. Unfortunately, other studies comparing FHP and FHN women typically have not incorporated subjective measures correlated with abuse liability (Eng et al., 2005; Schuckit et al., 2000). Thus, the reason for the inconsistent findings between our two studies is unclear, but could be due to the larger sample size in the present study or the lack of menstrual cycle phase information in our previous study (Evans and Levin, 2003).
In addition to producing positive subjective effects, alcohol generally produced comparable changes in mood between FHP and FHN women. However, some of the baseline dysphoric mood observed in FHP women did not improve after alcohol administration (e.g., increased depression and decreased friendliness) and moreover, alcohol increased ratings of confusion and depression more in FHP women than FHN women, particularly during the luteal phase. Taken together with previous studies documenting that depression predicts increased alcohol consumption and problem drinking, particularly among women (Gilman and Abraham, 2001; Hartka et al., 1991; Helzer and Pryzbeck, 1988) and that individuals with a paternal history of alcoholism are at increased risk to develop depression and alcoholism (Anda et al., 2002), these data suggest that FHP women may be at greater risk for abusing alcohol in an attempt to relieve their dysphoric symptoms.
Alcohol challenge studies in men have generally shown that FHP men have decreased ratings of intoxication and reduced body sway compared to FHN men (O’Malley and Maisto, 1985; Pollock et al., 1986; Schuckit, 1984; Schukit et al., 2000). In contrast, a reduced sensitivity to intoxication has been less evident among the studies conducted to date in FHP women. For instance, an early study by Schukit et al. (2000), failed to show significant differences between FHP and FHN women on ratings of intoxication, most likely due to the small number of FHN women (n =11). Despite a larger sample size in a subsequent study (Eng et al., 2005), ratings of intoxication using the SHAS7 (Subjective High Assessment Scale) were only lower in FHP women compared to FHN women at a single time point. Although an intoxication scale was not used in the present study, based on other subjective measures, such as ratings of Drug Strength, there was no evidence that FHP women had a reduced subjective response to alcohol than FHN women and these results are consistent with a previous study from our laboratory (Evans and Levin, 2003). Among the studies that have measured the effects of alcohol on performance in FHP and FHN women, there has been some evidence that FHP women are less impaired by alcohol on either the DSST (Evans and Levin, 2003; Lex et al., 1988) or a measure of motor coordination (Eng et al., 2005; Evans and Levin, 2003; Lex et al., 1988). For instance, in the study by Eng et al. (2005), 25 FHN and 25 FHP women were administered a single dose of alcohol (0.75 g/kg); FHP women tended to be less impaired on body sway, but these modest effects were only observed after various transformations of the raw data. The present study confirms and extends these findings in that FHP women were significantly less impaired by alcohol on the balance task (our gross measure of motor coordination) than FHN women, but the effect was modest.
The results of the present study, combined with the existing literature, indicate that FHP women do not have as pronounced a low response to alcohol as FHP men, suggesting that there may be differences in the heritability of alcoholism between men and women. Unfortunately, the existing literature is complex and inconsistent. While previous studies have shown that the genetic predisposition of alcohol use disorders is increased among both men and women with alcoholic parents (Merikangas, 1990; Kendler et al., 1994, 2003; Prescott et al., 1997), other studies suggest that the risk of developing an alcohol problem is still lower among FHP women (e.g., Cloninger et al., 1981; Heath et al., 1999), with environmental factors playing a greater role than inheritance among FHP women (Heath et al., 1989; Pickens et al., 1991; Sigvardsson et al., 1996). In contrast, others report that FHP women are more likely to experience adverse consequences, including problems with alcohol, as a result of their genetic risk (Akerman and Gondolf, 1991; Curran et al., 1999). More recent studies show that 1) FHP women with premenstrual symptoms drink more during the luteal phase (Sivikis et al., 2006), 2) FHP women who are heavy drinkers report increased negative outcomes of drinking (Pastor and Evans, 2003), and 3) FHP female college students have greater alcohol consumption than FHN female students (LaBrie et al., 2009), highlighting the need for more research assessing the risk factors associated with drinking among women with a family history of alcoholism.
4.4 Strengths and limitations
This study had a number of methodological strengths, particularly confirming the presence or absence of a family history of alcoholism, assessing a range of measures, testing placebo and more than one dose of alcohol, and prospectively tracking and confirming menstrual cycle phase. Despite these strengths, there were several limitations. First, hormone levels to confirm menstrual cycle phase were only obtained for 87% of the women because some women refused to have blood drawn or we had technical difficulties drawing blood samples. Despite keeping accurate prospective records of their menstrual cycles and having women do urinary ovulation kits, hormone levels are still the gold standard for verifying menstrual cycle phase. Second, the two groups were not matched on level and pattern of alcohol consumption, that has been the standard approach in alcohol challenges studies comparing FHN and FHP individuals (e.g., Eng et al., 2005; King et al., 1997; McCaul et al., 1991b). It was our original intention to match FHN and FHP women on drinking behavior, by recruiting only light drinkers, as we have successfully done in previous studies (Evans et al., 2000; Evans and Levin, 2003). However, consistent with recent studies, drinking is increasing among women (Keyes et al., 2008), particularly FHP women (LaBrie et al., 2009). We specifically decided not to include moderate drinkers in the FHN group since we have previously shown that the response to alcohol differs between light and moderate female drinkers without a family history of alcoholism (Evans and Levin, 2004). In addition, many other studies, mostly conducted in men or mixed-gender samples (most with unknown family histories of alcoholism), have reported differences between light and moderate drinkers in response to alcohol and other drugs of abuse (e.g., de Wit and Doty, 1994; Holdstock et al., 2000; Stoops et al., 2003; Zacny et al., 2008). Further, a low response to alcohol is also predictive of future alcohol problems, independent of any family history of alcoholism (Schuckit, 1994). Thus, we felt that the most prudent approach was to have a true control group and only include FHN women who were light drinkers; if we had included moderate drinkers in the FHN group, we may have obscured any potential ability to detect differences between FHN and FHP women since they would have had a low response to alcohol similar to FHP individuals.
Because our FHP group consisted of an equal number of light drinkers and moderate drinkers, we were able to directly determine if these FHP women differed from each other and the FHN group. There were no differences between light and moderate FHP women on depression scores, ratings of Drug Liking and balance scores. Further, after the high dose of alcohol, the FHN group was more impaired on the balance task compared to both light and moderate FHP women. These data are intriguing and suggest that in women, having an alcoholic father may be sufficient to confer greater risk compared to FHN women, but that moderate drinking or the family density of alcoholism and/or substance abuse (which was higher in FHP moderate drinkers) may increase this risk. Clearly these exploratory analyses were conducted with smaller sample sizes in the FHP subgroups (12 light drinkers and 12 moderate drinkers) relative to 21 women in the FHN group and need to be investigated further in larger samples.
This study did not provide the opportunity to determine actual changes in drinking behavior by allowing women to self-administer alcohol doses in the laboratory as was done by Holdstock and de Wit (2000). Further, although women prospectively monitored their drinking behavior each night on the Daily Ratings Form, self-reported drinking at the different phases of the menstrual cycle could not be used since women were explicitly instructed to refrain from alcohol use the day before and the day of each laboratory session. Lastly, given the relatively subtle differences observed between FHP and FHN women in the present study, relevant information on potential sex differences is lacking since groups of FHP and FHN men were not included to allow direct comparisons using the same procedures and dependent measures.
Another potential limitation is that the majority of FHP women had only one alcoholic relative, i.e., the father. These individuals may actually be at relatively low risk for developing alcohol problems compared to individuals with greater family densities of alcoholism, limiting our ability to detect greater differences between FHN and FHP women, as has been shown previously in men (McCaul et al., 1991b). Several studies have shown that the risk for developing alcohol problems increases when there is a greater density of alcoholism among relatives (e.g., Dawson et al., 1992; Capone and Wood, 2008; Magnusson et al., 2010). Importantly, both a low response to alcohol (e.g., decreased body sway) and the number of alcoholic relatives contribute to predicting future alcohol-related problems (Schuckit et al., 2006). Clearly, more carefully controlled studies are needed to address the role of family density of alcoholism and response to alcohol in both men and women. In order to accomplish this accurately and with any reliability, more researchers need to focus on corroborating the family history of alcoholism reported by the participant, rather than simply relying on his/her self-report since the agreement with direct interview is only approximately 73% (Rice et al., 1995).
4.5 Conclusions
In summary, this represents one of the larger studies to date to evaluate both the role of the menstrual cycle and the role of having a paternal history of alcoholism on the behavioral response to alcohol under controlled laboratory conditions. Despite the large sample of women (n = 45), modest differences in the response to alcohol were observed between the midfollicular and late luteal phases of the menstrual cycle. The present study, in conjunction with previous well-controlled studies (Holdstock and de Wit, 2000; Mumenthaler et al., 2001; see review by Terner and de Wit, 2006), suggests that the administration of alcohol may not vary substantially across the menstrual cycle phase among normal women. However, women should be carefully evaluated to rule out severe premenstrual symptoms, particularly PMDD, since these women show substantial changes in mood and impaired performance during the luteal phase (e.g., Reed et al., 2008). In addition, this study represents the second adequately sized study (the first was by Eng et al., 2005) to directly assess the effects of alcohol in FHP and FHN women, and the first to address the impact of menstrual cycle phase on the response to alcohol in FHP women.
In general, the reduced response to alcohol in FHP women was more modest compared to previous studies conducted in FHP men. Further, even though 50% of the FHP group consisted of moderate drinkers and these FHP women had higher densities of family histories of alcoholism and substance abuse, these factors among FHP women did not appear to substantially contribute or enhance the differences observed between FHP and FHN women. Taken together, these findings provide further support that the response to alcohol in FHP women is not identical to previous studies in FHP men and the factors that increase risk for developing alcoholism in women may be more complex.
Acknowledgments
The authors gratefully acknowledge the assistance of the numerous research and clinical staff that made this study possible. Portions of these data were presented at RSA in June 2009.
Role of funding source
This research was supported by NIDA grant 5R01DA009114. The funding source had no other role in study design; in the collection, analysis and interpretation of the data; in the writing of the report; or in the decision to submit the paper for publication.
Footnotes
Conflict of interest
All the authors declare that they have no conflicts of interest to report that could inappropriately influence, or be perceived to influence this work.
Contributors
Dr. Evans and Dr. Levin designed the study and wrote the protocol. Dr. Evans coordinated the study implementation and Dr. Levin provided her medical and clinical expertise and support. Dr. Evans conducted the literature searches, the statistical analyses and wrote the manuscript. All authors have contributed to the study and have read and approved the final manuscript.
Publisher's Disclaimer: This is a PDF file of an unedited manuscript that has been accepted for publication. As a service to our customers we are providing this early version of the manuscript. The manuscript will undergo copyediting, typesetting, and review of the resulting proof before it is published in its final citable form. Please note that during the production process errors may be discovered which could affect the content, and all legal disclaimers that apply to the journal pertain.
References
- Ackerman RJ, Gondolf EW. Adult children of alcoholics: the effects of background and treatment on ACOA symptoms. Int J Addictions. 1991;26:1159–1172. doi: 10.3109/10826089109062152. [DOI] [PubMed] [Google Scholar]
- American Psychiatric Association. Diagnostic and Statistical Manual of Mental Disorders. 4. Washington, DC: US Department of Health and Human Services; 1994. [Google Scholar]
- Anda RF, Whitfield CL, Felitti VJ, Chapman D, Edwards VJ, Dube SR, Williamson DF. Adverse childhood experiences, alcoholic parents, and later risk of alcoholism and depression. Psychiatr Serv. 2002;53:1001–1009. doi: 10.1176/appi.ps.53.8.1001. [DOI] [PubMed] [Google Scholar]
- Beck AT, Steer RA, Ball R, Ranieri WF. Comparison of Beck Depression Inventories -IA and -II in Psychiatric Outpatients. J Pers Assess. 1996;67:588–597. doi: 10.1207/s15327752jpa6703_13. [DOI] [PubMed] [Google Scholar]
- Capone C, Wood MD. Density of familial alcoholism and its effects on alcohol use and problems in college students. Alcohol Clin Exp Res. 2008;32:1451–1458. doi: 10.1111/j.1530-0277.2008.00716.x. [DOI] [PubMed] [Google Scholar]
- Ciraulo DA, Sarid-Segal O, Knapp C, Ciraulo AM, Greenblatt DJ, Shader RI. Liability to alprazolam abuse in daughters of alcoholics. Am J Psychiatry. 1996;153:956–958. doi: 10.1176/ajp.153.7.956. [DOI] [PubMed] [Google Scholar]
- Cloninger CR, Bohman M, Sigvardsson S. Inheritance of alcohol abuse: cross-fostering analysis of adopted men. Arch Gen Psychiatry. 1981;38:861–868. doi: 10.1001/archpsyc.1981.01780330019001. [DOI] [PubMed] [Google Scholar]
- Correa CL, Oga S. Effects of the menstrual cycle of white women on ethanol toxicokinetics. J Stud Alcohol. 2004;65:227–231. doi: 10.15288/jsa.2004.65.227. [DOI] [PubMed] [Google Scholar]
- Curran GM, Stoltenberg SF, Hill EM, Mudd SA, Blow FC, Zucker RA. Gender differences in the relationships among SES, family history of alcohol disorders and alcohol dependence. J Stud Alcohol. 1999;60:825–832. doi: 10.15288/jsa.1999.60.825. [DOI] [PubMed] [Google Scholar]
- Dawson DA, Archer L. Gender differences in alcohol consumption: effects of measurement. Br J Addict. 1992;87:119–123. doi: 10.1111/j.1360-0443.1992.tb01909.x. [DOI] [PubMed] [Google Scholar]
- Dawson DA, Harford TC, Grant BF. Family history as a predictor of alcohol dependence. Alcohol Clin Exp Res. 1992;16:572–575. doi: 10.1111/j.1530-0277.1992.tb01419.x. [DOI] [PubMed] [Google Scholar]
- de Wit H, Doty P. Preference for ethanol and diazepam in light and moderate social drinkers: a within-subjects study. Psychopharmacology. 1994;115:529–538. doi: 10.1007/BF02245577. [DOI] [PubMed] [Google Scholar]
- de Wit H, McCracken SG. Ethanol self-administration in males with and without an alcoholic first-degree relative. Alcohol Clin Exp Res. 1990;14:63–70. doi: 10.1111/j.1530-0277.1990.tb00448.x. [DOI] [PubMed] [Google Scholar]
- Eng MY, Schuckit MA, Smith TL. The level of response to alcohol in daughters of alcoholics and controls. Drug Alcohol Depend. 2005;79:83–93. doi: 10.1016/j.drugalcdep.2005.01.002. [DOI] [PubMed] [Google Scholar]
- Evans SM, Funderburk F, Griffiths RR. Zolpidem and triazolam in humans: behavioral effects and abuse liability. J Pharmacol Exp Ther. 1990;255:1246–1255. [PubMed] [Google Scholar]
- Evans SM, Haney M, Levin FR, Foltin RW, Fischman MW. Mood and performance changes in women with premenstrual dysphoric disorder: acute effects of alprazolam. Neuropsychopharmacology. 1998;19:499–516. doi: 10.1016/S0893-133X(98)00064-5. [DOI] [PubMed] [Google Scholar]
- Evans SM, Levin FR, Fischman MW. Increased sensitivity to alprazolam in females with a paternal history of alcoholism. Psychopharmacology. 2000;150:150–162. doi: 10.1007/s002130000421. [DOI] [PubMed] [Google Scholar]
- Evans SM, Levin FR. The effects of alprazolam and buspirone in light and moderate female social drinkers. Behav Pharmacol. 2002;13:427–439. doi: 10.1097/00008877-200209000-00016. [DOI] [PubMed] [Google Scholar]
- Evans SM, Levin FR. Response to alcohol in females with a paternal history of alcoholism. Psychopharmacology. 2003;169:10–20. doi: 10.1007/s00213-003-1474-2. [DOI] [PubMed] [Google Scholar]
- Evans SM, Levin FR. Differential response to alcohol in light and moderate female social drinkers. Behavioural Pharmacology 2004. 2004;15:167–181. [PubMed] [Google Scholar]
- Freitag WJ, Adesso VJ. Mood effects of alcohol and expectancies across the menstrual cycle. Alcohol. 1993;10:291–298. doi: 10.1016/0741-8329(93)90008-c. [DOI] [PubMed] [Google Scholar]
- First MB, Spitzer RL, Gibbon M, Williams JBW. Structured clinical interview for DSM-IV Axis I disorders- Patient Edition (SCID-I/P, version 2.0) Biometrics Research Department, New York State Psychiatric Institute; 1995. [Google Scholar]
- Gill J. Women, alcohol and the menstrual cycle. Alcohol Alcohol. 1997;32:435–441. doi: 10.1093/oxfordjournals.alcalc.a008278. [DOI] [PubMed] [Google Scholar]
- Gilman SE, Abraham HD. A longitudinal study of the order of onset of alcohol dependence and major depression. Drug Alcohol Depend. 2001;63:277–286. doi: 10.1016/s0376-8716(00)00216-7. [DOI] [PubMed] [Google Scholar]
- Halbreich U, Endicott J, Schacht S. Premenstrual syndromes: a new instrument for their assessment. J Psychiatr Treat Eval. 1982;4:161–164. [Google Scholar]
- Hartka E, Johnstone B, Leino EV, Motoyoshi M, Temple MT, Fillmore KM. A meta-analysis of depressive symptomatology and alcohol consumption over time. Br J Addict. 1991;86:1283–1298. doi: 10.1111/j.1360-0443.1991.tb01704.x. [DOI] [PubMed] [Google Scholar]
- Harvey SM, Beckman LJ. Cyclic fluctuation in alcohol consumption among female social drinkers. Alcohol Clin Exp Res. 1985;9:465–467. doi: 10.1111/j.1530-0277.1985.tb05584.x. [DOI] [PubMed] [Google Scholar]
- Heath AC, Jardine R, Martin NG. Interactive effects of genotype and social environment on alcohol consumption in female twins. J Stud Alcohol. 1989;50:38–48. doi: 10.15288/jsa.1989.50.38. [DOI] [PubMed] [Google Scholar]
- Heath AC, Madden AF, Bucholz KK, Dinwiddie SH, Slutske WS, Bierut LJ, Rohrbaugh JW, Statham DJ, Dunne MP, Whitefield JB, Martin NG. Genetic differences in alcohol sensitivity and the inheritance of alcoholism risk. Psychological Med. 1999;29:1069–1081. doi: 10.1017/s0033291799008909. [DOI] [PubMed] [Google Scholar]
- Helzer JE, Pryzbeck TR. The co-occurrence of alcoholism with other psychiatric disorders in the general population and its impact on treatment. J Stud Alcohol. 1988;49:219–224. doi: 10.15288/jsa.1988.49.219. [DOI] [PubMed] [Google Scholar]
- Hinckers AS, Laucht M, Schmidt MH, Mann KF, Schumann G, Schuckit MA, Heinz A. Low level of response to alcohol as associated with serotonin transporter genotype and high alcohol intake in adolescents. Biol Psychiatry. 2006;60:282–287. doi: 10.1016/j.biopsych.2005.12.009. [DOI] [PubMed] [Google Scholar]
- Holdstock L, de Wit H. Effects of ethanol at four phases of the menstrual cycle. Psychopharmacology. 2000;150:374–382. doi: 10.1007/s002130000461. [DOI] [PubMed] [Google Scholar]
- Holdstock L, King AC, de Wit H. Subjective and objective respones to ethanol in moderate/heavy and light social drinkers. Alcohol Clin Exp Res. 2000;24:789–794. [PubMed] [Google Scholar]
- Kendler KS, Neale MC, Heath AC, Kessler RC, Eaves LJ. A twin-family study of alcoholism in women. Am J Psychiatry. 1994;151:707–715. doi: 10.1176/ajp.151.5.707. [DOI] [PubMed] [Google Scholar]
- Kendler KS, Prescott CA, Myers J, Neal MC. The structure of genetic and environmental risk factors for common psychiatric and substance abuse disorders in men and women. Arch Gen Pyschiatry. 2003;60:929–937. doi: 10.1001/archpsyc.60.9.929. [DOI] [PubMed] [Google Scholar]
- Kessler RC, McGonagle KA, Zhao S, Nelson CB, Hughes M, Eshleman S, Wittchen HU, Kendler KS. Lifetime and 12-month prevalence of DSM-III-R psychiatric disorders in the United States: results from the National Comorbidity Survey. Arch Gen Psychiatry. 1994;51:8–19. doi: 10.1001/archpsyc.1994.03950010008002. [DOI] [PubMed] [Google Scholar]
- Keyes KM, Grant BF, Hasin DS. Evidence for a closing gender gap in alcohol use, abuse, and dependence in the United States population. Drug Alcohol Depend. 2008;93:21–29. doi: 10.1016/j.drugalcdep.2007.08.017. [DOI] [PMC free article] [PubMed] [Google Scholar]
- King AC, Volpicelli JR, Frazer A, O’Brien CP. Effect of naltrexone on subjective alcohol response in subjects at high and low risk for future alcohol dependence. Psychopharmacology. 1997;129:15–22. doi: 10.1007/s002130050156. [DOI] [PubMed] [Google Scholar]
- LaBrie JW, Kenney SR, Lac A, Migliuri SF. Differential drinking patterns of family history positive and family history negative first semester college females. Addict Behav. 2009;34:190–196. doi: 10.1016/j.addbeh.2008.10.012. [DOI] [PMC free article] [PubMed] [Google Scholar]
- Lammers SM, Mainzer DE, Breteler MH. Do alcohol pharmacokinetics in women vary due to the menstrual cycle? Addiction. 1995;90:23–90. doi: 10.1046/j.1360-0443.1995.901235.x. [DOI] [PubMed] [Google Scholar]
- Lex BW, Lukas SE, Greenwald NE, Mendelson JH. Alcohol-induced changes in body sway in women at risk for alcoholism: a pilot study. J Stud Alcohol. 1988;49:346–356. doi: 10.15288/jsa.1988.49.346. [DOI] [PubMed] [Google Scholar]
- Lex BW, Rhoades EM, Teoh SK, Mendelson JH, Greenwald NE. Divided attention task performance and subjective effects following alcohol and placebo: differences between women with and without a family history of alcoholism. Drug Alcohol Depend. 1994;35:95–105. doi: 10.1016/0376-8716(94)90116-3. [DOI] [PubMed] [Google Scholar]
- Lipscomb TR, Nathan PE. Blood alcohol discrimination: the effects of family history of alcoholism, drinking patterns, and tolerance. Arch Gen Psychiatry. 1980;37:571–576. doi: 10.1001/archpsyc.1980.01780180085010. [DOI] [PubMed] [Google Scholar]
- Magnusson A, Goransson M, Heilig M. Early onset alcohol dependence with high density of family history is not “male limited. Alcohol. 2010;44:131–139. doi: 10.1016/j.alcohol.2010.01.001. [DOI] [PubMed] [Google Scholar]
- Martini MC, Lampe JW, Slavin JL, Kurzer MS. Effect of the menstrual cycle on energy and nutrient intake. Am J Clin Nutr. 1994;60:895–899. doi: 10.1093/ajcn/60.6.895. [DOI] [PubMed] [Google Scholar]
- McCaul ME, Turkkan JS, Svikis DS, Bigelow GE. Alcohol and secobarbital effects as a function of familial alcoholism: acute psychophysiological effects. Alcohol Clin Exp Res. 1990;14:704–712. doi: 10.1111/j.1530-0277.1990.tb01230.x. [DOI] [PubMed] [Google Scholar]
- McCaul ME, Turkkan JS, Svikis DS, Bigelow GE. Alcohol and secobarbital effects as a function of familial alcoholism: extended intoxication and increased withdrawal effects. Alcohol Clin Exp Res. 1991a;15:94–101. doi: 10.1111/j.1530-0277.1991.tb00524.x. [DOI] [PubMed] [Google Scholar]
- McCaul ME, Turkkan JS, Svikis DS, Bigelow GE. Familial density of alcoholism: effects on psychophysiological responses to ethanol. Alcohol. 1991b;8:219–222. doi: 10.1016/0741-8329(91)90870-3. [DOI] [PubMed] [Google Scholar]
- McLeod D, Griffiths RR, Bigelow GE, Yingling J. An automated version of the digit symbol substitution test (DSST) Behav Res Methods Instrum. 1982;14:463–466. [Google Scholar]
- McLeod DR, Foster GV, Hoehn-Saric R, Svikis DS, Hipsley PA. Family history of alcoholism in women with both generalized anxiety disorder and premenstrual syndrome: patient reports of premenstrual alcohol consumption and premenstrual symptoms of anxiety. Alcohol Clin Exp Res. 1994;18:664–670. doi: 10.1111/j.1530-0277.1994.tb00928.x. [DOI] [PubMed] [Google Scholar]
- McNair D, Lorr M, Droppleman LF. Profile of Mood States (manual) San Diego: Educational and Industrial Testing Services; 1971. [Google Scholar]
- Mello NK, Mendelson JH, Lex BW. Alcohol use and premenstrual symptoms in social drinkers. Psychopharmacology. 1990;101:448–455. doi: 10.1007/BF02244221. [DOI] [PubMed] [Google Scholar]
- Mercer PW, Khavari KA. Are women drinking more like men? An empirical examination of the convergence hypothesis. Alcohol Clin Exp Res. 1990;14:461–466. doi: 10.1111/j.1530-0277.1990.tb00504.x. [DOI] [PubMed] [Google Scholar]
- Merikangas KR. The genetic epidemiology of alcoholism. Psychol Med. 1990;20:11–22. doi: 10.1017/s0033291700013192. [DOI] [PubMed] [Google Scholar]
- Miller TP, Taylor JL, Tinklenberg JR. A comparison of assessment techniques measuring the effects of methylphenidate, secobarbital, diazepam and diphenhydramine in abstinent alcoholics. Neuropsychobiology. 1988;19:90–96. doi: 10.1159/000118441. [DOI] [PubMed] [Google Scholar]
- Moss HB, Yao JK, Maddock JM. Responses by sons of alcoholic fathers to alcoholic and placebo drinks: perceived mood, intoxication, and plasma prolactin. Alcohol Clin Exp Res. 1989;13:252–257. doi: 10.1111/j.1530-0277.1989.tb00322.x. [DOI] [PubMed] [Google Scholar]
- Mumenthaler MS, O’Hara R, Taylor JL, Friedman L, Yesavag JA. Influence of the menstrual cycle on flight simulator performance after alcohol ingestion. J Stud Alcohol. 2001;62:422–433. doi: 10.15288/jsa.2001.62.422. [DOI] [PubMed] [Google Scholar]
- Newlin DB, Thompson JB. Chronic tolerance and sensitization to alcohol in sons of alcoholics. Alcohol Clin Exp Res. 1991;15:399–405. doi: 10.1111/j.1530-0277.1991.tb00537.x. [DOI] [PubMed] [Google Scholar]
- Newlin DB, Thompson JB. Chronic tolerance and sensitization to alcohol in sons of alcoholics: II. Replication and reanalysis. Exp Clin Psychopharmacology. 1999;7:234–243. doi: 10.1037//1064-1297.7.3.234. [DOI] [PubMed] [Google Scholar]
- Nyberg S, Wahlstrom G, Backstrom G, Sundstrom-Poromaa I. Altered sensitivity to alcohol in the late luteal phase among patients with premenstrual dysphoric disorder. Psychoneuroendocrinology. 2004;29:767–777. doi: 10.1016/S0306-4530(03)00121-5. [DOI] [PubMed] [Google Scholar]
- O’Malley SS, Maisto SA. Effects of family drinking history and expectancies on responses to alcohol in men. J Stud Alcohol. 1985;46:289–297. doi: 10.15288/jsa.1985.46.289. [DOI] [PubMed] [Google Scholar]
- Pastor AD, Evans SM. Alcohol expectancies and risk for alcohol use problems in women with and without a family history of alcoholism. Drug Alcohol Depend. 2003;70:201–214. doi: 10.1016/s0376-8716(03)00007-3. [DOI] [PubMed] [Google Scholar]
- Piazza NJ, Vrbka JL, Yeager RD. Telescoping of alcoholism in women alcoholics. Int J Addict. 1989;24:19–28. doi: 10.3109/10826088909047272. [DOI] [PubMed] [Google Scholar]
- Pickens RW, Svikis DS, McGue M, Lykken DT, Heston LL, Clayton PJ. Heterogeneity in the inheritance of alcoholism: a study of male and female twins. Arch Gen Psychiatry. 1991;48:19–28. doi: 10.1001/archpsyc.1991.01810250021002. [DOI] [PubMed] [Google Scholar]
- Podolsky E. Women alcoholics and premenstrual tension. J Am Med Women Assoc. 1963;18:816–818. [PubMed] [Google Scholar]
- Pollock VE. Meta-analysis of subjective sensitivity to alcohol in sons of alcoholics. Am J Psychiatry. 1992;149:1534–1538. doi: 10.1176/ajp.149.11.1534. [DOI] [PubMed] [Google Scholar]
- Pollock VE, Teasdale TW, Gabrielli WF, Knop J. Subjective and objective measures of response to alcohol among young men at risk for alcoholism. J Stud Alcohol. 1986;47:297–304. doi: 10.15288/jsa.1986.47.297. [DOI] [PubMed] [Google Scholar]
- Prescott CA, Neale MC, Corey LA, Kendler KS. Predictors of problem drinking and alcohol dependence in a population-based sample of female twins. J Stud Alcohol. 1997;58:167–181. doi: 10.15288/jsa.1997.58.167. [DOI] [PubMed] [Google Scholar]
- Reed SC, Levin FR, Evans SM. Changes in mood, cognitive performance and appetite in the late luteal and follicular phases of the menstrual cycle in women with and without premenstrual dysphoric disorder. Horm Behav. 2008;54:185–193. doi: 10.1016/j.yhbeh.2008.02.018. [DOI] [PMC free article] [PubMed] [Google Scholar]
- Rice JP, Reich T, Bucholz AK, Neuman RJ, Fishman R, Rochberg N, Hesselbrock VM, Nurnberger JI, Schuckit MA, Begleiter H. Comparison of direct interview and family history diagnoses of alcohol dependence. Alcohol Clin Exp Res. 1995;19:1018–1023. doi: 10.1111/j.1530-0277.1995.tb00983.x. [DOI] [PubMed] [Google Scholar]
- Roache JD, Griffiths RR. Lorazepam and meprobamate dose effects in humans: Behavioral effects and abuse liability. J Pharmacol Exp Ther. 1987;243:978–988. [PubMed] [Google Scholar]
- Ross HE. Alcohol and drug abuse in treated alcoholics: a comparison of men and women. Alcohol Clin Exp Res. 1989;139:810–816. doi: 10.1111/j.1530-0277.1989.tb00428.x. [DOI] [PubMed] [Google Scholar]
- Savoie TM, Emory EK, Moody-Thomas S. Acute alcohol intoxication in socially drinking female and male offspring of alcoholic fathers. J Stud Alcohol. 1988;49:430–435. doi: 10.15288/jsa.1988.49.430. [DOI] [PubMed] [Google Scholar]
- Schuckit MA. Subjective responses to alcohol in sons of alcoholics and control subjects. Arch Gen Psychiatry. 1984;41:879–884. doi: 10.1001/archpsyc.1984.01790200061008. [DOI] [PubMed] [Google Scholar]
- Schuckit MA. Ethanol-induced changes in body sway in men at high alcoholism risk. Arch Gen Psychiatry. 1985;42:375–379. doi: 10.1001/archpsyc.1985.01790270065007. [DOI] [PubMed] [Google Scholar]
- Schuckit MA. Low level of response to alcohol as a predictor of future alcoholism. Am J Psychiatry. 1994;151:184–189. doi: 10.1176/ajp.151.2.184. [DOI] [PubMed] [Google Scholar]
- Schuckit MA, Smith TL, Kalmijn J, Tsuang J, Hesselbrock V, Bucholz K. Response to alcohol in daughters of alcoholics: a pilot study and a comparison with sons of alcoholics. Alcohol Alcohol. 2000;35:242–248. doi: 10.1093/alcalc/35.3.242. [DOI] [PubMed] [Google Scholar]
- Schuckit MA, Smith TL, Pierson J, Danko GP, Beltran IA. Relationships among the level of response to alcohol and the number of alcoholic relatives in predicting alcohol-related outcomes. Alcohol Clin Exp Res. 2006;30:1308–1314. doi: 10.1111/j.1530-0277.2006.00158.x. [DOI] [PubMed] [Google Scholar]
- Sigvardsson S, Bohman M, Cloninger CR. Replication of the Stockholm adoption study of alcoholism: confirmatory cross-fostering analysis. Arch Gen Psychiatry. 1996;53:681–687. doi: 10.1001/archpsyc.1996.01830080033007. [DOI] [PubMed] [Google Scholar]
- Spielberger CD, Gorsuch RL, Lushene RE. STAI Manual for the State-Trait Anxiety Inventory (“Self-Evaluation Questionnaire”) Consulting Psychologists Press, Inc; Palo Alto, CA: 1970. [Google Scholar]
- Stoops WW, Fillmore MT, Poonacha MS, Kingery JE, Rush CR. Alcohol choice and amphetamine effects in light and moderate drinkers. Alcohol Clin Exp Res. 2003;27:804–811. doi: 10.1097/01.ALC.0000067977.23096.6A. [DOI] [PubMed] [Google Scholar]
- Svikis DS, Miles DR, Haug NA, Perry B, Hoen-Saric R, McLeod D. Premenstrual symptomatology, alcohol consumption, and family history of alcoholism in women with premenstrual syndrome. J Stud Alcohol. 2006;67:833–836. doi: 10.15288/jsa.2006.67.833. [DOI] [PubMed] [Google Scholar]
- Terner JM, de Wit H. Menstrual cycle phase and responses to drugs of abuse in humans. Drug Alcohol Depend. 2006;84:1–13. doi: 10.1016/j.drugalcdep.2005.12.007. [DOI] [PubMed] [Google Scholar]
- Warner LA, White HR, Johnson V. Alcohol initiation experiences and family history of alcoholism as predictors of problem-drinking trajectories. J Stud Alcohol Drugs. 2007;68:56–65. doi: 10.15288/jsad.2007.68.56. [DOI] [PubMed] [Google Scholar]
- Watson PE, Watson ID, Batt RD. Total body water volumes for adult males and females estimated from simple anthropometric measurements. Am J Clin Nutr. 1980;33:27–39. doi: 10.1093/ajcn/33.1.27. [DOI] [PubMed] [Google Scholar]
- Wilsnack SC, Wilsnack RW, Hiller-Sturmhofel S. How women drink: epidemiology of women’s drinking and problem drinking. Alcohol Health Res World. 1994;18:173–181. [PMC free article] [PubMed] [Google Scholar]
- Zacny JP, Walker DJ, Derus LM. Choice of nitrous oxide and its subjective effects in light and moderate drinkers. Drug Alcohol Depend. 2008;98:163–168. doi: 10.1016/j.drugalcdep.2008.06.001. [DOI] [PMC free article] [PubMed] [Google Scholar]