

Abstract
The aim of this study was to estimate the age-specific incidence of cognitive impairment, no dementia and mild cognitive impairment (CIND/MCI) in a large, community-based sample of older African Americans in Indianapolis, IN. A longitudinal, prospective, two-stage design was used with follow-up assessments 2 and 5 years after the baseline. A total of 1668 participants completed the 2-year follow-up and a total of 1255 participants completed the 5-year follow-up. The person–years method was used to calculate incidence rates. The age-standardized, annual incidence of CIND/MCI was 4.95% (CI = 3.39–6.52) and the subtype of medically unexplained memory loss (single- and multi-domain amnestic MCI) was 3.67% (CI 2.75–4.48). Rates increased with age (3.43% for subjects aged 65–74 years, 6.44% from age 75–84 years, and 9.62% from age 85+ years), history of head injury (OR 2.37 [CI 1.31–4.29]), and history of depression (OR 2.22 [CI 1.16–4.25]) while increased years of schooling was protective (OR 0.91 [CI 0.85–0.97]). Rates did not vary substantially by gender. Almost 1 in 20 elderly community-dwelling African-Americans, and almost 1 in 10 of the oldest-old (85+ years) developed CIND/MCI each year in this cohort. Risk factors of age and education suggest exposures or mechanisms at both ends of the life span may be important variables in onset of CIND/MCI.
INTRODUCTION
A variety of approaches to classifying the intermediate stage between normal cognitive aging and dementia have been proposed. Cognitive impairment, no dementia (CIND)1, 2 and mild cognitive impairment (MCI)3, 4 are very similar concepts that describe syndromes seen in older adults encompassing a broad array of cognitive symptoms that are presumed to have multi-factorial causation. Particular interest in CIND and MCI stems from the fact that, in some persons, this condition represents an early or prodromal phase of dementia and as such may offer a window for early interventions to forestall or prevent dementia.
Large, community-based studies suggest that the prevalence of CIND and MCI may range from 3–27%.1, 2, 5–17 Studies with lower rates tended to have a narrow case definition (e.g., single domain MCI), younger cohorts, or two-stage designs that did not sample for false negatives. Persons with CIND/MCI develop dementia,2 enter nursing homes,18 and die12, 18–20 at higher rates than cognitively normal elders.
We previously reported the prevalence of CIND/MCI and amnestic MCI in a very large, community-based sample of older African Americans2 and now estimate the incidence of CIND and MCI and the impact of demographic and health variables as risk factors in a 5 year follow-up of cognitively healthy persons in this cohort.
METHOD
Sampling Frame
This project was approved by the Indiana University Purdue University Indianapolis institutional review board. Participants came from the Indianapolis site of the Indianapolis-Ibadan Dementia Project, a longitudinal study of aging and dementia (see Figure 1 and 21, 22 for details). In brief, the geographic target area consisted of 29 contiguous census tracts in Indianapolis, Indiana in which African Americans represented 80% of the population in the 1990 US census. This region is representative, in terms of age, sex, and socioeconomic status, of all African Americans in the state of Indiana. A 60% random sample of residential addresses in these tracts was conducted with eligibility as follows: 1) residence at sampled address, 2) self-reported African American ethnicity, and 3) age 65 years and older.
Figure 1.
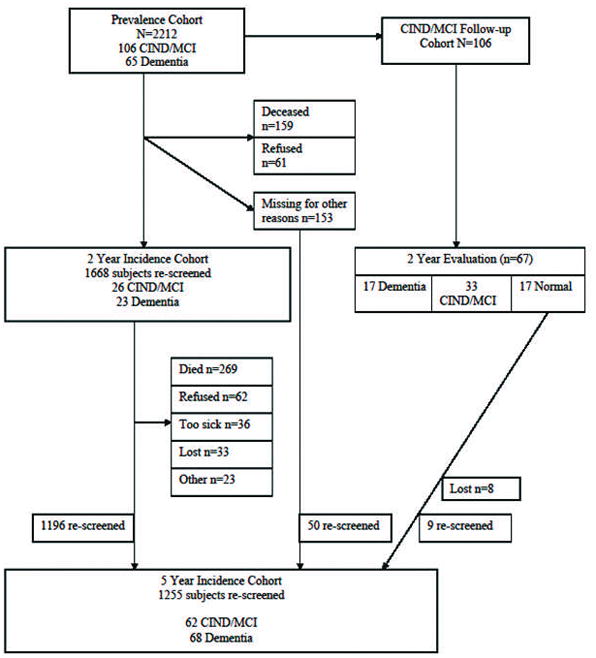
Study Design and Participant Flow (* denotes total number of subjects who provided follow-up information).
Screening and Clinical Assessment
The design is two-stage with initial screening of all participants and detailed clinical assessment of a subset. In the prevalence survey, 2582 eligible persons were identified and 2212 agreed to participate (85% response rate). All subjects were screened in their homes with the Community Screening Interview for Dementia (CSI-D23, 24) at each assessment. The CSI-D consists of a cognitive assessment of the study participant and an interview with an informant evaluating the daily functioning of the participant. CSI-D items were drawn from the Cambridge Mental Disorders of the Elderly Examination,25 the Mini-Mental State Examination,26 the dementia scale of Blessed et al.,27 the Comprehensive Assessment and Referral Evaluation,28 and the East Boston Memory Test 29 and assess the dimensions covered in the DSM-III-R and ICD-10 criteria for dementia. A discriminant function score was derived from the combination of cognitive and informant scores that best discriminated between demented and nondemented subjects in pilot studies.23 On the basis of the discriminant function scores (cognitive scores when informant scores were not available), scores were classified as indicating good performance (discriminant function scores <0.120, cognitive scores >29.5), intermediate performance (discriminant function scores >=0.120 and <0.184, cognitive scores >28.5 and 29.5), and poor performance (discriminant function scores >=0.184, cognitive scores <=28.5). Selection for clinical assessment was based on the CSI-D performance group. 100% of the poor performance group was selected for clinical assessment while participants were randomly sampled from the intermediate group until 50% had clinical assessments and from the good group (weighted for 75% aged 75 years or older) until 5% had clinical assessments. At baseline, the percentage of participants in each of performance group was as follows: good performance = 80.6%, intermediate performance = 7.6%, and poor performance = 11.8%. Weighted logistic regression was used to account for different probabilities of selection into the sample for clinical assessment.30 The modeling procedure provides variance estimates for age-specific rates and was used by our group to document incidence of dementia and Alzheimer disease in this same sample.22
The clinical assessment consisted of an examination by a clinician (physician or nurse), structured informant interview, and cognitive testing). The clinician examination included physical, neurological, and mental status examinations. The informant interview is a structured interview adapted from the CAMDEX,31 conducted by a research nurse, with a family member who knows the subject well to probe for cognitive symptoms and current performance in daily functioning. Participants were assessed with the Consortium to Establish a Registry for Alzheimer Disease (CERAD) neuropsychological battery32 which included: Mini-Mental State Examination, Animal Fluency, 15-item Boston Naming Test, Constructional Praxis and Recall, and Word List Learning and Delayed Recall. A separate sub-study was conducted to generate age- and education-adjusted normative tables33 for use in the consensus diagnosis panel. The subjects recruited into the normative study were representative of the larger target population in terms of race, gender, and education.
Diagnosis
All clinically assessed participants were diagnosed as Normal, Cognitive Impairment No Dementia (CIND), or Dementia using a consensus diagnosis panel approach. All data from the clinical assessment were available to the diagnostic adjudicators (which included geriatric psychiatrists, neurologists, and neuropsychologist) on the consensus panel. The panel was aware of the possibility of spurious and contradictory information within and across elements of the clinical assessment. Diagnostic criteria (described below) were interpreted in light of the totality of the clinical context and with appreciation for variability in the reliability and validity of information. Local norms were used to guide interpretation of the cognitive test battery. 33 Diagnosis of dementia was made according to DSM-III-R criteria.34
Criteria for CIND/MCI were as follows: informant-reported decline in cognition, clinician-detected impairment in cognition on physical and neurological exam, or cognitive test scores 1.5SD below the mean of the normative reference sample and; and normal instrumental and basic activities of daily living (based on informant interview).2 The cognitive decline needed to be clinically significant and could occur in any cognitive domain. Within the major CIND/MCI category, subtyping occurred at the level of presumed etiology. Subjects with prominent memory impairment that was not otherwise medically explained constituted one subgroup felt to be likely to have prodromal Alzheimer disease. These subjects could also have had mild impairments in non-memory cognitive domains. This group includes subjects with single- and multi-domain amnestic MCI. Other CIND/MCI subtypes included: stroke/cerebrovascular disease (CVD), alcohol/substance use, medical illness, and other/indeterminate.
Longitudinal Follow-up
An attempt was made to re-screen all nondemented subjects from the initial prevalence wave and at 2- and 5-year follow-up assessments. The two-stage design was implemented at each follow-up wave with consensus diagnosis of all available clinical assessment data.
Statistical Analysis
The person-years method of incidence estimation35 was extended to take into account sampling for clinical assessment used at each study wave. Person-years at risk for each study participant were calculated as the length of follow-up time between the first and last evaluation for participants who did not have a CIND/MCI or Dementia diagnosis during follow-up and as the midpoint between the time of CIND/MCI or Dementia diagnosis and a previous Normal diagnosis. Predicted probability of incident CIND/MCI was derived using a weighted logistic regression model accounting for sampling schemes for the 2- and 5-year evaluation separately.30 Age at evaluation, sex and current CSI-D performance group standing were included as covariates in the weighted logistic regression models. The number of CIND/MCI cases at each follow-up wave was estimated by summing predicted probability of being CIND/MCI at each specific wave adjusted by the predicted probability of being CIND/MCI or demented at a previous wave over all participants. We have used a similar approach to estimate incidence of dementia and Alzheimer disease in this cohort.22
The incidence rates for a specific age group were calculated as the total estimated number with incident CIND/MCI divided by the total person-year at risk for that age group. Because the rates were derived using a complex modeling approach, we used a nonparametric approach, the jackknife variance estimator, to estimate the standard error of incidence rates. Age-standardized overall incidence was obtained by applying the estimated age-specific rates to the age distribution of African Americans residents in Indianapolis observed in the 1990 census: 60% aged 65–74 years, 30% aged 75 to 84 years, and 10% aged 85 years or older. The variance of the overall rate was calculated as a weighted mean of the variances of the age-specific rates. Ninety-five percent confidence intervals for the incidence rates were constructed based on asymptotic normality of the estimates.
To identify any factors associated with attrition, subjects were divided into four mutually exclusive groups: 1) subjects who completed follow-up and contributed to the estimation of incidence by being either an incident CIND/MCI case or having at least one follow-up; 2) subjects with prevalent Dementia (n = 65) or prevalent CIND/MCI who did not convert back to normal at the 2 year follow-up wave (n = 89 of 105); 3) subjects who died before follow-up; and 4) subjects who were lost to follow-up after the prevalence wave. Subjects in the latter three groups were excluded from incidence estimation. Baseline characteristics were compared with one-way analysis of variance models for continuous variables and χ2 test for categorical variables with Scheffe’s test comparing subjects who completed follow-up to the other three groups in a post-hoc analysis.
Odds ratio estimates for incident CIND/MCI were derived as follows. Subjects who were either Demented or CIND/MCI at prevalence and did not convert back to Normal were excluded from the analysis. The remaining subjects were divided into two groups: incident CIND/MCI and cognitively Normal. The comparison group comprised subjects who were clinically assessed as Normal and those who were in the good performance group on their most recent incidence wave screening.
Potential risk factors including baseline characteristics and age at diagnosis were analyzed univariately for the association with incident CIND/MCI using Fisher’s exact tests for categorical variables and t-tests for continuous data. Variables with a p-value ≤ 0.10 were included in stepwise logistic regression models for incident CIND/MCI keeping only variables with a p-value ≤ 0.05. Odds ratios, 95% confidence intervals, and p-values were obtained from the final models. Unweighted logistic models were used in this analysis as the odds ratio estimates for the risk factors remains unbiased under the two-phase sampling plan. 36, 37
RESULTS
The number of subjects at each study wave including number lost to follow-up and the reasons for attrition are shown in Figure 1. Out of the 2212 participants enrolled at the prevalence, 154 (7.0%) were excluded from the incidence rate calculation due to baseline dementia (n=65) or baseline CIND/MCI that did not convert back to normal (n=89), 159 (7.0%) participants died before the two-year follow-up evaluation, and 172 (7.8%) were lost to follow-up (61 refused the two year evaluation, 153 subjects were lost to follow-up at the two year evaluation and 103 of them were also lost at the five year evaluation. Eight of the 17 baseline CIND/MCI subjects who converted to normal at two years were also lost to follow-up). A total of 1668 participants completed the 2-year follow-up and a total of 1255 participants completed the 5-year follow-up. A total of 1727 participants (those completed the two year evaluation (1668) and 59 subjects rescreened at the 5-year evaluation) were included in the analysis.
Table 1 shows the baseline characteristics of the four groups of study participants and thus provides information on factors associated with attrition. Subjects who Completed Follow-up tended to be younger, have more years of education, have better CSI-D Informant Scores (ratings of daily function), have better CSI-D Cognitive Scores, have higher rate of self-reported hypertension and have lower rates of self-reported stroke than the group with Prevalent Dementia or CIND/MCI. The subjects who Completed Follow-up also had better CSI-D Informant Scores (ratings of daily function), have better CSI-D Cognitive Scores, lower rates of heart attack and stroke than the group that Died before Follow-up. The group that Completed Follow-up had higher proportions of female subjects and better CSI-D Cognitive Scores than the group that was Lost to Follow-up.
Table 1.
Baseline characteristics of the four groups of study participants.
| Baseline variables | Completed Follow-up (n=1727) | Prevalent Dementia & CIND/MCI* (n=154) | Died before Follow-up (n=159) | Lost to Follow-up (n=172) | p-value |
|---|---|---|---|---|---|
| Age (SD) | 73.5 (6.7) | 79.4 (7.4) | 74.8 (6.9) | 73.8 (7.1) | 0.0001a |
| Female, % | 66.7 | 61.0 | 59.1 | 57.0 | 0.0155c |
| Years of education (SD) | 9.8 (3.0) | 7.6 (3.6) | 9.2 (3.3) | 9.7 (3.0) | 0.0001a |
| Cognitive score (SD) | 31.0 (1.9) | 25.0 (4.8) | 30.1 (2.6) | 30.3 (2.7) | 0.0001a,b,c |
| Informant score (SD) | 2.3 (2.5) | 9.0 (5.3) | 3.6 (4.1) | 2.7 (3.3) | 0.0001a, b |
| Age group (%) | 0.0001a, b | ||||
| 65–74 | 62.4 | 27.9 | 52.2 | 60.5 | |
| 75–84 | 29.8 | 47.4 | 50.3 | 30.2 | |
| 85+ | 7.8 | 24.7 | 7.6 | 9.3 | |
| Diabetes, % | 24.0 | 20.1 | 32.3 | 23.3 | 0.0705 |
| Hypertension, % | 62.0 | 51.3 | 59.1 | 58.1 | 0.0001a |
| Heart Attack, % | 23.4 | 21.5 | 33.5 | 20.9 | 0.0217b |
| Stroke, % | 9.6 | 18.2 | 17.0 | 11.6 | 0.0001a, b |
Note: Subjects in the “Completed Follow-up” group contributed to the estimation of incidence by being either an incident CIND/MCI case or had at least one follow-up (screening or clinical assessment). The subjects in the “Prevalent Dementia & CIND/MCI” group consist of 65 baseline demented subjects and 89 of the 106 baseline CIND/MCI who did not convert back to normal at the 2-year follow-up. The subjects in the “Lost to Follow-up” group were all those who were not in the other three groups.
significant difference between “Completed Follow-up” and “Prevalent Dementia & CIND/MCI”
significant difference between “Completed Follow-up” and “Died before Follow-up”
significant difference between “Completed Follow-up” and “Lost to Follow-up”
Table 2 shows the clinical diagnoses as a function of CSI-D screening group (good, intermediate, or poor) at the 2-year and 5-year follow-up. A total of 88 participants were diagnosed as having incident CIND/MCI (26 in the first wave and 62 in the second wave). The CSI-D performance groupings were defined to detect dementia and not unexpectedly incident cases of dementia at each wave were predominately from the poor performance group. Participants diagnosed as Normal at the incident waves came from each performance group while the incident CIND/MCI cases tended to come from the poor and intermediate categories.
Table 2.
Clinical diagnosis by CSI-D screening performance groups by study follow-up.
| Demented | CIND/MCI | Normal | Not Clinically Assessed | |
|---|---|---|---|---|
| 2 year evaluation | ||||
| Good | 2 | 3 | 72 | 1318 |
| Intermediate | 3 | 15 | 63 | 79 |
| Poor | 18 | 8 | 39 | 48 |
| Total | 23 | 26 | 174 | 1445 |
| 5 year evaluation | ||||
| Good | 3 | 8 | 38 | 885 |
| Intermediate | 6 | 19 | 39 | 65 |
| Poor | 59 | 35 | 41 | 57 |
| Total | 68 | 62 | 118 | 1007 |
Note: CSI-D = Community Screening Interview for Dementia; CIND = Cognitive Impairment, No Dementia; MCI = Mild Cognitive Impairment.
The age-specific and age-standardized annual incidence rates of CIND/MCI are presented in Table 3. The overall age-standardized annual incidence of CIND/MCI was 4.95% (95% confidence interval [CI] 3.39–6.52). The incidence rate increased with increasing age, from 3.43% (CI 1.17–5.69) in the young-old (age 65–74 years), to 6.44% (CI 4.18–8.69) in the old-old (75–84 years), and to 9.62% (CI 5.62–13.62) in the oldest-old (85+ years). The age-standardized rate of CIND/MCI as a function of gender indicate the rate for women (4.73 [CI 2.03–7.43]) is slightly but not significantly higher than the rate for men (4.35 [CI 1.98–6.72]). The CIND/MCI subtype of medically unexplained memory loss (combined single- and multi-domain amnestic MCI) was the most common subtype accounting for 53 or 60% of all incident cases and an standardized annual incidence of 3.67% (CI 2.75–4.48). The remainder of the incident cases was composed of subjects with CIND/MCI due to medical illness 11 cases, stroke/cerebrovascular disease 9 cases, alcohol/substance use 6 cases, and other/unknown causes 9 cases.
Table 3.
Age-specific annual incident rates of CIND/MCI.
| Age group | Person-years | Estimated Incidence cases | Rate (%) | 95% CI |
|---|---|---|---|---|
| 65–74 | 2937.2 | 101 | 3.43 | (1.17, 5.69) |
| 75–84 | 1777.8 | 114 | 6.44 | (4.18, 8.69) |
| 85+ | 422.2 | 41 | 9.62 | (5.62, 13.62) |
| Age-standardized overall rate | 4.95 | (3.39, 6.52) |
Note: CIND = Cognitive Impairment, No Dementia; MCI = Mild Cognitive Impairment. CI = confidence interval.
Figure 2 shows a comparison of the age-standardized incidence rates for CIND/MCI and dementia in this cohort. CIND/MCI does have a slightly higher overall annual incidence rate than dementia (4.95% vs. 3.24%). The increase in rates is greater in the younger age groups after which they appear to converge.
Figure 2.

Comparison of age-specific and age-standardized incidence rates of CIND/MCI and dementia in this cohort.
T-tests and Fisher’s exact tests were used to identify risk factors for incident CIND/MCI compared to the combined group of non-cases (those diagnosed as Normal and the good performance group who was not clinically assessed) using demographic and health history factors. The health history was drawn from self- and informant-report at the baseline CSI-D and included: age at diagnosis, gender, education, occupation, rural residence to age 19 years, alcohol use, smoking, body mass index, and history of diabetes, hypertension, heart attack, stroke, head injury, cancer, Parkinson disease, and depression. Significant univariate effects were noted for age, years of education, rural residence to age 19 years, white collar occupation, history of head injury, and history of depression. These variables were entered into a stepwise logistic regression model and the final results revealed that older age at diagnosis, history of head injury, and history of depression were risk factors for incident CIND/MCI while more years of education was protective (see Table 4).
Table 4.
Final results from stepwise logistic regression (Outcome is CIND/MCI vs. Normal subjects and good performers).
| OR | 95% CI | p-value | |
|---|---|---|---|
| Age at diagnosis | 1.06 | 1.03–1.10 | 0.0002 |
| Grade | 0.91 | 0.85–0.97 | 0.0071 |
| History of head injury (self and informant report) | 2.37 | 1.31–4.29 | 0.0042 |
| History of depression | 2.22 | 1.16–4.25 | 0.0160 |
Note: CIND = Cognitive Impairment, No Dementia; MCI = Mild Cognitive Impairment. CI = confidence interval; OR = odds ratio.
DISCUSSION
In this sample of older African Americans, the incidence of CIND/MCI, a broad syndrome of cognitive impairment short of dementia, was 4.9% per year in subjects aged 65 years and older and 9.6% per year in subjects aged 85 years and older. Almost 1 in 20 of all older adults in this cohort and nearly 1 in 10 of the oldest-old were diagnosed with CIND/MCI each year. The major subtype, medically unexplained memory loss (combined single- and multi-domain amnestic MCI), had an overall age-standardized rate of 3.7% in this cohort. Older subjects and those with fewer years of schooling, history of head injury, and history of depression had significantly greater odds of developing CIND/MCI and the overall incidence is slightly higher than the incidence of dementia at least in the younger age groups in this cohort with rates converging among the oldest-old.22 While our mortality and lost to follow-up rates were quite low, the baseline characteristics of the study participants who were followed up (compared to those who were not) suggest that our observed incidence rates could be low estimates.
Our CIND/MCI incidence rate of 4.9% is consistent with the 5.2% rate reported among older African Americans living in New York City38 and the 4.5% rate reported among Swedish elders in the Kungsholmen project;39 however, the Leipzig Longitudinal Study of the Aged (LEILA)9 among older Germans did report a higher incidence rate of 7.7%. The LEILA study used a broader case definition (less stringent threshold for test impairment, i.e., test scores below −1.0 SD of the mean) and had an older entry age (75 years) which would tend to push rates higher.
Our incidence rates for medically unexplained memory loss (i.e., combined single- and multi-domain amnestic MCI) are a bit higher that those reported from the New York group (3.7% versus 2.3%) and a fair bit higher than the 1.1% rate for amnestic MCI rate in the Kungsholmen project. The sampling frame for Kungsholmen is notable in the removal not only of prevalent dementia cases but also any subjects with memory complaints, 0/3 recall on the MMSE, and those with low MMSE, all of which would have the effect of lowering incidence rates. Three other European studies also reported lower amnestic MCI rates than we observed. A Finnish community-based study reported an incidence rate of 2.5%,40 the Italian Longitudinal Study on Aging (ILSA)41 reported a 2.2% incidence rate, and the Personnes Agées Quid (PAQUID)42 study reported a 0.9% incidence of amnestic MCI. Sample and method differences may explain some of the variation in rates. For instance, the Finnish study had a young age at entry (60 years) and the ILSA used a restrictive definition of amnestic MCI, both of which could contribute to lower rates. The PAQUID study had anomalous findings beyond very low incidence rates (no age effect, reversed education effect, marked diagnostic instability over time) which suggest that the psychometric-algorithm approach to case definition used in that study may have resulted in unusual diagnostic grouping (see Table 5 for a summary of incidence rates by study).
Table 5.
Summary of Incidence Studies of CIND/MCI.
| Author/Project | Sample | CIND/MCI | Amnestic MCI | Risk Factors |
|---|---|---|---|---|
| Busse et al., 9/Leipzig | German; age 75+ at entry; 3 yrs follow-up; 109 incident cases | 7.7% | 1.2% | Age |
| Manly et al., 38/New York City | African American; age 65+ at entry; 7 yrs follow-up; 129 incident cases | 5.2% | 2.3% | Age |
| Unverzagt et al.,/Indianapolis | African American; age 65+ at entry; 256 incident cases; 5 yrs follow-up | 4.9% | 3.7% | Age, education, head injury, depression |
| Caracciolo et al. 39/Kungsholmen | Swedish; age 75+ yrs at entry; 9 yrs follow-up; 194 incident cases | 4.5% | 1.1% | Age |
| Tervo et al., 40/Kuopio | Finnish; age 60–76 yrs at entry; 3 yrs follow-up; 66 incident cases | - | 2.6% | Age, education, HTN, CVD, APOE |
| Solfrizzi et al., 41/Italy | Italian; age 65–84 yrs at entry; 3.5 yrs follow-up; 113 incident cases; algorithm diagnosis | - | 2.1% | Age, education, gender |
| Larrieu et al., 42/France | French; age 65+ yrs at entry; 5 yrs follow-up; 40 incident cases; algorithm diagnosis | - | 0.9% | Education (reversed); gender |
Note: CIND = cognitive impairment, no dementia; MCI = mild cognitive impairment; HTN = hypertension; CVD = cardiovascular disease.
Despite variability in the demographics of the cohorts and the nature of the diagnostic criteria, several large-scale, epidemiological studies are reporting CIND/MCI annual incidence rates in a fairly tight range from 4–8% and amnestic MCI rates from 1–3% per year. The risk factors of incident CIND/MCI tend to be the same as those for dementia and Alzheimer disease (i.e., older age and lower education and, less strongly, female gender) which is not unexpected as CIND/MCI is presumed to include cases with early AD.
Our identification of older age and lower education as a risk factor is consistent with other studies9, 39–41 and suggests that exposures or mechanisms at both ends of the lifespan may be important determinants of CIND/MCI. The age effect is well known in dementia and AD and it is not surprising to see it surface in the context of CIND/MCI. Age-associated neurodegeneration and cerebrovascular mechanisms are the likely drivers of this effect. The risk that lower education confers is likely multi-factorial including racial segregation-based barriers to education, employment, and access to health and social services.43 Educational resources for rural African Americans during this era have been documented to be low44 and our previous work had suggested an interaction of lower education and rural residence in child hood as a risk factor for prevalent Alzheimer disease.43 The risk conferring effects of head injury have been documented in some but not all studies of dementia and Alzheimer disease possibly through a diminishment in cognitive reserve or an interaction with APOE genotype.45, 46 Depression has been cited as a potential prodromal symptom of Alzheimer disease and also as an independent risk factor that may alter neural reserve in some pernicious way.47, 48
Our study does have limitations. The follow-up interval of 2–3 years is long enough that a small number of participants could have developed incident CIND/MCI and died before follow-up. As a result, the rates we report could be slight underestimates compared to studies with a shorter evaluation interval. Also, the CERAD-based neuropsychological battery that we used lacks sensitive measures of attention and executive function and subjects with impairments in these cognitive areas may have been missed. While our unadjusted frequency of incident CIND/MCI due to stroke of 10.2% is slightly above the 9.8% rate found in the predominantly White sample in the Canadian Study of Health and Aging,49 this could represent an underestimate as our methods for detecting cerebrovascular disease were limited to report of clinical stroke and neurological examination for focal and lateralizing signs (no MRI of the head was taken as part of the clinical assessment). Also, our measurements of attention and executive function, which are important to diagnose CIND/MCI caused cerebrovascular disease, were limited. Finally, prevalent CIND/MCI cases were included in the follow-up due to the known fluctuation in outcome in this group. Our analytic approach includes those prevalent CIND/MCI who revert back to normal in a later evaluation as “at-risk” for developing incident CIND/MCI. This is the standard statistical approach for a reversible event or outcome.
Clinically significant cognitive impairment below the threshold for dementia is a major risk factor for development of dementia and constitutes an important target for early intervention and management. The present study provides important information about incidence of CIND/MCI in an urban, community-based sample of elderly African-Americans. Given the ethnic diversity in the United States and elsewhere, it is critical to understand the epidemiology and natural history of this condition in different populations if an appropriate public health policy is to be developed to deal with the impending public health crisis that is posed by cognitive impairment and dementia.
Acknowledgments
Supported by grants from the National Institute on Aging (R01 AG09956; P30 AG10133; R01 AG026096) and Alzheimer Association (IIRG-95-084). We gratefully acknowledge the assistance of Ms. Millicent Pettaway and Mr. William Malone.
Reference List
- 1.Graham JE, Rockwood K, Beattie LB, et al. Prevalence and severity of cognitive impairment with and without dementia in an elderly population. Lancet. 1997;349:1793–1796. doi: 10.1016/S0140-6736(97)01007-6. [DOI] [PubMed] [Google Scholar]
- 2.Unverzagt FW, Gao S, Baiyewu O, et al. Prevalence of cognitive impairment: Data from the Indianapolis Study of Health and Aging. Neurology. 2001;57:1655–1662. doi: 10.1212/wnl.57.9.1655. [DOI] [PubMed] [Google Scholar]
- 3.Winblad B, Palmer K, Kivipelto M, et al. Mild cognitive impairment - beyond controversies, towards a consensus: report of the International Working Group on Mild Cognitive Impairment. Journal of Internal Medicine. 2004;256(3):240–246. doi: 10.1111/j.1365-2796.2004.01380.x. [DOI] [PubMed] [Google Scholar]
- 4.Petersen R. Mild cognitive impairment as a diagnostic entity. Journal of Internal Medicine. 2004;256(3):183–194. doi: 10.1111/j.1365-2796.2004.01388.x. [DOI] [PubMed] [Google Scholar]
- 5.DiCarlo A, Baldereschi M, Amaducci L, et al. Cognitive impairment without dementia in older people: Prevalence, vascular risk factors, impact on disability. The Italian Longitudinal Study on Aging. J Am Geriatr Soc. 2000;48:775–782. doi: 10.1111/j.1532-5415.2000.tb04752.x. [DOI] [PubMed] [Google Scholar]
- 6.Lopez OL, Jagust WJ, DeKosky ST, et al. Prevalence and classification of mild cognitive impairment in the Cardiovascular Health Study Cognition Study: part 1. Arch Neurol. 2003;60(10):1385–1389. doi: 10.1001/archneur.60.10.1385. [DOI] [PubMed] [Google Scholar]
- 7.Prencipe M, Santini M, Casini AR, Pezzella FR, Scaldaferri N, Culasso F. Prevalence of non-dementing cognitive disturbances and their association with vascular risk factors in an elderly population. Journal of Neurology. 2003;250(8):907–912. doi: 10.1007/s00415-003-1094-0. [DOI] [PubMed] [Google Scholar]
- 8.Ritchie K, Artero S, Touchon J. Classification criteria for mild cognitive impairment: a population-based validation study. Neurology. 2001;56(1):37–42. doi: 10.1212/wnl.56.1.37. [DOI] [PubMed] [Google Scholar]
- 9.Busse A, Bischkopf J, Riedel-Heller SG, Angermeyer MC. Mild cognitive impairment: prevalence and incidence according to different diagnostic criteria. Results of the Leipzig Longitudinal Study of the Aged (LEILA75+) Br J Psychiatry. 2003;182:449–454. [PubMed] [Google Scholar]
- 10.Hanninen T, Hallikainen M, Tuomainen S, Vanhanen M, Soininen H. Prevalence of mild cognitive impairment: a population-based study in elderly subjects. Acta Neurologica Scandinavica. 2002;106(3):148–154. doi: 10.1034/j.1600-0404.2002.01225.x. [DOI] [PubMed] [Google Scholar]
- 11.Boeve B, McCormick J, Smith G, et al. Mild cognitive impairment in the oldest old. Neurology. 2003;60(3):477–480. doi: 10.1212/wnl.60.3.477. [DOI] [PubMed] [Google Scholar]
- 12.Bennett DA, Wilson RS, Schneider JA, et al. Natural history of mild cognitive impairment in older persons. Neurology. 2002;59(2):198–205. doi: 10.1212/wnl.59.2.198. [DOI] [PubMed] [Google Scholar]
- 13.Ikeda M, Shigenobu K. The prevalence of mild cognitive impairment (MCI) among the community-dwelling elderly: findings from the 2nd Nakayama study. Seishin Shinkeigaku Zasshi - Psychiatria et Neurologia Japonica. 2003;105(4):381–386. [PubMed] [Google Scholar]
- 14.Pfeffer RI, Afifi AA, Chance JM. Prevalence of Alzheimer’s disease in a retirement community. American Journal of Epidemiology. 1987;125:420–436. doi: 10.1093/oxfordjournals.aje.a114548. [DOI] [PubMed] [Google Scholar]
- 15.Ganguli M, Dodge HH, Shen C, DeKosky ST. Mild cognitive impairment, amnestic type: an epidemiologic study. Neurology. 2004;63(1):115–121. doi: 10.1212/01.wnl.0000132523.27540.81. [DOI] [PubMed] [Google Scholar]
- 16.Das SK, Bose P, Biswas A, et al. An epidemiologic study of mild cognitive impairment in Kolkata, India. Neurology. 2007;68(23):2019–2026. doi: 10.1212/01.wnl.0000264424.76759.e6. [DOI] [PubMed] [Google Scholar]
- 17.Purser JL, Fillenbaum GG, Pieper CF, Wallace RB. Mild cognitive impairment and 10-year trajectories of disability in the Iowa established populations for epidemiologic studies of the elderly cohort. J Am Geriatr Soc. 2005;53(11):1966–1972. doi: 10.1111/j.1532-5415.2005.53566.x. [DOI] [PubMed] [Google Scholar]
- 18.Tuokko H, Frerichs R, Graham J, et al. Five-year follow-up of cognitive impairment with no dementia. Archives of Neurology. 2003;60(4):577–582. doi: 10.1001/archneur.60.4.577. [DOI] [PubMed] [Google Scholar]
- 19.Guehne U, Luck T, Busse A, Angermeyer MC, Riedel-Heller SG. Mortality in individuals with mild cognitive impairment. Neuroepidemiology. 2007;29(3–4):226–234. doi: 10.1159/000112479. [DOI] [PubMed] [Google Scholar]
- 20.Hunderfund AL, Roberts RO, Slusser TC, et al. Mortality in amnestic mild cognitive impairment - A prospective community study. Neurology. 2006;67(10):1764–1768. doi: 10.1212/01.wnl.0000244430.39969.5f. [DOI] [PubMed] [Google Scholar]
- 21.Hendrie HC, Osuntokun BO, Hall KS, et al. Prevalence of Alzheimer’s disease and dementia in two communities: Nigerian Africans and African Americans. Am J Psychiatry. 1995;152(10):1485–1492. doi: 10.1176/ajp.152.10.1485. [DOI] [PubMed] [Google Scholar]
- 22.Hendrie HC, Ogunniyi A, Hall KS, et al. Incidence of dementia and Alzheimer disease in 2 communities: Yoruba residing in Ibadan, Nigeria, and African Americans residing in Indianapolis, Indiana. J A M A. 2001;285:739–747. doi: 10.1001/jama.285.6.739. [DOI] [PubMed] [Google Scholar]
- 23.Hall KS, Ogunniyi AO, Hendrie HC, et al. A cross-cultural community based study of dementias: Methods and performance of the survey instrument Indianapolis, U.S.A. and Ibadan, Nigeria. Int J Meth Psychiatric Res. 1996;6:129–142. [Google Scholar]
- 24.Hall KS, Hendrie HC, Brittain HM, et al. The development of a dementia screening interview in two distinct languages. Int J Meth Psychiatric Res. 1993;3:1–28. [Google Scholar]
- 25.Roth M, Tym E, Mountjoy CQ, et al. CAMDEX: A standardized instrument for the diagnosis of mental disorder in the elderly with special reference to the early detection of dementia. Br J Psychiatry. 1986;149:698–709. doi: 10.1192/bjp.149.6.698. [DOI] [PubMed] [Google Scholar]
- 26.Folstein MF, Folstein SE, McHugh PR. Mini-Mental State: A practical method for grading the cognitive state of patients for the clinician. J Psychiatr Res. 1975;12:189–198. doi: 10.1016/0022-3956(75)90026-6. [DOI] [PubMed] [Google Scholar]
- 27.Blessed G, Tomlinson BE, Roth M. The association between quantitative measures of dementia and of senile change in the cerebral grey matter of elderly subjects. Br J Psychiatry. 1968;114:797–811. doi: 10.1192/bjp.114.512.797. [DOI] [PubMed] [Google Scholar]
- 28.Gurland B, Kuriansky J, Sharpe L, Simon R, Stiller P, Birkett P. The Comprehensive assessment and Referral Evaluation (CARE)--rationale, development and reliability. Int J Aging Hum Dev. 1977;8(1) doi: 10.2190/cl3j-0e20-97xx-mv5l. [DOI] [PubMed] [Google Scholar]
- 29.Evans DA, Funkenstein HH, Albert MS, et al. Prevalence of Alzheimer’s disease in a community population of older persons: Higher than previously reported. JAMA. 1989;262:2551–2556. [PubMed] [Google Scholar]
- 30.Beckett LA, Scherr PA, Evans DA. Population prevalence estimates from complex samples. Journal of Clinical Epidemiology. 1992;45:393–402. doi: 10.1016/0895-4356(92)90040-t. [DOI] [PubMed] [Google Scholar]
- 31.Hendrie HC, Hall KS, Brittain HM, et al. The CAMDEX - A Standardized Instrument for the Diagnosis of Mental Disorder in the Elderly - A Replication with A United-States Sample. J Am Geriatr Soc. 1988;36(5):402–408. doi: 10.1111/j.1532-5415.1988.tb02378.x. [DOI] [PubMed] [Google Scholar]
- 32.Morris JC, Heyman A, Mohs RC, et al. The Consortium to Establish a Registry for Alzheimer’s Disease (CERAD). Part I. Clinical and neuropsychological assessment of Alzheimer’s disease. Neurology. 1989;39:1159–1165. doi: 10.1212/wnl.39.9.1159. [DOI] [PubMed] [Google Scholar]
- 33.Unverzagt FW, Hall KS, Torke AM, et al. Effects of age, education, and gender on CERAD neuropsychological test performance in an African American sample. The Clinical Neuropsychologist. 1996;10(2):180–190. [Google Scholar]
- 34.American Psychiatric Association. Diagnostic and Statistical Manual of Mental Disorders. 3. Washington, DC: American Psychiatric Association; 1987. Revised. [Google Scholar]
- 35.Breslow NE, Day NE. Iarc International Agency for Research on Cancer Scientific Publications No. 82. Statistical Methods in Cancer Research Vol. Ii the Design and Analysis of Cohort Studies. 1987 [PubMed] [Google Scholar]
- 36.Prentice RL, Pyke R. Logistic Disease Incidence Models and Case Control Studies. Biometrika. 1979;66(3):403–412. [Google Scholar]
- 37.Scott A, Wild C. Selection based on the response variable in logistic regression. In: Skinner C, Holt D, Smith T, editors. Analysis of Complex Survey. Chichester: John Wiley & Sons; 1989. [Google Scholar]
- 38.Manly JJ, Tang MX, Schupf N, Stern Y, Vonsattel JPG, Mayeux R. Frequency and course of mild cognitive impairment in a multiethnic community. Ann Neurol. 2008;63(4):494–506. doi: 10.1002/ana.21326. [DOI] [PMC free article] [PubMed] [Google Scholar]
- 39.Caracciolo B, Palmer K, Monastero R, Winblad B, Backman L, Fratiglioni L. Occurrence of cognitive impairment and dementia in the community - A 9-year-long prospective study. Neurology. 2008;70(19):1778–1785. doi: 10.1212/01.wnl.0000288180.21984.cb. [DOI] [PubMed] [Google Scholar]
- 40.Tervo S, Kivipelto M, Hanninen T, et al. Incidence and risk factors for mild cognitive impairment: A population-based three-year follow-up study of cognitively healthy elderly subjects. Dementia and Geriatric Cognitive Disorders. 2004;17(3):196–203. doi: 10.1159/000076356. [DOI] [PubMed] [Google Scholar]
- 41.Solfrizzi V, Panza F, Colacicco AM, et al. Vascular risk factors, incidence of MCI, and rates of progression to dementia. Neurology. 2004;63(10):1882–1891. doi: 10.1212/01.wnl.0000144281.38555.e3. [DOI] [PubMed] [Google Scholar]
- 42.Larrieu S, Letenneur L, Orgogozo JM, et al. Incidence and outcome of mild cognitive impairment in a population-based prospective cohort. Neurology. 2002;59(10):1594–1599. doi: 10.1212/01.wnl.0000034176.07159.f8. [DOI] [PubMed] [Google Scholar]
- 43.Hall KS, Gao S, Unverzagt FW, Hendrie HC. Low education and childhood rural residence increase risk for Alzheimer disease. Neurology. 2000;54:95–99. doi: 10.1212/wnl.54.1.95. [DOI] [PubMed] [Google Scholar]
- 44.Manly JJ. Deconstructing race and ethnicity - Implications for measurement of health outcomes. Medical Care. 2006;44(11):S10–S16. doi: 10.1097/01.mlr.0000245427.22788.be. [DOI] [PubMed] [Google Scholar]
- 45.Fleminger S, Oliver DL, Lovestone S, Rabe-Hesketh S, Giora A. Head injury as a risk factor for Alzheimer’s disease: the evidence 10 years on; a partial replication. Journal of Neurology Neurosurgery and Psychiatry. 2003;74(7):857–862. doi: 10.1136/jnnp.74.7.857. [DOI] [PMC free article] [PubMed] [Google Scholar]
- 46.Plassman BL, Havlik RJ, Steffens DC, et al. Documented head injury in early adulthood and risk of Alzheimer’s disease and other dementias. Neurology. 2000;55(8):1158–1166. doi: 10.1212/wnl.55.8.1158. [DOI] [PubMed] [Google Scholar]
- 47.Ownby RL, Crocco E, Acevedo A, John V, Loewenstein D. Depression and risk for Alzheimer disease - Systematic review, meta-analysis, and metaregression analysis. Arch Gen Psychiatry. 2006;63(5):530–538. doi: 10.1001/archpsyc.63.5.530. [DOI] [PMC free article] [PubMed] [Google Scholar]
- 48.Green RC, Cupples LA, Kurz A, et al. Depression as a risk factor for Alzheimer disease - The MIRAGE study. Arch Neurol. 2003;60(5):753–759. doi: 10.1001/archneur.60.5.753. [DOI] [PubMed] [Google Scholar]
- 49.Ebly EM, Hogan DB, Parhad IM. Cognitive impairment in the nondemented elderly: Results from the Canadian Study of Health and Aging. Arch Neurol. 1995;52:612–619. doi: 10.1001/archneur.1995.00540300086018. [DOI] [PubMed] [Google Scholar]