

Abstract
Human platelets play a key role in homeostasis and thrombosis and have recently emerged as key regulators of inflammation. Platelets stored for transfusion produce pro-thrombotic and pro-inflammatory mediators implicated in adverse transfusion reactions. Correspondingly, these mediators are central players in pathological conditions including cardiovascular disease, the major cause of death in diabetics. In view of this, a mass spectrometry based proteomics study was performed on platelets collected from healthy and type-2 diabetics stored for transfusion. Strikingly, our innovative and sensitive proteomic approach identified 122 proteins that were either up- or down-regulated in type-2 diabetics relative to non-diabetic controls and 117 proteins whose abundances changed during a 5-day storage period. Notably our studies are the first to characterize the proteome of platelets from diabetics before and after storage for transfusion. These identified differences allow us to formulate new hypotheses and experimentation to improve clinical outcomes by targeting “high risk platelets” that render platelet transfusion less effective or even unsafe.
Keywords: Proteomics, platelet storage, diabetes, transfusion, mass spectrometry
Introduction
Circulating blood platelets are small anucleate cells derived from cytoplasmic fragmentation of bone marrow megakaryocytes. Platelets play a key role in hemostasis and thrombosis, as well as in diseases such as myocardial infarction, stroke and deep vein thrombosis. Indeed millions of Americans are disabled or die each year as a consequence of pathologic platelet activation. Recently, it was recognized that platelets are key regulators of inflammation due to their release of potent proinflammatory and prothrombotic mediators such as CD40 ligand (CD154; CD40L) thromboxane A2 (TXA2), IL-1, etc.1–5 Further interest in platelets arises from the fact that millions of doses of platelets are transfused to patients with cancer, blood diseases, trauma, and those undergoing cardiac surgery.
There is an emerging realization that platelets from type-2 diabetics circulate in a partially activated state, which may predispose diabetics to vascular disease.6, 7 Furthermore, while blood donors with diabetes are routinely accepted for donation for transfusion, there are no data to determine whether platelets from diabetic donors are more or less efficacious or safe for recipients. Platelets can be stored for up to five days prior to transfusion. However, this results in a “platelet storage lesion” that includes partial platelet activation and release of bioactive proteins and lipid mediators (i.e., CD40L, IL-1, PPARγ, and TXA2).1–4, 8 These protein and lipid changes have been partially characterized and may contribute to serious post-transfusion adverse effects such as potentially fatal transfusion-related acute lung injury (TRALI) or multi-organ failure.9 Thus, there is a great need to better understand platelet function and to develop new insights into their proteome, ultimately leading to the development of new therapeutic strategies and disease biomarkers.
Even though platelets lack nuclear DNA they have a substantial and diverse transcriptome derived from the progenitor megakaryocyte and contain rough endoplasmic reticulum and polyribosomes, thereby retaining the capacity for protein biosynthesis from existing mRNA10–13. While quiescent platelets exhibit only limited translational activity, platelet activation leads to signaling-dependent translation of existing mRNA.14. Modern mass spectrometry based proteome capabilities allow for characterization of very large numbers of cellular proteins simultaneously.15, 16 Our strategy for analysis of human platelet proteins involves fractionation and purification of platelets, solublization of all proteins, trypsin digestion, chromatographic separation with direct coupling through electro-spray ionization into a tandem mass spectrometer,17–20 followed by statistical evaluation of ion current measurement to estimate changes in protein abundances relative to the appropriate controls.21 While our proteomics approach is excellent for identifying a large number of proteins and their variation in our samples, information regarding the functional status of these proteins is difficult to extrapolate from this data. Thus, comprehensive characterization of our proteomic results will be integrated with other experimental methods to correlate our proteomic data to biological activity. This novel approach allowed us to identify for the first time not only proteomic differences in normal versus platelets from type-2 diabetics, but also to determine how these proteins changed during the typical 5-day platelet storage.
Materials and methods
Platelet collection and purification
Whole blood was obtained (500 mL) according to an IRB approved protocol in the University of Rochester Blood Bank from male and female donors (ages 20–70) that were free of drugs known to alter platelet function, such as aspirin or non-steroidal anti-inflammatory agents, for two weeks prior to donation. Normal donors had a body mass index (BMI) ≤25 and were well-characterized with regard to normal platelet aggregation and coagulation profiles and other mediators indicative of general good health. Diabetic patients had a body mass index (BMI) ≥30 and at least one of the following criteria: random blood glucose > 200 mg/dL, elevated fasting glucose >106 mg/dL or impaired glucose tolerance during an oral glucose tolerance test. We considered donors whose physicians diagnosed them “diabetic” and if they also had at least two fasting glucose measurements that were over either 126 mg/dl (two samples) or 106 mg/dl (single donor). Both criteria are in use.
Blood was collected by venipuncture into a citrate phosphate dextrose adenine solution containing collection bag (Baxter Fenwal, Round Lake, IL). Platelets were prepared and stored by the whole blood method as used prior to transfusion in our Blood Bank/Transfusion Medicine Unit. In brief, platelet-rich plasma (PRP) was obtained by centrifugation (all centrifugations at 20–24°C) at 2,000 × g for 15 min. Platelet concentrates (PCs) were prepared by mechanically expressing the supernatant into an integrally attached plastic bag after centrifugation. The platelet rich plasma was then centrifuged at 4,300 × g for 10 min to form a platelet pellet. Residual plasma was expressed to leave approximately 50–70 mL for resuspension of the platelets by gentle mechanical agitation after a one hour rest period. Platelet concentrates were maintained at room temperature (22–26°C) throughout the storage period (5 days) with gentle agitation. Residual leukocytes were reduced to 5 × 10⁶ or less by filtration (Pall Purecell LRF, Pall Corporation, East Hills, NY) and the platelet concentrate was gamma irradiated at 2,500 rads (CIS-US IBL 437 Blood Irradiator) prior to storage to mimic typical clinical practice in our FDA registered transfusion service.
Preparation of platelet lysates
A 15 mL aliquot of stored platelet concentrate was removed at days 0 (4–6 h post venipuncture), and 5 and centrifuged (950 × g for10 min). The platelet concentrate supernatant was removed and stored at −80°C. The platelet pellet was gently washed in Krebs-Ringer Bicarbonate Buffer (KRB) (Sigma, St. Louis, MO) pH 7.4 containing 15 mM sodium bicarbonate and 19 mM sodium citrate, centrifuged (950xg/10 min), and the wash saved. The platelet pellet was resuspended in KRB pH 7.4 and platelets were counted on an Abbott Cell-Dyn 1700 (Abbott Park, IL). The purity of the platelets was approximately 99.9% of cells present. The final platelet suspension was centrifuged (950 × g for10 min) and the second wash removed and saved. Platelet pellets were lysed using nonidet P-40 lysis buffer containing a protease inhibitor cocktail (4-(2-aminoethyl)-benzenesulfonyl fluoride, pepstatin A, transepoxysuccinyl-L-leucylamido (4-guanidino) butane, bestatin, leupeptin, and aprotinin; Sigma). Total protein was quantified with a bicinchoninic acid (BCA) protein assay kit (Pierce, Rockford, IL).
Integrin α2β1 Analysis
Stored platelet concentrate samples were collected and centrifuged at 1000 × g for 5 min., and the platelets resuspended in PAB (1x PBS/1% BSA/0.1% sodium azide). Platelets were fluorescently labeled with anti-CD42a (BD Biosciences, San Jose, CA) and anti-integrin α2/β1 (Abcam, Cambridge, MA) antibodies and relative expression of each molecule assessed on a FACSCalibur flow cytometer (BD Biosciences) and analyzed using FlowJo software (TreeStar, Inc., Ashland, OR). Platelets were identified by their relative size and CD42a positive expression, then the intensity of the integrin α2/β1 expression calculated using the analysis software.
Platelet Spreading
Glass cover-slips were pre-treated with a suspension of fibrinogen (100 μg/mL) in phosphate buffered saline (PBS) for 1 hr at room temperature, washed with PBS and blocked with BSA (5mg/mL in PBS) for 1 h. Stored platelet concentrate samples were collected and applied directly to the coated cover-slips for 45 min at 37°C, washed as above and fixed with 4% PFA. Platelet spreading was imaged using Normarski differential interference contrast optics with an Olympus BX51 microscope (Melville, NY). Photographs were taken using a SPOT camera with SPOT RT software (New Hyde Park, NY).
Sample preparation for MS
A 100 μg aliquot of platelet protein from each sample in 100 μl of 0.1mM ammonium bicarbonate buffer was desalted on Zeba spin columns (Pierce); this procedure removed excess detergent, protease inhibitors and salts.19 The resulting eluates were made up to 4 M urea and warmed to 37°C for 10 min. Dithiothreitol was added to 10 mM final concentration and iodoacetamide added (0.25 mM final concentration) and the samples incubated for 1 h. The samples were diluted (1:4) with water to give 1.0 M urea, trypsin was added at 1:50 (wt:wt; trypsin:platelet protein) and the samples incubated at 37°C for 1 h. These samples were stored at −80°C prior to the next purification.17, 22 The peptide samples were thawed, acidified with formic acid to pH 4.0, applied to a strong cation exchange column and eluted with methanol:water:ammonium hydroxide (80:15:5). The eluting peptides were collected and evaporated to approximately 50 μL and 10 μL of 100 mM ammonium bicarbonate buffer was added. The samples were brought to 100 μL with deionized water, pH 7.0 and stored at −80°C prior to analysis by mass spectrometry. Protein and peptide concentrations were determined using the BCA assay using BSA as the standard. Completeness of the tryptic digestion was confirmed using 4–12% Bis-Tris PAGE gel separation.
Capillary LC-MS/MS spectrometry
The trypsin digested platelet samples were analyzed using an automated custom-built capillary HPLC system linked to an LTQ Orbitrap mass spectrometer (ThermoElectron, San Jose, CA) equipped with an electrospray ionization interface20. A reversed phase capillary column was prepared from 3μm Jupiter C18 particles (Phenomenex, Torrence, CA) into 75 μm i.d. × 70 cm fused silica capillary (Polymicro Technologies, Pheonix, AZ). The mobile phase consisted of 0.2% acetic acid and 0.05% TFA in water (A) and 0.1% TFA in 90% ACN/10% water (B)18. Samples (2.5 μg total peptide mass) were analyzed over a mass (m/z) range of 400–2000. The six most abundant ions from MS analysis were selected for MS/MS analysis using a collision energy setting of 35%. Dynamic exclusion was used to discriminate against previously analyzed ions.
After MS analysis the data were processed by SEQUEST version v.27 (rev. 12) using a 36 node cluster and the human IPI fasta protein list (v3.39, 2/07/2008).23, 24 The settings included: dynamic oxidation of methionine (+15.9949 Da), ±3 Da parent mass window, ± 1.0 Da fragment ion tolerance, up to 4 missed internal proteolytic cleavages, and no proteolytic enzyme requirement. SEQUEST results were filtered according to the criteria established by Yates et al.25–27 Peptides singly charged must have an Xcorr greater than 1.9 and doubly and triply charged peptides must have Xcorr equal to or greater that 2.2 and 3.75, respectively. Peptide identifications were imported into a Microsoft SQL database and peptide masses re-calculated according to IUPAC values (including modifications when identified). High resolution MS level data deisotoped was employed using an in-house implementation of the THRASH algorithm (Decon2LS, see http://omics.pnl.gov/software/ for details). Normalized elution times (NET) were calculated according to neural net algorithm previously described28, 29 and used to enhance peptide identifications. LC-MS features identified via the in-house VIPER software30 such that mass and NET values for eluting peptides are recorded along with their integrated abundance values. LC-MS features were then compared back to previously identified peptide sequences to provide sequence and protein information for each. Peptides and their associated proteins were collated into spreadsheet format. Protein redundancies from the IPI fasta were handled by associating peptides with the first occurrence of a given protein in the file. In those cases where uniquely identifying peptides were found, the protein associated with that peptide was chosen for grouping.31 This list of peptides, proteins, and their abundances were subsequently grouped for statistical evaluation.
Statistical methods
The biological study featured 45 MS analyses from 6 subjects including 3 non-diabetics, and 3 diabetics prepared fresh (Day 0), or after 1, 3, or 5 days of storage (Table 1). The samples from treatment groups were analyzed in 8 blocks (5 or 6 samples per block). This organization provided data for samples from both non-diabetic and diabetic individuals within each block allowing for control of LC-MS processing effects as well as the effects for time of data acquisition. Mean protein abundances were extracted from peptide ion current data using a mixed-effects linear statistical model.21 Since the sample abundance distributions varied over analysis time from the overall mean abundance, with a slight downward trend over time, sample abundances were adjusted by subtracting the difference between a sample’s geometric mean abundance and the overall geometric mean abundance calculated from abundance values for the 252 peptides observed in 43 or more of the 45 LC-MS injections. The LC-MS data set was parsed into protein-specific subsets. A two-stage fit of a mixed effects linear model was applied to each subset to estimate a protein’s relative concentrations using methods that we reported previously.21 The model included diabetes, sample storage time and peptide identity as fixed effects factors and also diabetes by sample storage time interactions. Previously calculated LC-MS whole sample effects were included as covariate while blocking was considered a random effect. Using the mixed effects model and restricted maximum likelihood estimation (REML), a two stage fit accounted for the variability among a protein’s abundances with parameters associated with either diabetes, sample storage time, or LC-MS processing. Criteria for significantly up- and down-regulated proteins included: 1) differences in means at a P< 0.05 level, and 2) elimination of proteins with 95% confidence intervals that include 1.0 (either above or below). Proteins listed in the tables meet both of these criteria.
Table 1.
MS analysis frequency across disease and platelet storage time
| Disease State | Subject | Sample Prep Day | Total | |||
|---|---|---|---|---|---|---|
| 0 | 1 | 3 | 5 | |||
| Non- Diabetic | 1 | 3 | 1 | 2 | 2 | 8 |
| 2 | 4 | 2 | 1 | 2 | 9 | |
| 3 | 3 | 2 | 1 | 2 | 8 | |
| Diabetic | 4 | 1 | 1 | 1 | 1 | 4 |
| 5 | 4 | 1 | 1 | 2 | 8 | |
| 6 | 3 | 2 | 1 | 2 | 8 | |
| Total | 18 | 9 | 7 | 11 | 45 | |
Results
Overall description
There were 844 protein identifications using our mass spectrometry based proteomics approach after removal of redundancies. Sufficient data was obtained for statistical analysis of 537 of these proteins using the mixed-effects linear model (i.e., at least 9 peptide observations for any given protein identification; Table 2). The data were partitioned to identify those proteins with significantly altered abundances (P≤ 0.05) with respect to diabetes or storage time. This approach resulted in identification of 122 proteins that were related to diabetes and 117 proteins that changed during the 5-day storage period.
Table 2.
Summary of MS identified platelet proteins following statistical analysis to identify proteins that were either up- or down-regulated proteins in sample from diabetics or following 5-days of platelet storage. A total of 844 proteins were identified by our MS based proteomics approach; for 537 of these proteins there was sufficient data for statistical evaluation.
| Diabetes | Storage time | ||
|---|---|---|---|
| Identifications | 122 | 117 | |
| Abundance | -Up | 25 | 34 |
| -Down | 97 | 83 | |
P≤ 0.05 was used to identify proteins with significantly altered abundance.
Protein changes attributable to diabetes
Since peptide ion current data were normalized to the appropriate non-disease controls, proteins that were up- or down-regulated could be identified. This approach identified 25 up-regulated and 97 down-regulated proteins in the disease group (Table 2). The cellular location of these proteins were determined using UniProt and are summarized in Figure 1. The proteins were associated with many subcellular locations with the largest number associated with the cytoplasm, membrane, nuclear (in anucleated cells), cytoskeleton and extracellular compartments. For the diabetic group 34 proteins possessed enzymatic activity and approximately 53% of these were localized to the cytoplasm. Thirty one percent of the 38 membrane associated proteins contained transmembrane (TM) domains; most were single pass proteins. The cellular location for 8 of the 122 proteins with altered abundance is unknown.
Figure 1.
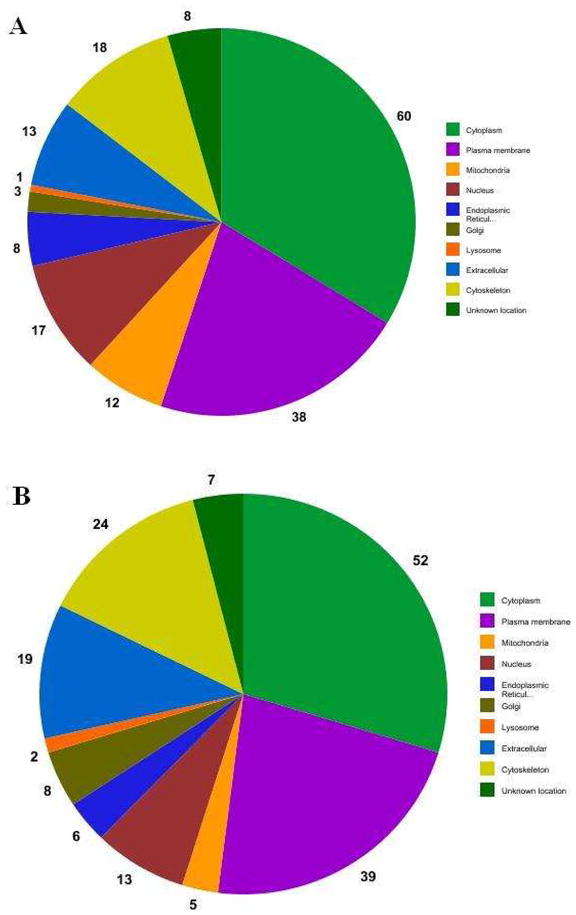
Cellular locations of proteins observed with differential abundance due to diabetes (A) and after 5-days of storage (B).
When the 122 diabetes related proteins were evaluated using information from UniProt, several protein groups were apparent (Table 3). First the relative concentrations of several hemoglobin subunits were elevated in diabetics by as much as 28.9 fold (abundance ratio range, 5.7–28.9). This was seen in all samples from diabetics and not seen in those from non-diabetics suggesting that it is an effect of diabetes. Another group of proteins, associated with carbohydrate metabolism, localized to both the cytoplasm and mitochondria. Three proteins from this group (glycogen phosphorylase, down-0.41; pyruvate kinase, down-0.67; 6-phosphofructokinase, up-1.54) are allosterically regulated enzymes that catalyze rate limiting steps in carbohydrate metabolism. Other down-regulated proteins involved in glycolysis included lactate dehydrogenase, triosephosphate isomerase, enolase, and transaldolase from the pentose-phosphate pathway. Similarly isocitrate dehydrogenase, ATP synthase and malate dehydrogenase, all mitochondrial enzymes involved in energy production, were down-regulated. Platelet glycoprotein 1b, a platelet membrane receptor comprised of alpha and beta chains that participate in the initial adhesion to the subendothelium through binding to von Willebrand factor, was also down–regulated.32 Other groups of protein included those that bind nucleotides, proteins that are involved in complexes, proteins that bind to actin, and proteins that inhibit proteases.
Table 3.
Proteins with significantly altered abundances which are attributable to type-2 diabetes. D/N indicates the abundance ratio for diabetics to non-diabetics. Statistical significance (p≤0.05) was determined using the mixed-effects linear method as described in the methods section. Also shown are the number of peptide(s) seen by the MS and the number of times each peptide(s) was observed out of a total of 45 MS runs.
| Uniprot | ProteinDescription | D/N | 95% Conf. Int. | Peptides | # MS Runs | Location |
|---|---|---|---|---|---|---|
| Q9Y6D8 | Mutant beta-globin | 28.9 | 27.0–30.1 | 2 | 45 | |
| P68871 | Hemoglobin subunit beta | 21.7 | 10.6–44.4 | 12 | 45 | |
| P02008 | Hemoglobin subunit zeta | 21.3 | 17.1–26.4 | 3 | 45 | |
| P02042 | Hemoglobin subunit delta | 19.2 | 11.3–32.5 | 15 | 45 | |
| P69905 | Hemoglobin subunit alpha | 18.8 | 7.8–45.3 | 19 | 45 | |
| P02100 | Hemoglobin subunit epsilon | 5.70 | 2.4–13.4 | 1 | 45 | |
| Q9H532 | Solute carrier family 17 (sodium phosphate) | 3.15 | 2.0–4.8 | 1 | 17 | Pm, ER |
| Q92673 | Sortilin-related receptor precursor | 3.14 | 2.1–4.8 | 1 | 13 | Pm |
| Q9P173 | Serine-type endopeptidase inhibitor, PRO2275 | 2.62 | 2.2–3.2 | 4 | 32 | Ec |
| Q6PIH6 | Immunoglobin kappa variable 1–5 | 2.44 | 1.4–4.3 | 3 | 17 | Ec |
| Q6N097 | Putative uncharacterized protein DKFZp686H20196 | 2.18 | 1.8–2.7 | 7 | 38 | Ec |
| P54727 | UV excision repair protein RAD23 homolog B | 2.10 | 1.4–3.1 | 2 | 18 | Cy, N |
| O43266 | Extracellular matrix protein 1 | 1.85 | 1.3–2.6 | 1 | 15 | Ec |
| P09972 | Fructose-bisphosphate aldolase C | 1.72 | 1.3–2.3 | 3 | 27 | Cs |
| P07437 | Tubulin beta chain | 1.61 | 1.2–2.2 | 8 | 41 | Cy, Cs |
| Q01813 | 6-phosphofructokinase type C | 1.54 | 1.1–2.2 | 7 | 25 | Cy |
| P02787 | Serotransferrin precursor | 1.48 | 1.1–2.0 | 7 | 17 | Ec |
| P00918 | Carbonic anhydrase 2 | 1.41 | 1.2–1.7 | 8 | 45 | Cy |
| O00161-1 | Synaptosomal-associated protein 23, isoform SNAP-23a | 1.38 | 1.2–1.6 | 2 | 34 | Pm |
| Q06323 | Proteasome activator complex subunit 1 | 1.37 | 1.2–1.6 | 3 | 38 | Cy |
| P37840-1 | Alpha-synuclein, isoform 1 | 1.37 | 1.2–1.6 | 7 | 44 | Cy, N |
| P47756 | F-actin-capping protein, subunit beta | 1.27 | 1.1–1.4 | 2 | 20 | Cy, Pm |
| Q13404-4 | Ubiquitin-conjugating enzyme E2 variant 1, isoform 4 | 1.24 | 1.2–1.3 | 2 | 42 | Cy, N |
| Q59F97 | Putative uncharacterized protein DKFZp686I04222 | 1.16 | 1.0–1.3 | 2 | 31 | Cy |
| O00499-1 | Myc box-dependent-interacting protein 1, isoform IIA | 1.12 | 1.1–1.2 | 2 | 27 | Cy, Cs, N |
| P68402 | Platelet-activating factor acetylhydrolase IB subunit beta | 0.90 | 0.9–0.9 | 2 | 42 | Cy |
| P45880-1 | Voltage-dependent anion-selective channel protein 2 | 0.89 | 0.8–1.0 | 2 | 39 | M |
| Q15257-3 | Serine/threonine-protein phosphatase 2A regulatory subunit B, isoform 3 | 0.88 | 0.8–0.9 | 2 | 24 | Cy |
| Q9BYZ2 | L-lactate dehydrogenase A-like 6B | 0.87 | 0.8–1.0 | 2 | 27 | Cy |
| P47756-1 | F-actin-capping protein subunit beta, isoform 1 | 0.87 | 0.8–1.0 | 2 | 38 | Cy, Pm |
| O75083-2 | WD repeat-containing protein 1, isoform 2 | 0.85 | 0.7–1.0 | 25 | 44 | Cy, Cs |
| P48735 | Isocitrate dehydrogenase [NADP] | 0.84 | 0.7–1.0 | 16 | 43 | M |
| Q5VVY1 | Similar to Y74C9A.3 | 0.83 | 0.7–1.0 | 1 | 41 | - |
| P35241 | Radixin isoform b | 0.82 | 0.7–1.0 | 9 | 44 | Cy, Cs, Pm |
| P07737 | Profilin-1 | 0.82 | 0.7–1.0 | 14 | 45 | Cy, Cs, N |
| P25705 | ATP synthase subunit alpha | 0.82 | 0.7–0.9 | 18 | 44 | M |
| O00299 | Chloride intracellular channel protein 1 | 0.82 | 0.7–0.9 | 10 | 43 | Cy, Pm |
| P60174-2 | Triosephosphate isomerase, isoform 2 | 0.82 | 0.7–1.0 | 2 | 42 | Cy |
| P12814 | Alpha-actinin-1 | 0.82 | 0.7–0.9 | 61 | 45 | Cy, Cs |
| Q9Y490 | Talin-1 | 0.81 | 0.7–0.9 | 155 | 45 | Cy, Cs, Pm |
| P35442 | Thrombospondin-2 precursor | 0.81 | 0.8–0.8 | 2 | 37 | Ec |
| P18054 | Arachidonate 12-lipoxygenase | 0.80 | 0.7–0.9 | 10 | 43 | Cy |
| Q14568 | Heat shock protein 90 kDa alpha class A member 2 (Fragment) | 0.80 | 0.7–1.0 | 2 | 36 | Cy |
| P30740 | Leukocyte elastase inhibitor | 0.80 | 0.7–1.0 | 11 | 42 | Cy |
| P48426 | Phosphatidylinositol-5-phosphate 4-kinase type-2 alpha | 0.79 | 0.6–1.0 | 4 | 43 | - |
| P55072 | Transitional endoplasmic reticulum ATPase | 0.78 | 0.6–1.0 | 23 | 42 | Cy, ER, N |
| P07947 | Proto-oncogene tyrosine-protein kinase Yes | 0.78 | 0.7–0.9 | 2 | 35 | Cy, Pm |
| P02679-1 | Fibrinogen gamma chain precursor, isoform Gamma-B | 0.78 | 0.6–0.9 | 29 | 43 | Ec, Pm |
| P34931 | Heat shock 70 kDa protein 1L | 0.77 | 0.6–1.0 | 4 | 37 | Cy |
| Q59GD5 | Actin-related protein 3-beta isoform 1 | 0.76 | 0.6–1.0 | 2 | 36 | Cs |
| P13224 | Glycoprotein Ib beta | 0.76 | 0.6–0.9 | 5 | 44 | Pm |
| P61586 | Transforming protein RhoA precursor | 0.76 | 0.6–0.9 | 4 | 32 | Cy, Cs, Pm |
| P30101 | Protein disulfide-isomerase A3 precursor | 0.76 | 0.7–0.9 | 28 | 44 | ER |
| P52566 | Rho GDP-dissociation inhibitor 2 | 0.76 | 0.6–0.9 | 13 | 45 | Cy, Cs, Pm |
| P27797 | Calreticulin precursor | 0.75 | 0.6–1.0 | 14 | 42 | Ec, Cy, ER |
| P60953-1 | Cell division control protein 42 homolog precursor, isoform 1 | 0.74 | 0.6–0.9 | 3 | 43 | Cy, Pm |
| Q13418 | Integrin-linked protein kinase | 0.74 | 0.6–0.9 | 26 | 45 | Cy, Pm |
| P30405 | Peptidyl-prolyl cis-trans isomerase | 0.73 | 0.6–1.0 | 4 | 43 | M |
| P50552 | Vasodilator-stimulated phosphoprotein | 0.73 | 0.6–0.9 | 12 | 44 | Cy, Cs |
| P40227 | T-complex protein 1 subunit zeta | 0.73 | 0.6–1.0 | 6 | 21 | Cy |
| O15143 | Actin-related protein 2/3 complex subunit 1B | 0.73 | 0.6–0.9 | 4 | 33 | Cy |
| Q9GZV4 | Eukaryotic translation initiation factor 5A-2 | 0.73 | 0.7–0.8 | 2 | 44 | Cy |
| Q86UX7-2 | Unc-112-related protein 2, isoform 2 | 0.72 | 0.6–0.9 | 38 | 45 | Cy, Cs |
| P05106-1 | Integrin beta-3 precursor, isoform Beta-3A | 0.72 | 0.6–0.8 | 3 | 43 | Pm |
| P99999 | Cytochrome c | 0.72 | 0.6–0.9 | 4 | 33 | Cy, N, M |
| O95837 | Guanine nucleotide-binding protein alpha-14 subunit | 0.72 | 0.7–0.8 | 2 | 41 | Pm |
| P08107 | Heat shock 70 kDa protein 1 | 0.72 | 0.6–0.8 | 7 | 35 | - |
| Q14315-1 | Filamin-C, isoform 1 | 0.72 | 0.5–1.0 | 7 | 44 | Cy, Cs, Pm |
| Q16843 | Thromboxane A synthase 1 | 0.71 | 0.6–0.9 | 5 | 36 | Pm |
| P14174 | Macrophage migration inhibitory factor | 0.71 | 0.7–0.7 | 2 | 27 | Ec |
| Q9Y251 | Heparanase precursor | 0.71 | 0.6–0.8 | 4 | 45 | Ec, Pm, L |
| O95866-1 | Protein G6b precursor, isoform B | 0.70 | 0.6–0.8 | 4 | 43 | ER, G, Pm |
| Q15365 | Poly(rC)-binding protein 1 | 0.70 | 0.6–0.8 | 3 | 38 | Cy, N |
| P23229-1 | Integrin alpha-6 precursor, isoform Alpha-6X1X2B | 0.70 | 0.6–0.8 | 11 | 42 | Pm |
| A8K1Z2 | Glycerol-3-phosphate dehydrogenase, isoform 1 | 0.70 | 0.6–0.8 | 5 | 22 | M |
| P07384 | Calpain-1 catalytic subunit | 0.69 | 0.6–0.8 | 9 | 41 | Cy, Pm |
| Q9Y624 | Junctional adhesion molecule A precursor | 0.69 | 0.6–0.9 | 5 | 43 | Pm |
| Q9NRW1 | Ras-related protein Rab-6B | 0.69 | 0.6–0.9 | 4 | 27 | G, Pm |
| P17301 | Integrin alpha-2 precursor | 0.68 | 0.6–0.8 | 8 | 27 | Pm |
| P23219-1 | Cyclooxygenase 1b3 | 0.68 | 0.5–1.0 | 4 | 38 | Cy, N, ER, Pm |
| P51452 | Dual specificity protein phosphatase 3 | 0.68 | 0.5–0.9 | 3 | 19 | N |
| Q9UJC5 | SH3 domain-binding glutamic acid-rich-like protein 2 | 0.68 | 0.5–0.9 | 2 | 32 | N |
| P48059 | Similar to LIM and senescent cell antigen-like domains 1 | 0.67 | 0.5–0.9 | 1 | 43 | - |
| P14618-1 | Pyruvate kinase isozymes M1/M2, isoform M2 | 0.67 | 0.6–0.8 | 3 | 43 | Cy |
| Q15404 | Ras suppressor protein 1 | 0.67 | 0.5–0.9 | 18 | 45 | - |
| P40926 | Malate dehydrogenase | 0.66 | 0.5–0.9 | 10 | 43 | M |
| P10720 | Platelet factor 4 variant precursor | 0.66 | 0.6–0.7 | 2 | 45 | Ec |
| P61604 | Heat shock protein, 10 kDa | 0.66 | 0.6–0.8 | 4 | 41 | M |
| O14556 | Glyceraldehyde-3-phosphate dehydrogenase | 0.66 | 0.5–0.8 | 1 | 44 | Cy |
| P61158 | Actin-related protein 3 | 0.66 | 0.6–0.8 | 6 | 36 | Cy |
| P31146 | Coronin-1A | 0.66 | 0.5–0.8 | 9 | 42 | Cy, Cs, Pm, N |
| P50395 | Rab GDP dissociation inhibitor beta | 0.65 | 0.5–0.9 | 3 | 43 | Cy, Pm |
| Q9Y277-1 | Voltage-dependent anion-selective channel protein 3, isoform 1 | 0.65 | 0.5–0.9 | 4 | 29 | M |
| Q53FI7 | Four and a half LIM domains 1 variant | 0.65 | 0.5–0.8 | 3 | 36 | Cy, N |
| Q9UI15 | Transgelin-3 | 0.65 | 0.6–0.7 | 3 | 15 | - |
| Q14019 | Coactosin-like protein | 0.64 | 0.5–0.8 | 8 | 41 | Cy, Cs |
| O43707 | Alpha-actinin-4 | 0.64 | 0.5–0.8 | 12 | 39 | Cy, Cs, N |
| XP_064265 | Similar to Myosin light polypeptide 6 | 0.64 | 0.6–0.7 | 2 | 45 | - |
| P04632 | Calpain small subunit 1 | 0.64 | 0.5–0.8 | 5 | 39 | Cy, Pm |
| Q5SQ64 | Lymphocyte antigen 6 complex locus protein G6f | 0.63 | 0.5–0.8 | 3 | 39 | Pm |
| P48047 | ATP synthase subunit O | 0.63 | 0.5–0.8 | 7 | 29 | M |
| P09104 | Gamma-enolase | 0.62 | 0.6–0.7 | 5 | 44 | Cy, Pm |
| P09486 | SPARC precursor | 0.62 | 0.5–0.8 | 4 | 36 | Ec |
| P51659 | Peroxisomal multifunctional enzyme type 2 | 0.61 | 0.5–0.7 | 3 | 21 | M |
| O75915 | PRA1 family protein 3 | 0.60 | 0.4–0.9 | 4 | 31 | Cy, ER, Pm |
| Q9BSJ8-1 | Extended-synaptotagmin-1, isoform 1 | 0.60 | 0.5–0.8 | 5 | 26 | Pm |
| O75558 | Syntaxin-11 | 0.60 | 0.5–0.8 | 4 | 34 | G, Pm |
| P37837 | Transaldolase | 0.59 | 0.4–0.8 | 3 | 26 | Cy |
| P30040 | Endoplasmic reticulum protein ERp29 precursor | 0.58 | 0.5–0.7 | 3 | 36 | ER |
| O43396 | Thioredoxin-like protein 1 | 0.58 | 0.5–0.7 | 1 | 35 | Cy |
| P10124 | Serglycin precursor | 0.57 | 0.5–0.7 | 5 | 42 | Ec |
| A6NMR3 | Uncharacterized protein PECAM1 | 0.57 | 0.5–0.7 | 5 | 36 | Pm |
| P38646 | Stress-70 protein | 0.56 | 0.4–0.8 | 1 | 25 | Cy, M |
| P61088 | Ubiquitin-conjugating enzyme E2 N | 0.56 | 0.6–0.6 | 2 | 27 | Cy, N |
| P16284-1 | Platelet endothelial cell adhesion molecule precursor, isoform Long | 0.53 | 0.4–0.6 | 9 | 37 | Pm |
| Q96RI3 | Short heat shock protein 60 Hsp60s2 | 0.52 | 0.4–0.7 | 2 | 19 | - |
| P62979 | UBB ubiquitin and ribosomal protein S27a precursor | 0.50 | 0.4–0.7 | 2 | 28 | Cy |
| Q9ULV4 | Coronin-1C_i3 protein | 0.49 | 0.3–0.8 | 6 | 23 | Cs |
| Q9BVC6 | Transmembrane protein 109 precursor | 0.46 | 0.3–0.7 | 1 | 24 | N |
| P11216 | Glycogen phosphorylase | 0.41 | 0.3–0.5 | 14 | 36 | Cy |
| P30443 | HLA class I histocompatibility antigen | 0.35 | 0.3–0.4 | 1 | 33 | Cy, Pm |
| P21291 | Cysteine and glycine-rich protein 1 | 0.30 | 0.2–0.4 | 2 | 29 | N |
The last column shows the sub-cellular location including: Cy = cytoplasm, Cs = cytoskeleton, Ec = extracellular, ER = endoplasmic reticulum, G = golgi, L = lysosome, M = mitochondria, N = nucleus, Pm = plasma membrane, - = unknown.
Using information from UniProt and RNA array databases,33–35 we identified proteins from the diabetes group that have been shown to be associated with platelets (Table 4). One of these, extracellular matrix protein-1, was up-regulated in the diabetes group by 85% (abundance ratio 1.85) and functions to positively regulate I-kappaB kinase. Further, many proteins involved in blood coagulation were consistently down-regulated by approximately 25%. This included transmembrane receptors known as integrins (alpha-6 isoform) that complex with fibrinogen and other blood clotting factors that are involved in cell adhesion.
Table 4.
Using information from mRNA databases and UniProt, proteins known to be associated with platelets were identified. These proteins were classified as either unique to diabetes, unique to storage or common to diabetes and storage. D/N indicates the abundance ratio for diabetics to non-diabetic, whereas D5/D0 is the abundance ratio for platelets stored for 5-days relative to those from freshly collected platelets. Statistical significance (p≤ 0.05) was determined using the mixed-effects linear method.
| Identifier | Description - Function | D/N | D5/D0 | Location |
|---|---|---|---|---|
| Proteins Unique to Diabetes | ||||
| O43266 | Extracellular matrix protein-1 - Signal transducer | 1.85 | NA | Ec |
| P60953-1 | Cell division control protein 42 homolog Isoform 1 - GTPase | 0.74 | NA | Pm, Cy |
| P50552 | Vasodilator-stimulated phosphoprotein - Actin binding | 0.73 | NA | Cs, Cy |
| P23229-1 | Integrin alpha-6 Isoform a-6X1X2B - Receptor, calcium binding | 0.70 | NA | Pm |
| Q9Y624 | Junctional adhesion molecule A - Protein binding | 0.69 | NA | Pm |
| P16284-1 | Platelet endothelial cell adhesion-Long - Protein binding | 0.53 | NA | Pm |
| Proteins Unique toStorage | ||||
| A6NBZ8 | Uncharacterized protein ALB - Transport, apoptosis | NA | 2.56 | Ec |
| P14770 | Platelet glycoprotein IX precursor - Cell adhesion, blood coagulation | NA | 1.67 | Pm |
| P14174 | Macrophage migration inhibitory factor - Inflammation, prostaglandin biosynthesis, receptor | NA | 0.89 | Ec |
| P16671 | Platelet glycoprotein IV - Cell adhesion, blood coagulation, lipoprotein transport | NA | 0.82 | Pm |
| P21926 | CD9 antigen - Cell adhesion and motility, platelet activation | NA | 0.74 | Pm |
| P40197 | Platelet glycoprotein V - Cell adhesion, blood coagulation, CD42D antigen | NA | 0.41 | Pm |
| P02775 | Pro-platelet basic protein - Cytokine, growth factor, chemotaxis, glucose transport | NA | 0.40 | Ec |
| Q13201 | Multimerin-1 precursor - Cell adhesion, blood coagulation | NA | 0.36 | Ec |
| P02671-1 | Fibrinogen a Isoform 1 - Receptor | MA | 0.67 | Pm, Ec |
| P02675 | Fibrinogen b - Receptor | NA | 0.54 | Cs, Cy |
| P07996 | Thrombospondin-1 - Peptidase inhibitor; signal transducer; structural | NA | 0.48 | Ec |
| Proteins Common to Diabetes and Storage | ||||
| Q9P173 | Uncharacterized PRO2275 - Endopeptidase inhibitor | 2.62 | 3.54 | Ec |
| P13224 | Glycoprotein Ib b - Receptor | 0.76 | 1.53 | Pm |
| P68402 | Platelet-activating factor acetylhydrolase IB-b - Esterase | 0.90 | 0.85 | Cy |
| O95866-1 | Protein G6b Isoform B - Receptor, Heparin binding | 0.70 | 0.83 | Pm, ER, G |
| P17301 | Integrin alpha-2 precursor - Cell adhesion, integrin-mediated signaling, blood coagulation | 0.68 | 0.71 | Pm |
| P02679-1 | Fibrinogen γ Isoform γB - Receptor; Calcium binding | 0.78 | 0.63 | Pm, Ec |
| P05106-1 | Integrin beta 3 Isoform 3A - Receptor, integrin binding | 0.72 | 0.58 | Pm |
| P35442 | Thrombospondin-2 - Structural; Calcium binding | 0.81 | 0.42 | Ec |
| P09486 | Secreted protein acidic and rich in cysteine - Copper, calcium collagen binding | 0.62 | 0.41 | Ec |
| P10720 | Platelet factor 4 variant - Chemokine activity, heparin binding | 0.66 | 0.38 | Ec |
| P10124 | Serglycin - Protein binding | 0.57 | 0.33 | Ec, G |
The last column shows the sub-cellular location including: Cy = cytoplasm, Cs = cytoskeleton, Ec = extracellular, ER = endoplasmic reticulum, G = golgi, L = lysosome, M = mitochondria, N = nucleus, Pm = plasma membrane, - = unknown.
Protein changes attributable to storage time
The cellular locations for the 117 proteins with altered abundance from the 5-day storage group were similar to those of the diabetics group with the exception that there were fewer proteins associated with the nuclear and mitochondrial compartments (Figure 1). Twenty nine percent of the proteins with altered abundance were up-regulated (34) whereas 83 were down-regulated (Table 2). When UniProt information was used to help classify the 117 proteins, several differences were observed with respect to the diabetes group (Table 5). Most notably there were far fewer enzymes involved in carbohydrate metabolism (i.e., 5 vs. 14); all of these proteins were down-regulated in the storage group compared to 14% (2 of 14) that were up-regulated in the diabetes group. Additionally, there were no storage time changes in the three allosterically regulated enzymes (glycogen phosphorylase, pyruvate kinase, and 6-phosphofructokinase) that catalyze rate limiting steps in carbohydrate metabolism. Other groups of proteins that were unchanged with respect to the diabetes group included those that are involved in complexes, inhibit proteases, and bind to nucleotides or actin.
Table 5.
Proteins with significantly altered abundances that are attributable to the 5-days of storage. D5/D0 indicates the abundance ratio for platelets stored for 5-days relative to fresh platelets. Statistical significance (p≤ 0.05) was determined using the mixed-effects linear method as described in the methods section. Also shown are the number of peptide(s) seen by the MS and the number of times each peptide(s) was observed out of a total of 45 MS runs.
| Identifier | ProteinDescription | D5/D0 | 95% Conf. Int. | Peptides | NJobs | Location |
|---|---|---|---|---|---|---|
| Q6PIH6 | IGKV1-5 protein | 4.03 | 2.3–7.2 | 3 | 17 | Ec |
| Q9P173 | Uncharacterized PRO2275 | 3.54 | 2.9–4.3 | 4 | 32 | Ec |
| Q9H532 | Solute carrier family 17 (sodium phosphate) | 3.11 | 2.0–4.7 | 1 | 17 | Pm, ER |
| Q6N097 | Putative uncharacterized protein DKFZp686H20196 | 2.70 | 2.2–3.4 | 7 | 38 | Ec |
| A6NBZ8 | Uncharacterized protein ALB | 2.56 | 2.2–3.0 | 32 | 45 | Ec |
| P02787 | Serotransferrin precursor | 2.13 | 1.6–2.9 | 7 | 17 | Ec |
| Q9BQB6-2 | Vitamin K epoxide reductase, isoform 2, subunit 1 | 2.09 | 1.6–2.8 | 1 | 35 | Ec |
| Q9ULV4 | CORO1C 18 kDa protein | 2.05 | 1.4–2.9 | 1 | 28 | Cs |
| O75369-1 | Filamin-B, isoform 1 | 1.87 | 1.0–3.4 | 5 | 21 | Cy, Cs |
| O15144 | Actin-related protein 2/3 complex, subunit 2 | 1.82 | 1.4–2.4 | 5 | 28 | Cy, Cs |
| Q13404-4 | Ubiquitin-conjugating enzyme E2 variant 1, isoform 4 | 1.71 | 1.6–1.8 | 2 | 42 | N |
| Q15833 | Syntaxin-binding protein 2 | 1.70 | 1.2–2.3 | 11 | 36 | - |
| P14770 | Platelet glycoprotein IX precursor | 1.67 | 1.2–2.3 | 5 | 38 | Pm |
| P54727 | UV excision repair protein RAD23 homolog B | 1.67 | 1.1–2.4 | 2 | 18 | N, Cy |
| P13224 | Glycoprotein Ib beta | 1.53 | 1.3–1.8 | 5 | 44 | Pm |
| Q9NVA2 | Septin-11 | 1.47 | 1.2–1.8 | 5 | 28 | N |
| P59998 | TTLL3 Actin-related protein 2/3 complex subunit 4 | 1.46 | 1.3–1.7 | 2 | 43 | Cy, Cs |
| Q59GD5 | Actin-related protein 3-beta, isoform 1 | 1.46 | 1.2–1.8 | 2 | 36 | Cs |
| P06753-1 | Tropomyosin 3 isoform 1 | 1.44 | 1.2–1.7 | 3 | 38 | Cy, Cs |
| Q9Y427 | Tropomyosin 1 alpha chain isoform 2 | 1.42 | 1.2–1.7 | 11 | 45 | Cy, Cs |
| Q9Y277-1 | Voltage-dependent anion-selective channel protein 3, isoform 1 | 1.36 | 1.0–1.8 | 4 | 29 | M |
| P05556-3 | Integrin beta-1 precursor, isoform beta-1C | 1.33 | 1.2–1.5 | 8 | 41 | Pm, ER |
| P45880-1 | Voltage-dependent anion-selective channel protein 2 | 1.30 | 1.2–1.4 | 2 | 39 | M |
| O15511-2 | Actin-related protein 2/3 complex subunit 5, isoform 2 | 1.30 | 1.1–1.5 | 1 | 40 | Cy |
| P62158 | Calmodulin | 1.29 | 1.1–1.5 | 2 | 31 | Cy, Pm |
| P00403 | Cytochrome c oxidase subunit 2 | 1.28 | 1.2–1.4 | 2 | 41 | M |
| Q15257-3 | Serine/threonine-protein phosphatase 2A regulatory subunit B, isoform 3 | 1.28 | 1.2–1.3 | 2 | 24 | Cy |
| P06753-2 | Tropomyosin alpha-3 chain, isoform 2 | 1.27 | 1.1–1.5 | 6 | 44 | Cy, Cs |
| Q9UI15 | Transgelin-3 | 1.27 | 1.2–1.4 | 3 | 15 | - |
| P51572 | B-cell receptor-associated protein 31 | 1.22 | 1.1–1.4 | 5 | 43 | G, Pm, ER |
| P12814 | Alpha-actinin-1 | 1.21 | 1.1–1.4 | 61 | 45 | Cy, Cs |
| O95837 | Guanine nucleotide-binding protein alpha-14 subunit | 1.20 | 1.2–1.2 | 2 | 41 | Pm, G |
| P25705 | ATP synthase subunit alpha | 1.20 | 1.1–1.4 | 18 | 44 | M |
| Q9Y6D8 | Mutant beta-globin | 1.15 | 1.1–1.2 | 2 | 45 | - |
| P61088 | Ubiquitin-conjugating enzyme E2 N | 0.89 | 0.9–0.9 | 2 | 27 | Cy, N |
| P60842 | Eukaryotic initiation factor 4A-I | 0.89 | 0.8–1.0 | 2 | 34 | Cy |
| P14174 | Macrophage migration inhibitory factor | 0.89 | 0.9–0.9 | 2 | 27 | Ec |
| P68402 | Platelet-activating factor acetylhydrolase IB subunit beta | 0.85 | 0.8–0.9 | 2 | 42 | Cy |
| P35241 | Radixin isoform b | 0.83 | 0.7–1.0 | 9 | 44 | Cy, Cs, Pm |
| O95866-1 | Protein G6b precursor, isoform B | 0.83 | 0.7–0.9 | 4 | 43 | ER, G, Pm |
| P16671 | Platelet glycoprotein 4 | 0.82 | 0.7–1.0 | 9 | 43 | Pm |
| O00299 | Chloride intracellular channel protein 1 | 0.81 | 0.7–0.9 | 10 | 43 | Cy, Pm |
| P30740 | Leukocyte elastase inhibitor | 0.80 | 0.7–1.0 | 11 | 42 | Cy |
| P18054 | Arachidonate 12-lipoxygenase | 0.80 | 0.7–0.9 | 10 | 43 | Cy |
| Q9GZV4 | Eukaryotic translation initiation factor 5A-2 | 0.79 | 0.7–0.9 | 2 | 44 | Cy |
| P26038 | Moesin | 0.79 | 0.7–0.9 | 33 | 43 | Cy, Cs, Pm |
| P37802 | Transgelin-2 | 0.79 | 0.7–0.9 | 16 | 45 | - |
| P47756-1 | F-actin-capping protein subunit beta, isoform 1 | 0.78 | 0.7–0.9 | 2 | 38 | Cy, Pm |
| O00499-1 | Myc box-dependent-interacting protein 1, isoform IIA | 0.78 | 0.8–0.8 | 2 | 27 | Cy, Cs, N |
| P43304-1 | Glycerol-3-phosphate dehydrogenase, isoform 1 | 0.78 | 0.7–0.9 | 5 | 22 | M |
| P06733-1 | Enolase, isoform alpha | 0.77 | 0.6–1.0 | 19 | 45 | Cy, Pm, N |
| P01111 | GTPase NRas precursor | 0.76 | 0.6–0.9 | 2 | 43 | G, Pm |
| P09104 | Gamma-enolase | 0.76 | 0.7–0.8 | 5 | 44 | Cy, Pm |
| Q13418 | Integrin-linked protein kinase | 0.76 | 0.6–1.0 | 26 | 45 | Cy |
| Q86UX7-2 | Unc-112-related protein 2, isoform 2 | 0.76 | 0.6–0.9 | 38 | 45 | Cy, Cs |
| Q14568 | Heat shock protein 90 kDa alpha class A member 2 (Fragment) | 0.76 | 0.6–0.9 | 2 | 36 | - |
| Q9Y251 | Heparanase precursor | 0.75 | 0.7–0.8 | 4 | 45 | Ec, L, Pm |
| Q2QD09 | Triosephosphate isomerase (Fragment) | 0.75 | 0.6–0.9 | 8 | 45 | - |
| P34931 | Heat shock 70 kDa protein 1L | 0.75 | 0.6–0.9 | 4 | 37 | Cy |
| P60174-2 | Triosephosphate isomerase, isoform 2 | 0.74 | 0.6–0.8 | 2 | 42 | Cy |
| P21926 | CD9 antigen | 0.74 | 0.6–0.8 | 2 | 42 | Pm |
| P37840-1 | Alpha-synuclein, isoform 1 | 0.74 | 0.6–0.9 | 7 | 44 | Cy, Pm, N |
| P30040 | Endoplasmic reticulum protein ERp29 precursor | 0.73 | 0.6–0.9 | 3 | 36 | ER |
| Q15942 | Zyxin | 0.72 | 0.6–0.9 | 22 | 45 | Cy, Cs, Pm, N |
| O75830 | Serpin I2 precursor | 0.72 | 0.6–0.9 | 1 | 43 | Ec |
| P26447 | Protein S100-A4 | 0.71 | 0.6–0.8 | 6 | 45 | Cy, N |
| P30443 | HLA class I histocompatibility antigen | 0.71 | 0.6–0.9 | 1 | 33 | Cy, Pm |
| P04275 | Coagulation factor VIII VWF (von Willebrand factor) | 0.71 | 0.7–0.7 | 2 | 26 | Ec |
| P17301 | Integrin alpha-2 precursor | 0.71 | 0.6–0.8 | 8 | 27 | Pm |
| Q9NRW1 | Ras-related protein Rab-6B | 0.70 | 0.6–0.9 | 4 | 27 | G |
| P40227 | T-complex protein 1 subunit zeta | 0.70 | 0.5–0.9 | 6 | 21 | Cy |
| Q01518 | Adenylyl cyclase-associated protein | 0.70 | 0.5–1.0 | 2 | 41 | Pm |
| P21291 | Cysteine and glycine-rich protein 1 | 0.70 | 0.6–0.9 | 2 | 29 | N |
| Q8N7G1 | Similar to purine nucleoside phosphorylase | 0.70 | 0.6–0.9 | 12 | 45 | - |
| P07384 | Calpain-1 catalytic subunit | 0.69 | 0.6–0.8 | 9 | 41 | Cy, Pm |
| P48426 | Phosphatidylinositol-5-phosphate 4-kinase type-2 alpha | 0.69 | 0.5–0.9 | 4 | 43 | - |
| Q06323 | Proteasome activator complex subunit 1 | 0.68 | 0.6–0.8 | 3 | 38 | Cy |
| O43396 | Thioredoxin-like protein 1 | 0.68 | 0.6–0.8 | 1 | 35 | Cy |
| P46109 | Crk-like protein | 0.68 | 0.6–0.7 | 2 | 31 | Cy, Pm |
| P02671-1 | Fibrinogen alpha chain precursor, isoform 1 | 0.67 | 0.6–0.8 | 35 | 45 | Ec, Pm |
| Q5SQ64 | Lymphocyte antigen 6 complex locus protein G6f | 0.66 | 0.6–0.8 | 3 | 39 | Pm |
| P84077 | ADP-ribosylation factor 1 | 0.66 | 0.5–0.8 | 10 | 42 | Cy, Pm, G |
| O95810 | Serum deprivation-response protein | 0.64 | 0.5–0.8 | 17 | 45 | Cy |
| Q9NVD7-1 | Alpha-parvin, isoform 1 | 0.64 | 0.5–0.8 | 1 | 43 | Cy, Cs, Pm |
| P02679-1 | Fibrinogen precursor, isoform gamma-B | 0.63 | 0.5–0.8 | 29 | 43 | Ec, Pm |
| Q2WGJ9 | Fer-1-like 6 | 0.62 | 0.5–0.8 | 1 | 42 | Pm |
| P17987 | T-complex protein 1 subunit alpha | 0.62 | 0.5–0.8 | 4 | 26 | Cy |
| Q70J99-1 | Protein unc-13 homolog D, isoform 1 | 0.62 | 0.4–0.9 | 6 | 31 | Cy, Pm |
| P04632 | Calpain small subunit 1 | 0.62 | 0.5–0.8 | 5 | 39 | Cy, Pm |
| Q15365 | Poly(rC)-binding protein 1 | 0.61 | 0.5–0.7 | 3 | 38 | Cy, N |
| P50395 | Rab GDP dissociation inhibitor beta | 0.61 | 0.4–0.8 | 3 | 43 | Cy, Pm |
| Q9UJC5 | SH3 domain-binding glutamic acid-rich-like protein 2 | 0.58 | 0.4–0.8 | 2 | 32 | N |
| Q99733 | Nucleosome assembly protein 1-like 4 | 0.58 | 0.5–0.7 | 2 | 38 | Cy, N |
| P05106-1 | Integrin beta-3 precursor | 0.58 | 0.5–0.7 | 3 | 43 | Pm |
| O14556 | Glyceraldehyde-3-phosphate dehydrogenase | 0.58 | 0.4–0.7 | 1 | 44 | Cy |
| Q9Y490 | Talin 1 | 0.57 | 0.5–0.6 | 4 | 31 | Cy, Cs |
| P61106 | Ras-related protein Rab-14 | 0.57 | 0.4–0.8 | 4 | 22 | Cy, L, Pm, G |
| P62820-1 | Ras-related protein Rab-1A, isoform 1 | 0.56 | 0.4–0.7 | 2 | 34 | ER, G |
| Q9H4B7 | Tubulin beta-1 chain | 0.55 | 0.4–0.7 | 30 | 45 | Cs |
| P68371 | Tubulin beta-2C chain | 0.55 | 0.3–0.9 | 18 | 45 | Cs |
| P02675 | Fibrinogen beta chain precursor | 0.54 | 0.4–0.8 | 26 | 44 | Cy, Cs |
| Q92673 | Sortilin-related receptor precursor | 0.53 | 0.4–0.8 | 1 | 13 | Ec; Pm |
| Q9NY65 | Tubulin alpha-8 chain | 0.51 | 0.4–0.7 | 5 | 31 | Cs |
| P51659 | Peroxisomal multifunctional enzyme type 2 | 0.50 | 0.4–0.6 | 3 | 21 | M |
| A8MW06 | Thymosin-like 3 | 0.49 | 0.3–0.7 | 11 | 45 | Cy, Cs |
| P07996 | Thrombospondin-1 precursor | 0.48 | 0.4–0.6 | 29 | 45 | Ec |
| P07437 | Tubulin beta chain | 0.44 | 0.3–0.6 | 8 | 41 | Cy, Cs |
| P61586 | Transforming protein RhoA precursor | 0.43 | 0.4–0.5 | 4 | 32 | Cy, Cs, Pm |
| P35442 | Thrombospondin-2 precursor | 0.42 | 0.4–0.4 | 2 | 37 | Ec |
| P09486 | Secreted protein acidic and rich in cysteine precursor | 0.41 | 0.3–0.5 | 4 | 36 | Ec |
| P40197 | Platelet glycoprotein V precursor | 0.41 | 0.3–0.5 | 15 | 41 | Pm |
| P02775 | Platelet basic protein precursor | 0.40 | 0.3–0.6 | 6 | 45 | Ec |
| P10720 | Platelet factor 4 variant precursor | 0.38 | 0.4–0.4 | 2 | 45 | Ec |
| Q8N532 | TUBA1C protein | 0.37 | 0.3–0.4 | 5 | 44 | Cs |
| Q13201 | Multimerin-1 precursor | 0.36 | 0.2–0.6 | 13 | 33 | Ec |
| P68366 | Tubulin alpha-4A chain | 0.35 | 0.3–0.4 | 20 | 44 | Cs |
| P10124 | Serglycin precursor | 0.33 | 0.3–0.4 | 5 | 42 | Ec, G |
The last column shows the sub-cellular location including: Cy = cytoplasm, Cs = cytoskeleton, Ec = extracellular, ER = endoplasmic reticulum, G = golgi, L = lysosome, M = mitochondria, N = nucleus, Pm = plasma membrane, - = unknown.
Using information from UniProt and RNA array databases for the 117 proteins with altered abundance from the 5-day storage group,33–35 we identified 22 proteins that are known to be associated with platelets (Table 4). These proteins are involved in cell adhesion, blood coagulation, and platelet activation and signaling processes. Seven platelet-specific proteins have receptor activity or are associated with receptor complexes. It is noteworthy that nearly two thirds of the platelet-specific proteins identified as unique to storage time are known to be associated with the platelet alpha granule membrane. This observation supports platelet degranulation as a major factor in changes seen in stored platelets.36–39 We also observed that half of the platelet-specific proteins for the storage group localized to the extracellular compartment and 10 proteins are integral to the plasma membrane (i.e., contain one or more transmembrane domains). Three proteins (macrophage migration inhibitory factor, platelet factor 4, and platelet basic protein precursor) have chemokine, cytokine, and/or growth factor activities. One (i.e., CD9) is a platelet cell surface antigen.
Enrichment analysis
The MetaCore™ software package (GeneGO, Inc St Joseph, MS) was used to discover the gene ontology (GO) processes that were significantly enriched by platelet-related proteins (see Table 4) whose abundance is affected by either diabetes or storage for 5-days. Based on enrichment statistics, the 10 most likely GO processes associated with platelet proteins up- and down-regulated by diabetes are shown in Table 6. The first 6 are also the most likely GO processes associated with platelet proteins affected by 5 days of storage; however, the last 4 GO processes in Table 6 are not significantly enriched by proteins changed by storage. The main distinction between the enrichment analyses of the two groups of platelet proteins appears to be that proteins associated with tissue remodeling are more strongly correlated with diabetes (vs normal phenotype) than they are with the 5-day storage (vs fresh phenotype). The disease specific GO processes in Table 6 are related to abundance changes observed for extracellular matrix protein-1, integrin alpha-6, and junctional adhesion molecule A, which were not affected by storage.
Table 6.
GO processes associated with proteins differentially abundant in diabetic and stored samples.
| GO process | D/N | D5/D0 |
|---|---|---|
| Blood coagulation | yes | yes |
| Hemostasis | yes | yes |
| Response to wounding | yes | yes |
| Platelet activation | yes | yes |
| Response to Stress | yes | yes |
| Cell adhesion | yes | yes |
| Cell motility | yes | no |
| Integrin-mediated signaling | yes | no |
| Cell-matrix adhesion | yes | no |
| Cell-substrate junction assembly | yes | no |
We are aware that due to the small number of differentially abundant platelet-related proteins, biological mechanisms suggested by variations in enrichment statistics must be viewed with caution. Their greatest value will be in the formulation of new hypotheses that can be tested by additional experiments. With this in mind, we obtained and stored platelets from two additional normal and two diabetic donors to measure the levels of α2β1 integrin. This receptor is involved in platelet adhesion to collagen,40, 41 and functions in close concert with the central collagen receptor, GPVI, in the initial step of the hemostatic cascade to activate coagulant activity.42 It was previously shown that patients with type-2 diabetes have enhanced platelet surface expression of GPVI compared with non-diabetic individuals.43 Our preliminary experimental findings demonstrated that there was only a slight increase in the surface expression of α2β1 in healthy platelets over the storage period, suggesting that storage time does not significantly effect this integrin (Figure 2). In contrast, platelets from diabetics exhibited an increase in α2β1 surface expression at days 3–5 of storage. This result is interesting as our data revealed that the α2 subunit of this integrin is down-regulated in both diabetic and stored platelets (0.68 and 0.71, respectively), while the β1 subunit was up-regulated in stored platelets only (1.33). Our findings demonstrated that the changes in α2 and β1 subunit composition effected platelet from diabetics surface expression of α2β1 compared to healthy platelets, and the change in surface expression of platelets from diabetics is at a pinnacle when platelets are typically transfused to patients (3–5 days). Future transfusion and mechanistic studies will be critical in determining the biologic and clinical significance of our findings. We will use the valuable information obtained from this experiment to direct our studies.
Figure 2. Stored diabetic platelets have increased levels of the collagen binding integrin, α2β1.

Platelet samples were collected at days 0, 1, 3, and 5 and analyzed by flow cytometry to determine the levels of the α2β1 integrin. An increase in α2β1 integrin levels was apparent between days 3 and 5 of storage relative to that for similarly stored platelets from healthy non-diabetics. The data shown are representative of two normal and two diabetic donors.
To begin investigating diabetic versus storage-specific effects, we used a static measure of cell adhesion and spreading. Since our results demonstrated integrin β3 is down-regulated in the diabetes and storage groups (Tables 3 and 5), we used additional normal and diabetic donor platelets stored for 5 days (Figure 3) to look at platelet spreading on fibrinogen which requires the major platelet integrin, αIIbβ3.44 We observed that normal healthy platelets prepared for storage have a reduced capacity to spread (compared to normal washed platelets - data not shown), and although this level of spreading is not significantly reduced over time, less platelets appear to adhere to the matrix (Figure 3, compare Normal-D0 to Normal-D5). In contrast, the D0 platelets from diabetics are beginning to form aggregates (Figure 3, Diabetic-D0, arrow) and few are spread. By day 5, there was virtually no platelet spreading in the platelets from diabetics, just clusters of aggregates (Figure 3, Diabetic-D5, white squares), and like the normal platelets, adhesion appeared to be impaired. Future examination of platelet adhesion under flow conditions and using different matrixes will help to decipher the specific pathways involved in diabetic and/or storage mechanisms.
Figure 3. Normal and platelets from diabetics stored for transfusion have platelet spreading defects.

Platelets from normal and diabetic donors were stored for transfusion and allowed to spread on fibrinogen-coated coverslips (100 μg/mL) blocked with 0.5% BSA. The coverslips were fixed in 2.5% glutaraldehyde and processed for imaging by DIC (100x). Black arrows illustrate a fully spread platelet. White squares indicate platelet aggregates. Center images show magnification of spread platelets (black square) and a platelet aggregate (white square). The results are representative of two normal and two diabetic donors.
Discussion
This report describes a mass spectrometry based approach to platelet proteomics and additional investigational strategies into the role of transfusion storage, including donor glucose dysregulation (diabetes) effects on the platelet proteome. Technically, our approach enabled detection with great sensitivity of a variety of molecular species in stored and/or platelets from diabetics. However as a caution it should be remembered that our MS approach involves a bottoms-up characterization of trypsin digested proteins and that it is not a direct measurement of biological activity. Previous studies of platelet storage have employed other approaches, including sonication rather than detergent for lysing platelets, and restricting proteomic methods to those that are gel based.45 These approaches have the limitation that they cannot be employed to characterize membrane molecules. Nonetheless, it is reassuring that previously reported increased abundance of septin and actin with storage was replicated in our findings. In a more recent publication, use of mass spectrometry and detergent lysis confirmed the original description of increases in septin with storage and also described increases in superoxide dismutase, Rho-GDP dissociation inhibitor, and zyxin, as well as enzymes involved in glucose metabolism (G6PD, hexokinase).8
New findings in our study show an increase in detectable molecular species, almost doubling the number previously reported. The variety of cell membrane species showing abundance changes in our study is noteworthy (Tables 3, 4 and 5). Furthermore, the presence of altered abundance of molecular species of nuclear origin confirms our previous observation that transcription factors are present in platelets, and play previously unsuspected roles in platelet biology. Our group recently demonstrated that platelets contain and release in platelet microparticles (PMPs), the transcription factor, peroxisome proliferator-activated receptor gamma (PPARγ) and its heterodimeric partner retinoid X receptor (RXR). PPARγ ligands attenuate platelet release of pro-inflammatory and pro-coagulant mediators including soluble CD40L (sCD40L) and thromboxane A2 (TXA2), and elicit transcellular effects.46, 47 This provides evidence that transcription factors are capable of biologic activity and have important roles in platelet physiology.
Other novel findings include the first data on differences between the proteome of platelets from diabetics versus those from healthy individuals, as well as the effects of diabetes on the proteome of platelets prepared and stored for blood transfusion. Most notable is that fresh platelets from diabetic patients in otherwise good health demonstrated almost as many abundance changes as stored platelets from healthy donors (well over 100). Most of these changes are in the same direction, namely a decrease from normal abundance. However, the most striking deviations quantitatively are increases in the abundance of hemoglobin subunits. While these may represent contaminants due to sample red cell lysis during preparation, this increased abundance of hemoglobin species was seen in all platelet sample from diabetics and was not seen in the three platelet samples from non-diabetics. Consistent with our findings, globin and ferritin mRNAs have been identified as abundant transcripts in platelets by two independent groups.35, 48 While these two facts taken together imply that platelets from diabetics have increased synthesis of these proteins, further investigation will be necessary to determine whether this is true or whether they take up increased amounts of hemoglobin from plasma or internalize it from interactions with red cells in vivo.
Interestingly, platelets from diabetics had lower abundance of several adhesion molecules including a number of integrins and PECAM. Diabetic and stored platelets were both characterized by an increased abundance of an endopeptidase inhibitor and decreased abundance of fibrinogen receptors and thrombospondin. Our supporting experiments reinforced these findings as diabetic and stored platelets had impaired ability to spread on fibrinogen (Figure 3). In contrast, increased abundance has been observed for some key collagen receptors. For example, the hemostatic cascade is initiated at sites of vascular injury by exposed extracellular matrix (ECM) and collagen, a key constituent. We found that extracellular matrix protein (ECM)-1 is significantly elevated in platelets from diabetics. Interestingly, ECM1 functions in the regulation of blood vessel formation and maintenance. It has been suggested that the influence on angiogenesis exerted by ECM1 may be important in wound repair49 and diabetic retinopathy.50 Moreover, it was previously shown that expression of the collagen-binding GPVI, a major platelet receptor involved in the development of thrombosis and atherosclerosis, is elevated in diabetics.43 Excitingly, our supporting studies herein provided corroborating data showing that integrin α2β1, central for stable adhesion to collagen following GPVI activation,42, 51 has diabetic-specific effects (Figure 2).
Platelet storage over a five day period prior to transfusion, the FDA permissible duration, was characterized by some shared abundance changes with platelets from diabetics, and other unique changes in abundance. GPIX, an adhesion molecule, increased in abundance with storage, but most other receptors and adhesion molecules decreased in abundance, including GPIb, GPV, and GPIV. These findings suggest storage may decrease the functional capabilities of both diabetic and stored platelets, and impair interactions with endothelium and hemostatic molecules such as fibrinogen. These findings will need to be confirmed by techniques employing functionally viable platelets as we demonstrated here with our initial two supporting studies (Figure 2 and 3). This combined approach will assist in constructing a thorough understanding of the differences between diabetic and normal platelet physiology, and the role of storage in the “platelet storage lesion”.
Conclusion
In summary, these new findings describe a powerful new approach to assess the platelet proteome as it changes with disease and storage for transfusion. These findings delineate for the first time similarities of platelets from diabetics and after storage for transfusion that reflect altered platelet hemostatic and immunologic function. Given that diabetics have an increased risk of thrombosis, inflammatory disorders and decreased resistance to infection, the changes we describe suggest innovative mechanisms by which platelet function is altered in hyperglycemic states. It will be desirable to further investigate the suitability of diabetics as blood donors, and to evaluate their risks as transfusion recipients, given the evidence of alterations in multiple immunologic and hemostatic mediators seen even in freshly prepared platelets from diabetics. Similar to platelets from diabetics, platelets from healthy donors stored for several days also exhibit changes in abundance of multiple hemostatic and immunologic mediators. These findings are likely of clinical relevance, as platelet transfusions are associated with thrombosis, mortality52 as well as inflammation.1, 9
Acknowledgments
This work was supported by NIH grants ES01247, HL078603, HL086367 and CA117378 (RCZ). A portion of this work was performed at the W.R. Wiley Environmental Molecular Science laboratory located at Pacific Northwest National Laboratory and supported by U.S. DOE. Pacific Northwest National Laboratory is operated by Battelle Memorial Institute for the U.S. Department of Energy under contract DE-AC06-76RLO 1830.
References
- 1.Phipps RP, Kaufman J, Blumberg N. Platelet derived CD154 (CD40 ligand) and febrile responses to transfusion. Lancet. 2001;357(9273):2023–4. doi: 10.1016/s0140-6736(00)05108-4. [DOI] [PubMed] [Google Scholar]
- 2.Blumberg N, Gettings KF, Turner C, Heal JM, Phipps RP. An association of soluble CD40 ligand (CD154) with adverse reactions to platelet transfusions. Transfusion. 2006;46(10):1813–1821. doi: 10.1111/j.1537-2995.2006.00979.x. [DOI] [PubMed] [Google Scholar]
- 3.Kaufman J, Spinelli SL, Schultz E, Blumberg N, Phipps RP. Release of biologically active CD154 during collection and storage of platelet concentrates prepared for transfusion. Journal of Thrombosis and Haemostasis. 2007;5(4):788–796. doi: 10.1111/j.1538-7836.2007.02412.x. [DOI] [PubMed] [Google Scholar]
- 4.Silliman CC, McLaughlin NJD. Transfusion-related acute lung injury. Blood Reviews. 2006;20(3):139–159. doi: 10.1016/j.blre.2005.11.001. [DOI] [PubMed] [Google Scholar]
- 5.Thon JN, Devine DV. Translation of glycoprotein IIIa in stored blood platelets. Transfusion. 2007;47(12):2260–70. doi: 10.1111/j.1537-2995.2007.01455.x. [DOI] [PubMed] [Google Scholar]
- 6.Vinik AI, Erbas T, Park TS, Nolan R, Pittenger GL. Platelet dysfunction in type 2 diabetes. Diabetes Care. 2001;24(8):1476–85. doi: 10.2337/diacare.24.8.1476. [DOI] [PubMed] [Google Scholar]
- 7.Stratmann B, Tschoepe D. Pathobiology and cell interactions of platelets in diabetes. Diab Vasc Dis Res. 2005;2(1):16–23. doi: 10.3132/dvdr.2005.001. [DOI] [PubMed] [Google Scholar]
- 8.Thon JN, Schubert P, Duguay M, Serrano K, Lin S, Kast J, Devine DV. Comprehensive proteomic analysis of protein changes during platelet storage requires complementary proteomic approaches. Transfusion. 2008;48(3):425–35. doi: 10.1111/j.1537-2995.2007.01546.x. [DOI] [PubMed] [Google Scholar]
- 9.Khan SY, Kelher MR, Heal JM, Blumberg N, Boshkov LK, Phipps R, Gettings KF, McLaughlin NJ, Silliman CC. Soluble CD40 ligand accumulates in stored blood components, primes neutrophils through CD40, and is a potential cofactor in the development of transfusion-related acute lung injury. Blood. 2006;108(7):2455–62. doi: 10.1182/blood-2006-04-017251. [DOI] [PMC free article] [PubMed] [Google Scholar]
- 10.Denis MM, Tolley ND, Bunting M, Schwertz H, Jiang H, Lindemann S, Yost CC, Rubner FJ, Albertine KH, Swoboda KJ, Fratto CM, Tolley E, Kraiss LW, McIntyre TM, Zimmerman GA, Weyrich AS. Escaping the nuclear confines: signal-dependent pre-mRNA splicing in anucleate platelets. Cell. 2005;122(3):379–91. doi: 10.1016/j.cell.2005.06.015. [DOI] [PMC free article] [PubMed] [Google Scholar]
- 11.Kieffer N, Guichard J, Farcet JP, Vainchenker W, Breton-Gorius J. Biosynthesis of major platelet proteins in human blood platelets. Eur J Biochem. 1987;164(1):189–95. doi: 10.1111/j.1432-1033.1987.tb11010.x. [DOI] [PubMed] [Google Scholar]
- 12.Roth GJ, Hickey MJ, Chung DW, Hickstein DD. Circulating human blood platelets retain appreciable amounts of poly (A)+ RNA. Biochem Biophys Res Commun. 1989;160(2):705–10. doi: 10.1016/0006-291x(89)92490-x. [DOI] [PubMed] [Google Scholar]
- 13.Ts’ao CH. Rough endoplasmic reticulum and ribosomes in blood platelets. Scand J Haematol. 1971;8(2):134–40. doi: 10.1111/j.1600-0609.1971.tb01964.x. [DOI] [PubMed] [Google Scholar]
- 14.Weyrich AS, Lindemann S, Tolley ND, Kraiss LW, Dixon DA, Mahoney TM, Prescott SP, McIntyre TM, Zimmerman GA. Change in protein phenotype without a nucleus: translational control in platelets. Semin Thromb Hemost. 2004;30(4):491–8. doi: 10.1055/s-2004-833484. [DOI] [PubMed] [Google Scholar]
- 15.Garcia A, Watson SP, Dwek RA, Zitzmann N. Applying proteomics technology to platelet research. Mass Spectrometry Reviews. 2005;24(6):918–930. doi: 10.1002/mas.20047. [DOI] [PubMed] [Google Scholar]
- 16.Mirza SP, Olivier M. Methods and approaches for the comprehensive characterization and quantification of cellular proteomes using mass spectrometry. Physiological Genomics. 2008;33(1):3–11. doi: 10.1152/physiolgenomics.00292.2007. [DOI] [PMC free article] [PubMed] [Google Scholar]
- 17.Ahram M, Adkins JN, Auberry DL, Wunschel DS, Springer DL. A proteomic approach to characterize protein shedding. Proteomics. 2005;5(1):123–131. doi: 10.1002/pmic.200400912. [DOI] [PubMed] [Google Scholar]
- 18.Jacobs JM, Monroe ME, Qin WJ, Shen YF, Anderson GA, Smith RD. Ultra-sensitive, high throughput and quantitative proteomics measurements. International Journal of Mass Spectrometry. 2005;240(3):195–212. [Google Scholar]
- 19.Miller JH, Jin S, Morgan WF, Yang A, Wan Y, Aypar U, Peters JS, Springer DL. Profiling mitochondrial proteins in radiation-induced genome-unstable cell lines with persistent oxidative stress by mass spectrometry. Radiation Research. 2008;169(6):700–706. doi: 10.1667/RR1186.1. [DOI] [PubMed] [Google Scholar]
- 20.Smith RD, Anderson GA, Lipton MS, Pasa-Tolic L, Shen YF, Conrads TP, Veenstra TD, Udseth HR. An accurate mass tag strategy for quantitative and high-throughput proteome measurements. Proteomics. 2002;2(5):513–523. doi: 10.1002/1615-9861(200205)2:5<513::AID-PROT513>3.0.CO;2-W. [DOI] [PubMed] [Google Scholar]
- 21.Daly DS, Anderson KK, Panisko EA, Purvine SO, Fang R, Monroe ME, Baker SE. Mixed-effects statistical model for comparative LC-MS proteomics studies. J Proteome Res. 2008;7(3):1209–17. doi: 10.1021/pr070441i. [DOI] [PubMed] [Google Scholar]
- 22.Ahram M, Strittmatter EF, Monroe ME, Adkins JN, Hunter JC, Miller JH, Springer DL. Identification of shed proteins from Chinese hamster ovary cells: Application of statistical confidence using human and mouse protein databases. Proteomics. 2005;5(7):1815–1826. doi: 10.1002/pmic.200401072. [DOI] [PubMed] [Google Scholar]
- 23.Eng JK, Mccormack AL, Yates JR. An Approach to Correlate Tandem Mass-Spectral Data of Peptides with Amino-Acid-Sequences in a Protein Database. Journal of the American Society for Mass Spectrometry. 1994;5(11):976–989. doi: 10.1016/1044-0305(94)80016-2. [DOI] [PubMed] [Google Scholar]
- 24.Nesvizhskii AI, Keller A, Kolker E, Aebersold R. A statistical model for identifying proteins by tandem mass spectrometry. Analytical Chemistry. 2003;75(17):4646–4658. doi: 10.1021/ac0341261. [DOI] [PubMed] [Google Scholar]
- 25.Link AJ, Eng J, Schieltz DM, Carmack E, Mize GJ, Morris DR, Garvik BM, Yates JR. Direct analysis of protein complexes using mass spectrometry. Nature Biotechnology. 1999;17(7):676–682. doi: 10.1038/10890. [DOI] [PubMed] [Google Scholar]
- 26.Washburn MP, Wolters D, Yates JR. Large-scale analysis of the yeast proteome by multidimensional protein identification technology. Nature Biotechnology. 2001;19(3):242–247. doi: 10.1038/85686. [DOI] [PubMed] [Google Scholar]
- 27.Yates JR, McCormack AL, Eng J. Mining genomes with MS. Analytical Chemistry. 1996;68(17):A534–A540. doi: 10.1021/ac962050l. [DOI] [PubMed] [Google Scholar]
- 28.Norbeck AD, Monroe ME, Adkins JN, Anderson KK, Daly DS, Smith RD. The utility of accurate mass and LC elution time information in the analysis of complex proteomes. Journal of the American Society for Mass Spectrometry. 2005;16(8):1239–1249. doi: 10.1016/j.jasms.2005.05.009. [DOI] [PMC free article] [PubMed] [Google Scholar]
- 29.Petritis K, Kangas LJ, Yan B, Monroe ME, Strittmatter EF, Qian WJ, Adkins JN, Moore RJ, Xu Y, Lipton MS, Ii DGC, Smith RD. Improved peptide elution time prediction for reversed-phase liquid chromatography-MS by incorporating peptide sequence information. Analytical Chemistry. 2006;78(14):5026–5039. doi: 10.1021/ac060143p. [DOI] [PMC free article] [PubMed] [Google Scholar]
- 30.Zimmer JSD, Monroe ME, Qian WJ, Smith RD. Advances in proteomics data analysis and display using an accurate mass and time tag approach. Mass Spectrometry Reviews. 2006;25(3):450–482. doi: 10.1002/mas.20071. [DOI] [PMC free article] [PubMed] [Google Scholar]
- 31.Jin S, Daly DS, Springer DL, Miller JH. The effects of shared peptides on protein quantitation in label-free proteomics by LC/MS/MS. Journal of Proteome Research. 2008;7(1):164–169. doi: 10.1021/pr0704175. [DOI] [PubMed] [Google Scholar]
- 32.Lopez JA, Chung DW, Fujikawa K, Hagen FS, Davie EW, Roth GJ. The Alpha and Beta Chains of Human-Platelet Glycoprotein-Ib Are Both Transmembrane Proteins Containing a Leucine-Rich Amino-Acid Sequence. Proceedings of the National Academy of Sciences of the United States of America. 1988;85(7):2135–2139. doi: 10.1073/pnas.85.7.2135. [DOI] [PMC free article] [PubMed] [Google Scholar]
- 33.Bugert P, Dugrillon A, Gunaydin A, Eichler H, Kluter H. Messenger RNA profiling of human platelets by microarray hybridization. Thromb Haemost. 2003;90(4):738–48. [PubMed] [Google Scholar]
- 34.Dittrich M, Birschmann I, Pfrang J, Herterich S, Smolenski A, Walter U, Dandekar T. Analysis of SAGE data in human platelets: features of the transcriptome in an anucleate cell. Thromb Haemost. 2006;95(4):643–51. [PubMed] [Google Scholar]
- 35.Gnatenko DV, Dunn JJ, McCorkle SR, Weissmann D, Perrotta PL, Bahou WF. Transcript profiling of human platelets using microarray and serial analysis of gene expression. Blood. 2003;101(6):2285–93. doi: 10.1182/blood-2002-09-2797. [DOI] [PubMed] [Google Scholar]
- 36.Berger G, Hartwell DW, Wagner DD. P-Selectin and platelet clearance. Blood. 1998;92(11):4446–52. [PubMed] [Google Scholar]
- 37.Bode AP, Orton SM, Frye MJ, Udis BJ. Vesiculation of platelets during in vitro aging. Blood. 1991;77(4):887–95. [PubMed] [Google Scholar]
- 38.Gulliksson H. Defining the optimal storage conditions for the long-term storage of platelets. Transfus Med Rev. 2003;17(3):209–15. doi: 10.1016/s0887-7963(03)00020-8. [DOI] [PubMed] [Google Scholar]
- 39.Haubelt H, Vogt A, Hellstern P. Preservation of platelet aggregation and dense granule secretion during extended storage of blood samples in the presence of a synthetic dual inhibitor of factor Xa and thrombin. Platelets. 2008;19(7):496–501. doi: 10.1080/09537100802302225. [DOI] [PubMed] [Google Scholar]
- 40.Nieuwenhuis HK, Akkerman JW, Houdijk WP, Sixma JJ. Human blood platelets showing no response to collagen fail to express surface glycoprotein Ia. Nature. 1985;318(6045):470–2. doi: 10.1038/318470a0. [DOI] [PubMed] [Google Scholar]
- 41.Santoro SA. Identification of a 160,000 dalton platelet membrane protein that mediates the initial divalent cation-dependent adhesion of platelets to collagen. Cell. 1986;46(6):913–20. doi: 10.1016/0092-8674(86)90073-5. [DOI] [PubMed] [Google Scholar]
- 42.Nieswandt B, Watson SP. Platelet-collagen interaction: is GPVI the central receptor? Blood. 2003;102(2):449–461. doi: 10.1182/blood-2002-12-3882. [DOI] [PubMed] [Google Scholar]
- 43.Cabeza N, Li Z, Schulz C, Kremmer E, Massberg S, Bultmann A, Gawaz M. Surface expression of collagen receptor Fc receptor-gamma/glycoprotein VI is enhanced on platelets in type 2 diabetes and mediates release of CD40 ligand and activation of endothelial cells. Diabetes. 2004;53(8):2117–21. doi: 10.2337/diabetes.53.8.2117. [DOI] [PubMed] [Google Scholar]
- 44.Gogstad GO, Brosstad F, Krutnes MB, Hagen I, Solum NO. Fibrinogen-Binding Properties of the Human-Platelet Glycoprotein Iib-Iiia Complex - a Study Using Crossed-Radioimmunoelectrophoresis. Blood. 1982;60(3):663–671. [PubMed] [Google Scholar]
- 45.Thiele T, Steil L, Gebhard S, Scharf C, Hammer E, Brigulla M, Lubenow N, Clemetson KJ, Volker U, Greinacher A. Profiling of alterations in platelet proteins during storage of platelet concentrates. Transfusion. 2007;47(7):1221–33. doi: 10.1111/j.1537-2995.2007.01255.x. [DOI] [PubMed] [Google Scholar]
- 46.Akbiyik F, Ray DM, Gettings KF, Blumberg N, Francis CW, Phipps RP. Human bone marrow megakaryocytes and platelets express PPARgamma, and PPARgamma agonists blunt platelet release of CD40 ligand and thromboxanes. Blood. 2004;104(5):1361–8. doi: 10.1182/blood-2004-03-0926. [DOI] [PubMed] [Google Scholar]
- 47.Ray DM, Spinelli SL, Pollock SJ, Murant TI, O’Brien JJ, Blumberg N, Francis CW, Taubman MB, Phipps RP. Peroxisome proliferator-activated receptor gamma and retinoid X receptor transcription factors are released from activated human platelets and shed in microparticles. Thromb Haemost. 2008;99(1):86–95. doi: 10.1160/TH07-05-0328. [DOI] [PMC free article] [PubMed] [Google Scholar]
- 48.Coppinger JA, Cagney G, Toomey S, Kislinger T, Belton O, McRedmond JP, Cahill DJ, Emili A, Fitzgerald DJ, Maguire PB. Characterization of the proteins released from activated platelets leads to localization of novel platelet proteins in human atherosclerotic lesions. Blood. 2004;103(6):2096–104. doi: 10.1182/blood-2003-08-2804. [DOI] [PubMed] [Google Scholar]
- 49.Folkman J, Shing Y. Angiogenesis. J Biol Chem. 1992;267(16):10931–4. [PubMed] [Google Scholar]
- 50.Folkman J. Angiogenesis in cancer, vascular, rheumatoid and other disease. Nat Med. 1995;1(1):27–31. doi: 10.1038/nm0195-27. [DOI] [PubMed] [Google Scholar]
- 51.Nieswandt B, Brakebusch C, Bergmeier W, Schulte V, Bouvard D, Mokhtari-Nejad R, Lindhout T, Heemskerk JWM, Zirngibl H, Fassler R. Glycoprotein VI but not alpha 2 beta 1 integrin is essential for platelet interaction with collagen. Embo Journal. 2001;20(9):2120–2130. doi: 10.1093/emboj/20.9.2120. [DOI] [PMC free article] [PubMed] [Google Scholar]
- 52.Khorana AA, Francis CW, Blumberg N, Culakova E, Refaai MA, Lyman GH. Blood Transfusions, Thrombosis, and Mortality in Hospitalized Patients With Cancer. Archives of Internal Medicine. 2008;168(21):2377–2381. doi: 10.1001/archinte.168.21.2377. [DOI] [PMC free article] [PubMed] [Google Scholar]