

Abstract
Objectives: Infection of mice with the parasite Trichinella spiralis leads to small intestinal inflammation, characterized by changes in mucosal architecture and subpopulations of epithelial cells. This model has been used to explore changes in the epithelial proliferative cell population and expression of transforming growth factor‐beta (TGF‐β).
Materials and methods: Histochemical and immunohistochemical studies were undertaken in duodenal samples. Location and number of Ki‐67‐positive cells were assessed using Score and Wincrypts program. Changes in mRNA transcripts were studied by real‐time RT‐PCR.
Results: T. spiralis infection induced an increase in total number of proliferative (Ki‐67‐positive) cells per half crypt on day 2 post‐infection. Transcription of Math1, a transcription factor required for secretory cell differentiation in the intestine, was up‐regulated on days 6–18 post‐infection. At these time points, numbers of Paneth cells at the crypt base were also increased and the epithelial proliferative zone was shifted up the crypt‐villus axis. Transcription of TGF‐β isoforms within the small intestine was up‐regulated on days 6 and 12 post‐infection, but anti‐TGF‐β antibody treatment had no effect on T. spiralis‐induced changes in mucosal architecture or increase in Paneth/intermediate cells.
Conclusions: T. spiralis infection promotes an initial increase in small intestinal epithelial proliferation and subsequent cell differentiation along the secretory cell lineage. The resulting increase in numbers of Paneth cells at the crypt base causes the proliferative zone to move up the crypt‐villus axis. Further studies are required to determine the significance of an increase in the expression of TGF‐β transcripts.
Introduction
The epithelium of the small intestine is comprised of four main cell types: absorptive enterocytes, goblet cells, Paneth cells, and enteroendocrine cells, all four are derived from multipotent stem cells located in the crypt (1, 2, 3, 4). Progeny of the stem cells differentiate as they either migrate up the villus (absorptive enterocytes, goblet cells) or to the crypt base (Paneth cells). A number of factors may regulate gastrointestinal stem cell function (5, 6, 7, 8, 9). Isoforms of transforming growth factor‐beta (TGF‐β) have been shown to inhibit epithelial cell proliferation (10, 11), and to protect small intestinal clonogenic stem cells from radiation damage (12). The in vivo source of bioactive TGF‐β is likely to be myofibroblasts located in the subepithelial region (13), and proportions of isoforms of TGF‐β expressed by these cells may change in inflammatory diseases of the intestine (14). The role of TGF‐β in regulation of stem cell differentiation remains to be determined.
Recent studies have demonstrated the importance of Notch signalling in regulating function of intestinal epithelial stem cells (5, 9); it leads to transcription of Hes1 protein (15), a basic helix loop helix transcriptional repressor of pro‐differentiation genes such as Math1. Studies using knockout mice suggest that enterocytes and secretory epithelial cells (Paneth cells, goblet cells, enteroendocrine cells) are derived from separate lineages, with requirement for Math1 in development of secretory lineage (16, 17). Secretory products of Paneth and goblet cells are believed to be important in host protection against luminal microorganisms, Paneth cells produce antimicrobial peptides and proteins, including α‐defensins, lysozyme and secretory phospholipase A2 (18, 19). Goblet cells secrete mucin glycoproteins (20), which are essential for formation of the mucus layer overlying the surface of epithelial cells, which can be upregulated during immune response to (amongst other things) intestinal worms, causing the worms to be trapped in mucus and expelled from the host (21).
In mice infected with the parasitic nematode Trichinella spiralis, increase in Paneth, goblet, intermediate and enteroendocrine cell numbers occurs in the small intestinal mucosa, with associated alterations in villus and crypt morphology (22, 23, 24, 25, 26). Mucosal changes and parasite expulsion are regulated by T cells. A Th2 type response in which IL‐13 is thought to play a critical role, has been shown to be required for worm expulsion (27). Furthermore, requirement for IL‐4Rα, a receptor subunit common to IL‐4 and IL‐13 signal transduction, on both bone marrow‐ and non‐bone marrow‐derived cells, has been found to be necessary for worm expulsion (28). The outcome of these events is that an array of potent effectors is released into the lumen and recent work has focused on the complexity of epithelia‐derived molecules responsible for worm loss. These include goblet cell lectin intellectin‐2 (29) and goblet cell protein RELMβ/FIZZ2 (30).
In order to further investigate mechanisms involved in regulating epithelial cell changes during parasite infection, we have investigated alterations in epithelial proliferative zone of the small intestinal crypt and expression of Math1 and isoforms of TGF‐β at different stages of T. spiralis infection. The effect of neutralization of TGF‐β on T. spiralis‐induced alterations in mucosal morphology and Paneth cell numbers was also studied.
Materials and methods
Animals
Age‐matched female BALB/c inbred mice (Harlan UK Ltd, Oxford, UK) were maintained in a conventional animal house with 12‐h light cycle (lights on between 7:00 am and 7:00 pm); animals were fed standard chow and water, ad libitum. T. spiralis was maintained and recovered from BALB/c hosts as described previously (31). All experiments were conducted under the Regulation of Animals (Scientific Procedures) Act, 1986.
Mice (9–11 weeks old) were administered 300 T. spiralis infective larvae in 0.2% agar by oral gavage. On days 2, 6, 8, 18 and 27 post‐infection, animals (n = 5 per time point) were killed and adjacent samples collected from the duodenum for histological and transcript expression studies. Duodenum was chosen as the focus of our research as this region of the small intestine showed the greatest response of mucosa, as measured by proportional increase in Paneth cells (25). The remaining intestine (jejunum and ileum) was opened longitudinally and incubated in Hank's balanced salt solution (containing calcium) at 37 °C for 2 h, prior to worm burden assessment. Samples collected from uninfected BALB/c mice, on days 0 and 27 (n = 6 per time point) acted as experimental controls.
Additionally, some T. spiralis‐infected mice were also treated with a pan‐isoform‐specific neutralizing antibody (1D11.16.8) to TGF‐β (32, 33), or an irrelevant control antibody (polyclonal mouse immunoglobulin G, endotoxin low; Serotec, Oxford, UK). Both antibody treatment groups received 2 mg antibody (in phosphate‐buffered saline) intraperitoneally 24 h before and 7, 14, and 21 days post‐T. spiralis infection. Anti‐TGF‐β antibody was purified from culture supernatant samples of 1D11.16.8 hybridoma (obtained from American Type Culture Collection). Endotoxin level of purified anti‐TGF‐β antibody was assessed by Limulus amebocyte lysate chromogenic assay (QCL‐1000®, Cambrex Bio Science, East Rutherford, NJ, USA) and was less than 1.5 units/ml endotoxin.
Histochemistry and immunohistochemistry
Duodenal samples fixed in 10% buffered formalin, were used for histochemistry and immunohistochemistry. Paneth and intermediate cells, identified by phloxine–tartrazine staining (25), were enumerated in 10 crypt‐villus units per section. Mucosal architecture was assessed in sections stained with haematoxylin and eosin. Crypt depth and villus height were measured in 10 well‐orientated crypt‐villus units per section using a microscope objective lens graticule. Immunohistochemical studies were carried out using antibody to Ki‐67 (Dako Cytomation Ltd, Cambridge, UK), as previously described (25).
Location and number of Ki‐67‐positive cells was assessed using the Score and Wincrypts program (8, 34), in 50 half crypts per section. Cells were assigned a position along the crypt‐villus axis (cell number increasing sequentially up the crypt‐villus axis with cell 1 at the centre of the base of the crypt), and were identified as either Ki‐67 positive or negative. The Wincrypts program produced profiles of Ki‐67 labelling index (LI; percentage of cells which were Ki‐67 positive at a particular cell position) for each experimental group, in addition to calculating mean number of positive cells per half crypt per group. Data are reported per half crypt, as expressed by the Wincrypts program. Cell positions where the Ki‐67 labelling index was significantly different between uninfected controls and post‐infection time points were identified using extension of the median test on successive groups (a function of the Wincrypt program), with P ≤ 0.001 at identified cell positions (35). Statistical significance between mean number of Ki‐67‐positive cells per group was assessed by analysis of variance (anova) and then by Student's unpaired T‐test.
Real‐time reverse transcriptase–polymerase chain reaction (RT‐PCR)
RNA was extracted from duodenal samples (RNeasy Plus Mini Kit, Qiagen Ltd) and reverse transcribed (QuantiTect Reverse Transcription kit, Qiagen Ltd, QIAGEN House, Fleming Way, Crawley, West Sussex, RH10 9NQ, UK). Primer sequences for PCR amplification are shown in Table 1. Real‐time RT‐PCR studies used the SYBR green method (QuantiTect SYBR green kit, Qiagen Ltd) and primer dilutions between 200–1000 nm were utilized. Relative quantification of each of the transcripts of interest was deduced by comparing Ct value of each sample to mean Ct value of the uninfected group (N = 12), normalizing to housekeeping gene HPRT (Ct values which did not change with infection; data not shown), as described (36). Data are presented as a ‘fold change’ in expression of transcript in T. spiralis‐infected samples, compared to uninfected group mean.
Table 1.
Primer sequences for real‐time RT‐PCR studies
| Gene | Primer | Primer sequence | Product length |
|---|---|---|---|
| HPRT | Forward | TCC TCC TCA GAC CGC TTT T | 92 bp |
| Reverse | AAC CTG GTT CAT CAT CGC TAA | ||
| Math1 | Forward | AGA GAC CTT CCC GTC TAC CC | 81 bp |
| Reverse | CTG CAA AGT GGG AGT CAG C | ||
| TGF‐β1 | Forward | GCA ACA TGT GGA ACT CTA CCA G | 94 bp |
| Reverse | CAG CCA CTC AGG CGT ATC A | ||
| TGF‐β2 | Forward | TCC TAC AGA CTG GAG TCA CAA CA | 93 bp |
| Reverse | GCA GCA ATT ATC CTG CAC ATT | ||
| TGF‐β3 | Forward | ACA ACC CAC ACC TGA TCC TC | 126 bp |
| Reverse | AGC AGT TCT CCT CCA GGT TG |
Statistical analysis
Data on morphological changes and cell numbers were analysed by anova and Student's T‐test. Real time RT‐PCR data were analysed by Kruskal–Wallis and Mann–Whitney U‐tests. Data are expressed as mean (± standard error of the mean).
Results
Worm burden
Worms were observed in jejunum and ileum at day 2 post‐infection, with maximal worm burden seen at day 6 post‐infection (80 ± 18.4). Clearance of worms was indicated by decline of parasite numbers at day 12 post‐infection (24.4 ± 9.40), with full clearance of parasitic burden by day 18 post‐infection.
Alterations in mucosal morphology
Trichinella spiralis infection was accompanied by transient villus atrophy and crypt hyperplasia (Fig. 1). Compared to uninfected controls (459.15 ± 26.62 µm) there was significant reduction in villus height on days 6 (240.1 ± 30.59 µm; P < 0.001) and 12 post‐infection (272.6 ± 30.99 µm; P < 0.001). Significant (P < 0.05) increases in crypt depth were seen from day 2 post‐infection onwards but were maximal on days 6 (241.8 ± 25.23 µm; P < 0.001) and 12 post‐infection (260.0 ± 30.01 µm; P < 0.001), when crypt depth had more than doubled compared to controls (95.8 ± 7.76 µm).
Figure 1.

Changes in duodenal mucosal morphology. Sections of duodenal samples from the following groups of mice were studied: uninfected controls ( ), Trichinella spiralis‐infected antibody untreated (
 ), T. spiralis‐infected anti‐transforming growth factor‐beta (TGF‐β) antibody treated (
 ), and T. spiralis‐infected control antibody treated (
 ). At various time points after T. spiralis infection, duodenal sections were stained with haematoxylin and eosin and villus height (above Y = 0) and crypt depth (below Y = 0) were measured in 10 appropriately orientated crypt‐villus profiles per sample, using a graticule. Mean (± standard error of the mean) values are shown. Measurements with statistically significant difference from uninfected controls are shown: #
P = 0.05–0.001 and *P < 0.001.
). At various time points after T. spiralis infection, duodenal sections were stained with haematoxylin and eosin and villus height (above Y = 0) and crypt depth (below Y = 0) were measured in 10 appropriately orientated crypt‐villus profiles per sample, using a graticule. Mean (± standard error of the mean) values are shown. Measurements with statistically significant difference from uninfected controls are shown: #
P = 0.05–0.001 and *P < 0.001.
Numbers of Paneth and intermediate cells
Increase in number of Paneth and intermediate cells (phloxine tartrazine positive, 2, 3) was statistically significant from day 6 onwards. This increase was maximal on day 12 post‐infection (139.2 ± 12.4 cells per 10 crypt‐villus units vs. uninfected controls 40.0 ± 3.42; P < 0.0001). This response was transient as can be seen by decrease in numbers of Paneth and intermediate cells over subsequent time points (Fig. 3).
Figure 2.

Phloxine tartrazine staining of the duodenal mucosa. Sections of duodenal samples collected from (a) uninfected control and (b) Trichinella spiralis‐infected (day 12 post‐infection) mice were stained with phloxine tartrazine. Greater number of Paneth cells are seen at the crypt base in T. spiralis‐infected duodenal mucosa (b; arrows), which also contains intermediate cells, located along the villus (arrowheads).
Figure 3.
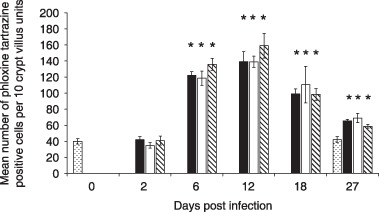
Paneth and intermediate cell numbers increase following Trichinella spiralis infection. Sections of the duodenal mucosa were stained with phloxine tartrazine to identify Paneth and intermediate cells. Phloxine tartrazine‐positive cells were enumerated in 10 crypt villus units per section in the following groups of mice: uninfected controls (), T. spiralis‐infected antibody untreated (), T. spiralis‐infected anti‐transforming growth factor‐beta (TGF‐β) antibody treated (), and T. spiralis‐infected control antibody treated () *P < 0.01.
Epithelial cell proliferation
The proliferative zone in epithelial crypts was determined using Ki‐67 immunolabelling (4, 5, 6), which identifies cells in part of G1, S, G2 and M phases of the cell cycle. Proliferative intestinal epithelial cells were seen in the crypts. On day 2 post‐infection crypts showed a statistically significant increase in number of Ki‐67‐positive cells (mean number of cells/half crypt: 19.47 ± 0.94 vs. 16.95 ± 0.51; P = 0.0227; Fig. 4). On days 6, 12 and 18 post‐infection, numbers of crypt proliferative cells did not differ when compared to uninfected controls. However, at day 27 post‐infection there was significant reduction in the number of Ki‐67‐positive crypt cells, compared to uninfected controls (14.60 ± 0.60 vs. 16.95 ± 0.51; P = 0.018).
Figure 4.

Proliferative epithelial cells in Trichinella spiralis‐infected mice. Proliferative cells were identified by Ki‐67 immunohistochemistry in duodenal mucosal sections of mice orally infected with T. spiralis. Pooled data from uninfected control sections were from duodenal samples collected on days 0 and 27. Ki‐67‐positive cells within 50 half crypts per section were counted. Data points in the figure represent the mean number of positive cells per half crypt section per mouse (as derived from the Wincrypts program) and the horizontal bar is the mean for each group of mice.
Figure 5.

Ki‐67 labelling in duodenal crypts. Ki‐67 immunohistochemistry was undertaken on (a) uninfected and (b) day 12 Trichinella spiralis‐infected sections of duodenal mucosa. Many epithelial cells in the crypt are immunoreactive for Ki‐67 (brown nuclei), but differentiated cells, i.e. Paneth cells (P), goblet cells (G) and enterocytes (E), are Ki‐67 negative (blue nuclei). Compared to uninfected control section, the proliferative zone (PZ) can be seen to shift up the crypt‐villus axis in the section from T. spiralis‐infected duodenum.
Figure 6.
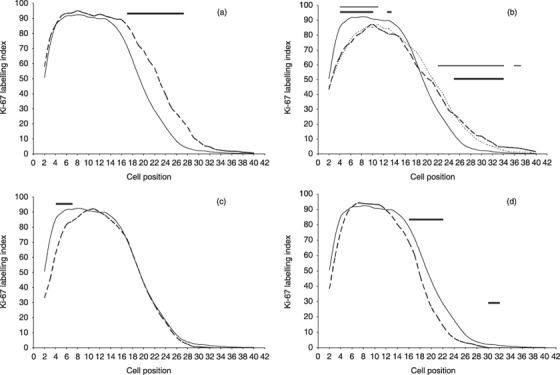
Position of Ki‐67‐positive cells following Trichinella spiralis infection. The location of the proliferative zone in T. spiralis‐infected (n = 5 per time point) and uninfected animals (n = 12) was identified by Ki‐67 labelling of duodenal sections. The frequency of Ki‐67‐positive cells at each cell position was determined using the Score and Wincrypts program. For positional data, 40–50 half‐crypts per mouse were examined, i.e. 536 half crypts analysed in the uninfected control group and 200–250 half crypts per post‐infected group. The Ki‐67 labelling index (LI) indicates the percentage of cells that are Ki‐67‐positive at each cell position normalized to the number of crypts scored. The graphs show the labelling index of the uninfected controls (solid line) compared to each of the time points post‐infection (a) day 2, (b) days 6 (long dash) and 12 (short dash), (c) day 18, and (d) day 27. Where the labelling index was significantly different from uninfected controls, this has been indicated using a horizontal bar over the relevant cell positions, in graph B thick bars and thin bars indicate statistically significant difference (P ≤ 0.001) between days 6 and 12 compared to the controls, respectively. Compared to uninfected controls, there is an increase in the size of the proliferative zone at day 2, as seen by the higher labelling index over more cell positions (6a). When compared with uninfected controls and day 2 post‐infection, the proliferative zone was shifted upward on days 6 and 12 post‐infection, as indicated by the > 85% probability (LI > 85) boundary beginning at position 9, compared to position 4 in the day 2 post‐infection samples (6b). At day 27 post‐infection (6d), the proliferative zone has moved closer to that seen in uninfected controls, except that it is narrower and is consistent with a decrease in the total number of Ki‐67‐positive cells as seen in Fig. 4.
Epithelial cell proliferative zone
On day 2 there was an increase in total number of Ki‐67‐positive cells per crypt (Fig. 4) due to expansion of late transient cell population (Fig. 6a) (3). There was a statistically significant difference in cell position distribution, over cell positions 17–28. This was exemplified by a shift in half‐peak values from cell position 20 to cell position 23. There was no detectable change in putative stem cell positions (cell positions 4–6).
On days 6 and 12 (Fig. 6b), distributions were very similar and differed from control and day 2 curves by reduction back to control levels, over cell positions 14–20, and statistically significant dampening in proliferation in putative stem cell and early transient regions (cell positions 4–10). However, this was at a time when the Paneth cell compartment had expanded (see Fig. 3). On day 18 (Fig. 6c), most cell positional distribution was the same as that for controls, with the exception of a statistically significant reduction in proliferation over cell positions 4–7 (the putative stem cell region). By day 27, curves were almost back to control levels with slight (but significant) reduction in proliferation in upper transient regions of the crypt (cell positions 16–22).
Expression of TGF‐β transcripts
Alterations in expression of all three isoforms of TGF‐β were seen following infection with T. spiralis (Fig. 7). Compared to uninfected controls, expression of TGF‐β1 and TGF‐β3 transcripts increased significantly on days 6 and 12 post‐infection, but was maximal on day 6 post‐infection (fold increase compared to uninfected controls: TGF‐β1, 2.37 ± 0.13, P < 0.001; TGF‐β3, 1.57 ± 0.21, P < 0.05). TGF‐β2 mRNA levels were significantly raised at day 12 post‐infection (fold increase compared to uninfected controls: 1.64 ± 0.19; P < 0.05).
Figure 7.

Expression of transforming growth factor‐beta (TGF‐β) and Math1 transcripts. Following real‐time RT‐PCR, Ct values for duodenal expression of TGF‐β1, ‐β2 and β3 and Math‐1 transcripts were normalized to the housekeeping gene (HPRT). Data for Trichinella spiralis‐infected samples are expressed as fold change compared to mean expression in the uninfected control group (n = 12). Mean (± standard error of the mean) values per time point (n = 5) are shown, *P < 0.05. Bars indicate , TGF‐β1; , TGF‐β2; , TGF‐β3; and , Math‐1.
Expression of Math1 transcripts
Math1 mRNA expression was also higher after T. spiralis infection (Fig. 7), and was maximal on day 6 post‐infection when transcript levels were more than double those found in uninfected control groups (fold increase compared to uninfected controls: 2.21 ± 0.17 fold, P < 0.001). Math1 expression declined over subsequent time points, but remained significantly higher than the uninfected control group on days 12 (1.84 ± 0.10 fold; P < 0.001) and 18 post‐infection (1.36 ± 0.06 fold; P = 0.003).
Effect of neutralizing antibody to TGF‐β
A pan‐isoform‐specific antibody was used to neutralize TGF‐β activity, starting 24 h prior to infection and 7, 14 and 21 days following infection with T. spiralis. Biological activity of anti‐TGF‐β antibody was confirmed using the Mv1Lu proliferation assay (data not shown). A group of control mice was treated with control mouse immunoglobulin G. Duodenal sections were processed as for T. spiralis‐infected, antibody untreated mice (see above), to study changes in crypt depth, villus height and Paneth cell number. Treatment with anti‐TGF‐β did not make any significant difference to changes in villus height or crypt depth induced by T. spiralis infection (Fig. 1). Thus, villus atrophy occurred in T. spiralis‐infected anti‐TGF‐β antibody treated mice and was most prominent on days 6 (255.6 ± 29.96 µm) and 12 (319.5 ± 37.88 µm) post‐infection (which was significantly different from uninfected controls, P < 0.001), similar to that seen in T. spiralis‐infected antibody untreated and T. spiralis‐infected control antibody‐treated groups. Degree of T. spiralis‐induced crypt hyperplasia was also unaffected by treatment with anti‐TGF‐β antibody or control antibody (Fig. 1).
Paneth and intermediate cell numbers were also assessed in antibody‐treated groups of mice. Figure 3 shows number of Paneth and intermediate cells increased in duodenum of mice treated with anti‐TGF‐β antibody. Maximum numbers of Paneth and intermediate cells were observed on day 12 post‐infection (139.0 ± 6.91 cells/10 crypt villus units) as was found in T. spiralis infected, antibody untreated group (139.2 ± 12.40). These changes were significantly different from uninfected controls (P < 0.0001). Resolution of Paneth and intermediate cell hyperplasia was unaffected by anti‐TGF‐β antibody treatment, as similar numbers of these cells where found at day 27 post‐infection in antibody treated (65.6 ± 1.78) and untreated (69.0 ± 5.87) animals. Control antibody treatment also did not have any significant effect on changes in Paneth and intermediate cell numbers following T. spiralis infection.
Discussion
Trichinella spiralis infection in these Balb/c mice induced increase in total number of proliferating cells (Ki‐67‐positive) within the epithelial crypts at day 2 post‐infection and overall increase in length of the proliferative zone. This was indicated by increase in number of cell positions within the 90th percentile (LI > 90) on day 2 post‐infection (cell positions 5–14) compared to uninfected controls (cell positions 6–11). This increase in number of proliferative cells was also reflected by onset of crypt hyperplasia (Fig. 1). However, no change in number of Paneth cells was seen at this stage (Fig. 3). It is speculated that following immune recognition of parasitic worm burden, stem cells and/or their transient daughter cells were stimulated to divide more rapidly. This could perform two potential functions: first, it may enable increase in rate of cell migration along the crypt‐villus axis and, second, it may facilitate production of a greater number of secretory progenitor cells. In the mouse model of colonic inflammation induced by the parasite Trichuris muris it has been shown that increase in epithelial cell proliferation and turnover during early infection, within a resistant strain, facilitates displacement of the parasite from its inter‐epithelial cell niche (37, 38). Increase in epithelial cell proliferation observed in T. spiralis‐infected mice may suggest a common mechanism aiding expulsion of parasites from the epithelial layer.
Days 6 to 12 showed prominent crypt hyperplasia and villous atrophy. During this time there was also pronounced increase in number of Paneth and intermediate cells. Such epithelial changes have also been seen in other mouse strains infected with T. spiralis, such as NIH and C57BL6/129 (23, 25). On days 6–12 post‐infection, total number of Ki‐67‐positive cells per half crypt was less than that observed at day 2, and was similar to uninfected controls, suggesting either decline in rate of proliferation within the crypt, or perhaps increase in rate of cell differentiation. During days 6–12 there was also a shift in location of Ki‐67‐positive proliferative cell population (LI > 70) up the crypt‐villus axis (Fig. 6), this was likely to have been due to increase in the number of Ki‐67‐negative Paneth cells at the crypt base (approximately 6–7 per half crypt) compared to controls (approximately two Paneth cells per half crypt, Fig. 3).
Math1 transcript expression was elevated over days 6 and 12 post‐infection period. Yang et al. (17) have proposed that Paneth and goblet cells are derived from a common precursor which is Math1 positive but that enterocytes are derived from a Math1‐negative precursor (17). Thus, suggesting that more of the transient cell population are stimulated to express Math1 leading to increase in secretory precursors and, therefore, more terminally differentiated Paneth/intermediate and goblet cells at the expense of Math1‐negative enterocyte precursors. Potentially fewer enterocytes could lead to reduction in villus length, while crypt length increased because of greater numbers of Paneth cells (Paneth cells migrate to the base of the crypt). Expression of Math1 is repressed by Notch signalling‐induced Hes1, thus increase in Math1 precursors is suggestive of decrease in Hes1 and Notch signalling (16). Indeed in newborn Hes1 knockout mice, cells with Paneth cell characteristics have been shown to be present within the intestine, whereas wild‐type mice are negative for this cell type at this early stage of development (39). Other factors might also be important in promotion of secretory cell hyperplasia. For example, Wnt signalling induced expression of transcription factor Sox9, has been shown to be critical for Paneth cell differentiation (and also important in goblet cell production). Furthermore, Sox9 has also been proposed to be involved in homeostasis of stem cell proliferation (40).
Labelling index over the proliferative zone during days 6–12 was lower than that found in crypts of uninfected controls or day 2 post‐infection samples. This indicates greater number of terminally differentiated cells within the crypt. Potentially this could lead to upregulation of antimicrobial protection within the crypt (through secretory products of Paneth, goblet and intermediate cells) during peak inflammation when the mucosa may be more susceptible to infiltration by luminal organisms.
Shift in location of the proliferative zone was maintained at day 18 post‐infection since Paneth cell population was still significantly greater than that found in uninfected controls. Although fewer terminally differentiated cells now resided in the crypt, resulting in increased labelling index over the proliferative zone. At day 27 post‐infection the proliferative zone had similar location to that in uninfected controls, although it was slightly shorter than that of controls, containing significantly fewer Ki‐67‐positive cells. This could indicate that at this stage of infection, antiproliferative signals had been activated, following clearance of parasites from the lumen, leading eventually to restoration of normal rate of proliferation within the mucosa.
Increased epithelial cell proliferation stimulated in response to T. spiralis infection (day 2) could be the result of increased cell division by ancestral stem cells leading to greater pool of transient amplifying daughter cells, or alternatively stem cell division may be unaffected and the larger Ki‐67‐positive population may result from increased proliferation of transient amplifying cells. Yet another possibility is that rate of differentiation could be down regulated at day 2 leading to greater Ki‐67 positive population. It has been previously shown by Ishikawa et al. (41) that there is a non‐antigen‐specific Th1 type response early during T. spiralis infection (day 2), possibly indicating involvement of the adaptive immune response in proliferative change. Later, there is a switch (achieved by day 4) to Th2 type response which is antigen specific, potentially indicating that differentiation (production of more Math1‐positive secretory precursors) can be regulated by Th2 cells/cytokines (41).
TGF‐β transcripts were shown to be up‐regulated in an isoform‐specific manner. Expression of TGF‐β1 and TGF‐β3 was higher on days 6 and 12, whereas TGF‐β2 showed increased expression only on day 12 post‐infection. During this period, Ki‐67 labelling per crypt was shown to decrease compared to day 2 post‐infection. Since TGF‐β has previously been shown to have an inhibitory effect on epithelial cell proliferation (12, 13), this might suggest that TGF‐β was responsible for this decline in number of proliferative cells. It has been demonstrated that TGF‐β‐induced decline in proliferation is due to an inhibition through G1 phase of the cell cycle, possibly the result of induction of cyclin‐dependent kinase inhibitors, as suggested within Mv1Lu cells (lung epithelial cell line) (42, 43, 44). Although TGF‐β is known to be regulated post‐translationally by its association with latency associated peptide (LAP), it has been proposed that TGF‐β may be activated by αvβ6 integrin expressed by intestinal epithelial cells (45) suggesting that local activation within the vicinity of proliferative cells is possible. Intestinal myofibroblasts have also been shown to secrete bioactive isoforms of TGF‐β (14). These cells, which lie underneath the epithelial layer (13, 46), might therefore be the source of TGF‐β within this system.
Treatment with the pan‐isoform‐specific anti‐TGF‐β antibody had no effect on the intensity or duration of Paneth and intermediate cell hyperplasia (Fig. 3) or on the development of villus atrophy and crypt hyperplasia (Fig. 1). This indicates that either TGF‐β signalling is nonessential for the induction or resolution of these particular responses post‐infection, or that TGF‐β is involved but that in its absence other cytokines/signalling pathways are able to compensate.
In summary, T. spiralis infection was found to induce early increase in total number of proliferative cells within the duodenal crypt; this preceded the increase in number of secretory cells. Increase in Math1 transcript expression suggests more secretory transient cell precursors are generated during the period of intestinal inflammation (days 6–18 post‐infection) at the expense of enterocyte precursors. Increased numbers of Paneth cells at the crypt base causes the proliferative zone to shift up the crypt‐villus axis, which could include a movement of the ancestral stem cells. TGF‐β transcripts were increased on days 6 and 12 post‐infection, which could indicate a mechanism for decreasing rate of proliferation following its stimulation at day 2 post‐infection As anti‐TGF‐β antibody treatment had no effect on development of Paneth cell hyperplasia or mucosal morphology it is suggested that TGF‐β signalling is not essential for these aspects of the mucosal response.
Acknowledgement
This study was supported by Medical Research Council (UK).
References
- 1. Bjerknes M, Cheng H (2005) Gastrointestinal stem cells. II. Intestinal stem cells. Am. J. Physiol. Gastrointest. Liver Physiol. 289, G381–G387. [DOI] [PubMed] [Google Scholar]
- 2. Cheng H, Leblond CP (1974) Origin, differentiation and renewal of the four main epithelial cell types in the mouse small intestine. V. Unitarian theory of the origin of the four epithelial cell types. Am. J. Anat. 141, 537–561. [DOI] [PubMed] [Google Scholar]
- 3. Potten CS (1998) Stem cells in gastrointestinal epithelium: numbers, characteristics and death. Philos. Trans. R. Soc. Lond. B. Biol. Sci. 353, 821–830. [DOI] [PMC free article] [PubMed] [Google Scholar]
- 4. Potten CS, Wilson JW (2006) The development of epethelial stem cell concepts In: Thomas ED, Melton D, West M, Hogan B, Gearheart JP, Pedersen RA. et al , eds. Essentials of Stem Cell Biology. London: Elsevier, pp. 11–21. [Google Scholar]
- 5. Fre S, Huyghe M, Mourikis P, Robine S, Louvard D, Artavanis‐Tsakonas S (2005) Notch signals control the fate of immature progenitor cells in the intestine. Nature 435, 964–968. [DOI] [PubMed] [Google Scholar]
- 6. Korinek V, Barker N, Moerer P, Van Donselaar E, Huls G, Peters PJ et al (1998) Depletion of epithelial stem‐cell compartments in the small intestine of mice lacking Tcf‐4. Nat. Genet. 19, 379–383. [DOI] [PubMed] [Google Scholar]
- 7. Pinto D, Gregorieff A, Begthel H, Clevers H (2003) Canonical Wnt signals are essential for homeostasis of the intestinal epithelium. Genes Dev. 17, 1709–1713. [DOI] [PMC free article] [PubMed] [Google Scholar]
- 8. Potten CS, O'Shea JA, Farrell CL, Rex K, Booth C (2001) The effects of repeated doses of keratinocyte growth factor on cell proliferation in the cellular hierarchy of the crypts of the murine small intestine. Cell Growth Differ. 12, 265–275. [PubMed] [Google Scholar]
- 9. Van Es JH, Van Gijn ME, Riccio O, Van Den Born M, Vooijs M, Begthel H et al (2005) Notch/γ‐secretase inhibition turns proliferative cells in intestinal crypts and adenomas into goblet cells. Nature 435, 959–963. [DOI] [PubMed] [Google Scholar]
- 10. Barnard JA, Beauchamp RD, Coffey RJ, Moses HL (1989) Regulation of intestinal epithelial cell growth by transforming growth factor type beta. Proc. Natl. Acad. Sci. USA 86, 1578–1582. [DOI] [PMC free article] [PubMed] [Google Scholar]
- 11. Kurokowa M, Lynch K, Podolsky DK (1987) Effects of growth factors on an intestinal epithelial cell line: transforming growth factor beta inhibits proliferation and stimulates differentiation. Biochem. Biophys. Res. Commun. 142, 775–782. [DOI] [PubMed] [Google Scholar]
- 12. Booth D, Haley JD, Bruskin AM, Potten CS (2000) Transforming growth factor‐B3 protects murine small intestinal crypt stem cells and animal survival after irradiation, possibly by reducing stem‐cell cycling. Int. J. Cancer 86, 53–59. [DOI] [PubMed] [Google Scholar]
- 13. McKaig BC, Makh SS, Hawkey CJ, Podolsky DK, Mahida YR (1999) Normal human colonic subepithelial myofibroblasts enhance epithelial migration (restitution) via TGF‐β3. Am. J. Physiol. 276, G1087–G1093. [DOI] [PubMed] [Google Scholar]
- 14. McKaig BC, Hughes K, Tighe PJ, Mahida YR (2002) Differential expression of TGF‐β isoforms by normal and inflammatory bowel disease intestinal myofibroblasts. Am. J. Physiol. Cell Physiol. 282, C172–C182. [DOI] [PubMed] [Google Scholar]
- 15. Jarriault S, Le Bail O, Hirsinger E, Pourquie O, Logeat F, Strong CF et al (1998) Delta‐1 activation of notch‐1 signaling results in HES‐1 transactivation. Mol. Cell. Biol. 18, 7423–7431. [DOI] [PMC free article] [PubMed] [Google Scholar]
- 16. Jensen J, Pedersen EE, Galante P, Hald J, Heller RS, Ishibashi M et al (2000) Control of endodermal endocrine development by Hes‐1. Nat. Genet. 24, 36–44. [DOI] [PubMed] [Google Scholar]
- 17. Yang Q, Bermingham NA, Finegold MJ, Zoghbi HY (2001) Requirement of Math1 for secretory cell lineage commitment in the mouse intestine. Science 294, 2155–2158. [DOI] [PubMed] [Google Scholar]
- 18. Cunliffe RN, Mahida YR (2004) Expression and regulation of antimicrobial peptides in the gastrointestinal tract. J. Leukoc. Biol. 75, 49–58. [DOI] [PubMed] [Google Scholar]
- 19. Ouellette AJ, Bevins CL (2001) Paneth cell defensins and innate immunity of the small bowel. Inflamm. Bowel. Dis. 7, 43–50. [DOI] [PubMed] [Google Scholar]
- 20. Lamont JT (1992) Mucus: the front line of intestinal mucosal defense. Ann. N. Y. Acad. Sci. 664, 190–201. [DOI] [PubMed] [Google Scholar]
- 21. Miller HR, Huntley JF, Wallace GR (1981) Immune exclusion and mucus trapping during the rapid expulsion of Nippostrongylus brasiliensis from primed rats. Immunology 44, 419–429. [PMC free article] [PubMed] [Google Scholar]
- 22. Ferguson A, Jarrett EE (1975) Hypersensitivity reactions in small intestine. I Thymus dependence of experimental ‘partial villous atrophy’. Gut 16, 114–117. [DOI] [PMC free article] [PubMed] [Google Scholar]
- 23. Garside P, Grencis RK, Mowat AM (1992) T lymphocyte dependent enteropathy in murine Trichinella spiralis infection. Parasite. Immunol. 14, 217–225. [DOI] [PubMed] [Google Scholar]
- 24. Ishikawa N, Wakelin D, Mahida YR (1997) Role of T helper 2 cells in intestinal goblet cell hyperplasia in mice infected with Trichinella spiralis . Gastroenterology 113, 542–549. [DOI] [PubMed] [Google Scholar]
- 25. Kamal M, Wakelin D, Ouellette AJ, Smith A, Podolsky DK, Mahida YR (2001) Mucosal T cells regulate Paneth and intermediate cell numbers in the small intestine of T. spiralis‐infected mice. Clin. Exp. Immunol. 126, 117–125. [DOI] [PMC free article] [PubMed] [Google Scholar]
- 26. Wheatcroft J, Wakelin D, Smith A, Mahoney CR, Mawe G, Spiller R (2005) Enterochromaffin cell hyperplasia and decreased serotonin transporter in a mouse model of postinfectious bowel dysfunction. Neurogastroenterol. Motil. 17, 863–870. [DOI] [PubMed] [Google Scholar]
- 27. McDermott JR, Humphreys NE, Forman SP, Donaldson DD, Grencis RK (2005) Intraepithelial NK cell‐derived IL‐13 induces intestinal pathology associated with nematode infection. J. Immunol. 175, 3207–3213. [DOI] [PubMed] [Google Scholar]
- 28. Urban JF Jr, Noben‐Trauth N, Schopf L, Madden KB, Finkelman FD (2001) Cutting edge: IL‐4 receptor expression by non‐bone marrow‐derived cells is required to expel gastrointestinal nematode parasites. J. Immunol. 167, 6078–6081. [DOI] [PubMed] [Google Scholar]
- 29. Pemberton AD, Knight PA, Gamble J, Colledge WH, Lee JK, Pierce M et al (2004) Innate BALB/c enteric epithelial responses to Trichinella spiralis: inducible expression of a novel goblet cell lectin, intelectin‐2, and its natural deletion in C57BL/10 mice. J. Immunol. 173, 1894–1901. [DOI] [PubMed] [Google Scholar]
- 30. Artis D, Wang ML, Keilbaugh SA, He W, Brenes M, Swain GP et al (2004) RELMβ/FIZZ2 is a goblet cell‐specific immune‐effector molecule in the gastrointestinal tract. Proc. Natl. Acad. Sci. USA 101, 13596–13600. [DOI] [PMC free article] [PubMed] [Google Scholar]
- 31. Wakelin D, Lloyd M (1976) Immunity to primary and challenge infections of Trichinella spiralis in mice: a re‐examination of conventional parameters. Parasitology 72, 173–182. [DOI] [PubMed] [Google Scholar]
- 32. Dasch JR, Pace DR, Waegell W, Inenaga D, Ellingsworth L (1989) Monoclonal antibodies recognizing transforming growth factor‐beta. Bioactivity neutralization and transforming growth factor beta 2 affinity purification. J. Immunol. 142, 1536–1541. [PubMed] [Google Scholar]
- 33. Powrie F, Carlino J, Leach MW, Mauze S, Coffman RL (1996) A critical role for transforming growth factor‐beta but not interleukin 4 in the suppression of T helper type 1‐mediated colitis by CD45RB (low) CD4 + T cells. J. Exp. Med. 183, 2669–2674. [DOI] [PMC free article] [PubMed] [Google Scholar]
- 34. Bromley M, Rew D, Becciolini A, Balzi M, Chadwick C, Hewitt D et al (1996) A comparison of proliferation markers (BrdUrd, Ki‐67, PCNA) determined at each cell position in the crypts of normal human colonic mucosa. Eur. J. Histochem. 40, 89–100. [PubMed] [Google Scholar]
- 35. Potten CS, Owen G, Roberts SA (1990) The temporal and spatial changes in cell proliferation within the irradiated crypts of the murine small intestine. Int. J. Radiat. Biol. 57, 185–199. [DOI] [PubMed] [Google Scholar]
- 36. Pfaffl MW (2001) A new mathematical model for relative quantification in real‐time RT‐PCR. Nucleic Acids Res. 29, e45. [DOI] [PMC free article] [PubMed] [Google Scholar]
- 37. Artis D, Potten CS, Else KJ, Finkelman FD, Grencis RK (1999) Trichuris muris: host intestinal epithelial cell hyperproliferation during chronic infection is regulated by interferon‐γ. Exp. Parasitol. 92, 144–153. [DOI] [PubMed] [Google Scholar]
- 38. Cliffe LJ, Humphreys NE, Lane TE, Potten CS, Booth C, Grencis RK (2005) Accelerated intestinal epithelial cell turnover: a new mechanism of parasite expulsion. Science 308, 1463–1465. [DOI] [PubMed] [Google Scholar]
- 39. Suzuki K, Fukui H, Kayahara T, Sawada M, Seno H, Hiai H et al (2005) Hes1‐deficient mice show precocious differentiation of Paneth cells in the small intestine. Biochem. Biophys. Res. Commun. 328, 348–352. [DOI] [PubMed] [Google Scholar]
- 40. Bastide P, Darido C, Pannequin J, Kist R, Robine S, Marty‐Double C et al (2007) Sox9 regulates cell proliferation and is required for Paneth cell differentiation in the intestinal epithelium. J. Cell Biol. 178, 635–648. [DOI] [PMC free article] [PubMed] [Google Scholar]
- 41. Ishikawa N, Goyal PK, Mahida YR, Li KF, Wakelin D (1998) Early cytokine responses during intestinal parasitic infections. Immunology 93, 257–263. [DOI] [PMC free article] [PubMed] [Google Scholar]
- 42. Datto MB, Li Y, Panus JF, Howe DJ, Xiong Y, Wang XF (1995) Transforming growth factor β induces the cyclin‐dependent kinase inhibitor p21 through a p53‐independent mechanism. Proc. Natl. Acad. Sci. USA 92, 5545–5549. [DOI] [PMC free article] [PubMed] [Google Scholar]
- 43. Hannon GJ, Beach D (1994) p15INK4B is a potential effector of TGF‐β‐induced cell cycle arrest. Nature 371, 257–261. [DOI] [PubMed] [Google Scholar]
- 44. Polyak K, Kato JY, Solomon MJ, Sherr CJ, Massague J, Roberts JM et al (1994) p27Kip1, a cyclin‐Cdk inhibitor, links transforming growth factor‐beta and contact inhibition to cell cycle arrest. Genes Dev. 8, 9–22. [DOI] [PubMed] [Google Scholar]
- 45. Knight PA, Wright SH, Brown JK, Huang X, Sheppard D, Miller HR (2002) Enteric expression of the integrin αvβ6 is essential for nematode‐induced mucosal mast cell hyperplasia and expression of the granule chymase, mouse mast cell protease‐1. Am. J. Pathol. 161, 771–779. [DOI] [PMC free article] [PubMed] [Google Scholar]
- 46. Mahida YR, Beltinger J, Makh S, Goke M, Gray T, Podolsky DK et al (1997) Adult human colonic subepithelial myofibroblasts express extracellular matrix proteins and cyclooxygenase‐1 and ‐2. Am. J. Physiol. 273, G1341–G1348. [DOI] [PubMed] [Google Scholar]