Abstract
Scanning laser ophthalmoscopy (SLO) and spectral domain optical coherence tomography (SDOCT) have become essential clinical diagnostic tools in ophthalmology by allowing for video-rate noninvasive en face and depth-resolved visualization of retinal structure. Current generation multimodal imaging systems that combine both SLO and OCT as a means of image tracking remain complex in their hardware implementations. Here, we combine a spectrally encoded confocal scanning laser ophthalmoscope (SECSLO) with an ophthalmic SDOCT system. This novel implementation of an interlaced SECSLO-SDOCT system allows for video-rate SLO fundus images to be acquired alternately with high-resolution SDOCT B-scans as a means of image aiming, guidance, and registration as well as motion tracking. The system shares the illumination source, detection system, and scanning optics between both SLO and OCT as a method of providing a simple multimodal ophthalmic imaging system that can readily be implemented as a table-top or hand-held device.
OCIS codes: (110.4234) Multispectral and hyperspectral imaging, (170.1790) Confocal microscopy, (170.3880) Medical and biological imaging, (170.4460) Ophthalmic optics and devices, (170.4500) Optical coherence tomography
1. Introduction
Scanning laser ophthalmoscopy (SLO) has become an essential clinical diagnostic tool in ophthalmology by allowing for video-rate noninvasive en face visualization of retinal structure [1–3]. Scanning laser ophthalmoscopes are most commonly implemented as either a fully confocal scanning laser ophthalmoscope (CSLO) [2] or quasi-confocal line-scanning laser ophthalmoscope (LSLO) [4]. CSLO raster scans a focused illumination spot in two-dimensions across the sample, apertures the back-scattered light through a confocal pinhole, and detects it on a single pixel detector such as an APD or PMT. LSLO replaces one of the scanning mirrors in CSLO with a cylindrical lens and scans a focused illumination line across the sample; the back-reflected light is then detected on a linear detector array. The tradeoff for the simplicity of using a single scanning mirror in LSLO is a loss of confocality along the axis of illumination. However, both of these techniques offer a clear advantage over conventional fundus photography and indirect ophthalmoscopy in terms of light efficiency and image contrast. Furthermore, these systems offer the versatility to accommodate a variety of illumination wavelengths, allowing for imaging of both endogenous and exogenous fluorescent contrast agents as a method of characterizing and diagnosing retinal pathologies. Finally, these systems may be combined with other optical diagnostic tools such as optical coherence tomography (OCT) to create multimodal imaging techniques that combine the benefits of high-resolution, high-speed en face imaging of SLO with the depth-resolution inherent in OCT [5–9]. While these systems have successfully demonstrated SLO as an effective method of image tracking for the acquisition of OCT data sets, they all require dedicated illumination sources, scanning optics, and/or detectors for both imaging modalities.
Spectral domain optical coherence tomography (SDOCT) has demonstrated strong clinical success in retinal imaging, enabling high-resolution, motion-artifact-free cross-sectional imaging and rapid accumulation of volumetric macular data sets [10,11]. Current generation SDOCT systems achieve <5 μm axial resolutions in tissue, and have been used to obtain high resolution data sets from patients with neovascular AMD, high risk drusen, and geographic atrophy [12]. However, current generation SDOCT systems require several seconds to acquire an entire volumetric data set and are thus highly susceptible to patient motion. While post-processing algorithms have been developed to register sequential B-scans as a means of motion compensation [13], these methods are computationally expensive and have demonstrated only moderate success. Hardware implementations of retinal tracking have also been demonstrated by using precise closed-loop beam-steering based on the image contrast associated with retinal features such as blood vessels, lesions, and regions of irregular pigmentation [14]. The practical limitation to registration of OCT B-scans is the ability to determine lateral motion from a series of depth cross-sections; the mean square error of these algorithms increases with decreasing scan field-of-view (FOV), as a result of torsional motion that cannot be compensated using transverse shifts, and in regions of tissue that lack high-contrast, global structural anchors [14,15]. Finally, the FOV and resolution of ophthalmic implementations of SDOCT rely completely on the ability of the patient eye as a focusing objective. For patients with grossly irregular anatomy, such as in retinopathy of prematurity [16], a method of image aiming and guidance is necessary for successful acquisition of SDOCT data sets.
While current generation SDOCT and SLO imaging systems have demonstrated robust clinical utility, most commercially available systems have been implemented as table-top slit-lamp adapted ophthalmoscopes. The physical size and complexity of these systems have restricted imaging to primarily cooperative patients who are able to sit and fixate in an upright position. However, the clinical relevance of noncontact SDOCT systems that are able to image supine subjects have been demonstrated [16,17] and there is currently an unmet demand for hand-held SDOCT systems that will allow for the imaging of non-anesthetized and anesthetized infants. These devices can be used as an effective method for providing comprehensive macular examination in a pediatric setting.
Spectral encoding of spatial information has been shown to be an effective alternative to scanning confocal imaging systems in microscopy and endoscopy [18,19]. This method laterally disperses the illumination beam using a diffractive element, spectrally encodes each spatial position, recombines the back-scattered light and confocally apertures out-of-focus light using a single-mode fiber, and decodes the information either interferometrically or spectroscopically. These methods have recently been used to demonstrate a fiber-based spectrally encoded confocal scanning laser ophthalmoscope (SECSLO) [20], which combines the full-confocality of conventional CSLO with a simple fiber-based design. Here, we demonstrate a multimodal combination of SECSLO and SDOCT. Since the illumination source and detection systems for the SECSLO is identical to those of SDOCT, simple modifications to the scanning sample-arm of a conventional ophthalmic SDOCT system are all that is needed to accommodate both imaging modalities. The system described acquires en face images using the SECSLO and depth-resolved B-scans from the SDOCT in a sequential manner to provide interlaced SECSLO-SDOCT imaging of in vivo human fundus. The shared optical components between the two modalities allows for inherent co-registration of SLO and OCT data, which can be used as a means of image aiming, guidance, and registration as well as motion tracking. Finally, the design of the combined system could readily be miniaturized to function as a hand-held ophthalmic imaging device.
2. Theory
The theoretical basis for SECSLO [20], and similar techniques [18,19,21–27], have previously been described. Briefly, SECSLO is a fully confocal imaging system, with a confocal aperture determined by the mode-field diameter of the single-mode illumination and collection fiber. The full confocal nature of SECSLO has been experimentally verified to be well matched with theoretical axial and lateral point spread functions (PSF) for confocal systems [20], described by and , respectively [28]. Here, and , where z is the axial position, r is the radial position, and α is the half-angle subtended by the objective. Any optical aberrations in the system will distort the PSF as it propagates through the imaging system, resulting in loss of confocality and resolution. In SECSLO, the sampling resolution in the spectrally encoded dimension is solely determined by the number of resolvable points, . This value is calculated as , where is the source bandwidth, f is the grating frequency, D is the spot-size, is the center wavelength, and is the diffraction angle. Finally, the SECSLO signal is detected using a spectrometer, similar to that used in SDOCT. A single-mode fiber output is spectrally dispersed and focused onto a linear detector array. The spectral resolution in the detection arm is ideally matched to that of the sample arm, and the system effectively images a single spectral channel, with spatial extent matching that of the single-mode fiber core, onto each pixel of the detector. It has been demonstrated that this detection method results in negligible loss of resolution from spectral cross-talk [20].
3. Methods
Interlaced SECSLO-SDOCT was implemented on a modified slip lamp base for human fundus imaging (Fig. 1 ). A superluminescent diode, with a center wavelength of 840 nm and bandwidth of 49 nm, was used as the illumination source. The source was input into a single-mode fiber-optic circulator and unbalanced coupler (90:10 splitting ratio), and 90% of the source out was collimated and relayed through the slip lamp-mounted sample-arm optics. The slow-axis OCT galvanometer scanner in the sample-arm acted as an optical switch between the SECSLO (red) and OCT (blue) optical paths, allowing for a shared optical path (green) between the SECSLO and OCT that consisted of scanners and relay lenses [Fig. 1(a)]. This mirror (Gy, S) was driven with a standard step waveform when in OCT mode, with an angular position that corresponded to the C-scan position of each B-scan. In SECSLO mode, a signal was applied such that the mirror flipped to its maximum angular position and relayed the illumination source across a sequence of mirrors, through a diffraction grating, and then back along the optical axis of the OCT. The driving signals of both galvanometer scanners in the SECSLO-SDOCT system may be varied such that an entire SECSLO fundus image is collected interlaced with an entire OCT B-scan [Fig. 1(b), 1(c)]. However, the constraints on the driving signals are flexible enough to accommodate arbitrary acquisition of fundus images and B-scans, which may be catered for different imaging paradigms. Since most of the optics in the sample-arm were shared, this acted as a hardware constraint such that both SECSLO and OCT images were inherently co-registered, thus obviating the need for computationally intensive registration algorithms in post-processing. Furthermore, the shared sample-arm path allows for a reduction in the number of physical optical elements and can facilitate miniaturization of the sample-arm to a size and weight appropriate for hand-held operation.
Fig. 1.
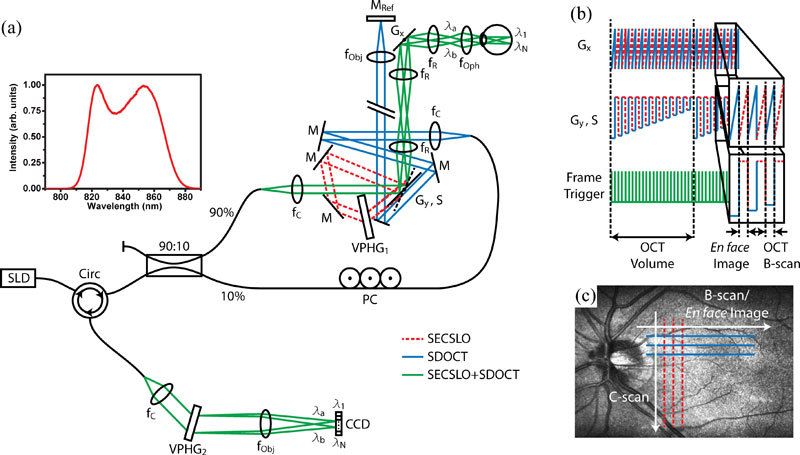
Optical schematic and timing diagram of the interlaced SECSLO-SDOCT. (a) Fiber-based combined SECSLO-SDOCT system with SECSLO (red-dashed), SDOCT (blue), and shared (green) optical paths. CCD, linear CCD array; f, focal length of collimating, relay, and focusing elements; G, galvanometer; PC, polarization controller; M, mirror; VPHG, grating. (b) Galvanometer timing diagram showing driving signals for the fast-axis SECSLO-SDOCT scanner (Gx) and slow-axis scanner and SECSLO-SDOCT switch (Gy, S) with frame trigger. Driving waveforms shown corresponds to interlaced acquisition of a single SECSLO fundus image with a SDOCT B-scan. (c) Diagram illustrating the scanning geometry of interlaced SECSLO-SDOCT acquisition.
The SECSLO optical path consisted of a galvanometer switch scanner, 80% diffraction efficiency volume phase grating (Wasatch Photonics, 1200 lines/mm), optical telescope, fast-axis galvanometer scanner arranged orthogonal to the dispersion axis, relay lens, and 40D aspheric ophthalmic lens. The OCT optical path consisted of slow- and fast-axis galvanometer scanners, separated by an optical telescope, and relay optics that imaged the scanning pivot of the galvanometers onto the pupil plane of the subject for maximized FOV and reduced vignetting artifacts. The OCT reference arm was optically relayed such that it ran parallel to the back face of the switch galvanometer so that in SECSLO mode, the reference arm was blocked by the switch. This reduced the deleterious effects of shot noise from a highly reflective reference arm mirror on the SLO signal since SECSLO is a direct detection system that does not benefit from the advantages of interferometric gain.
The back-reflected signal, after de-scanning and transmission back through the single-mode fiber-optic coupler and circulator, was detected on a custom spectrometer consisting of a collimating lens, 80% diffraction efficiency transmission grating (Wasatch Photonics, 1800 lines/mm), focusing objective, and 1024 pixel line-scan CCD array (e2v, Ltd.) operating at 20 kHz line-rate. Custom software (Bioptigen, Inc.) performed real-time data acquisition, processing, archiving, and display. The SECSLO was optimized for transmission efficiency through the grating, resolvable points in the spectral dimension, FOV, and spatial resolution [20]. The resulting system allowed for 1131 resolvable points in the spectral dimension over a 3 mm FOV, which could be optically expanded or reduced by modifying the magnification of the telescope in the sample arm. The FOV and sampling frequency in the laterally scanned dimension for the SECSLO and in both lateral dimensions for the OCT was arbitrarily determined by the driving waveforms input into either the fast-axis or both fast- and slow-axis scanners, respectively. The spatial resolution of both the SECSLO and SDOCT, as determined by the magnification of the relay optics in the slit lamp, was theoretically limited to 6.62 μm, but was ultimately dominated by the confocal focused spot size and aberrations present in the eye. Using a 700 μW sample beam, the shared detection spectrometer allowed for an SDOCT SNR measured near DC of 112 dB with an axial resolution of 4.56 μm and 6 dB falloff at 1.25 mm. De-interlacing of SECSLO and SDOCT frames, co-registration and averaging of SECSLO data, and DC removal and k-space resampling of OCT data were computed during post-processing using Matlab (MathWorks, Inc.) and ImageJ (NIH, USA). OCT volumetric data sets were visualized in 3D using Amira (Visage Imaging, Inc.).
4. Results and discussion
In vivo interlaced SECSLO-SDOCT imaging was demonstrated on normal human fundus. Human images were acquired in accordance with a protocol approved by the Duke University Institutional Review Board. The optical power at the pupil for both SECSLO and SDOCT was limited to 700 μW and all images were acquired with 1024 x 1024 pixels at 20 kHz line-rate for continuous imaging at 20 Hz frame-rate. The FOV in the spectrally encoded dimension in the following experiments was limited to 3 mm by the sample-arm optics, but could easily be enlarged or reduced by adjusting the period of the grating or magnification of the relay telescope. As a result of using shared sample-arm optics between the SECSLO and SDOCT, the laterally scanned dimension of the SECSLO was inherently co-registered with that in the SDOCT; the optics were aligned such that the spectrally encoded dimension of the SLO image was centered on the C-scan FOV of the SDOCT. Finally, since each spatial position in the SECSLO is essentially monochromatic, individual fundus images suffered from speckle noise [19,20]. While various methods have been developed to address this problem in hardware for spectrally encoded endoscopy systems [29,30]; here, we co-registered and averaged sequentially acquired SECSLO fundus images for improved SNR and reduced speckle.
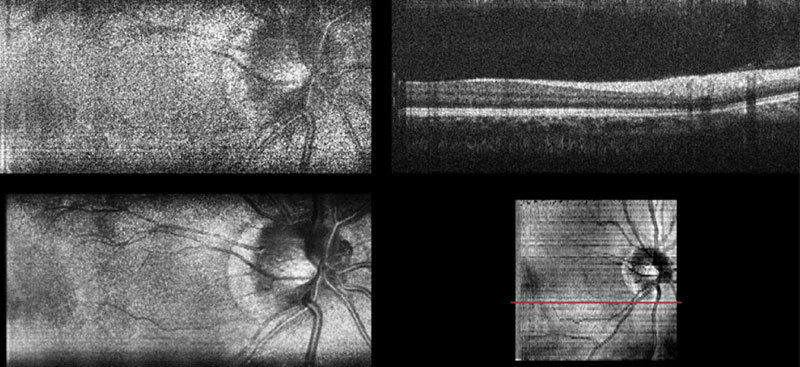
Fig. 3. (Media 1 (8.2MB, AVI) ) Movie of interlaced SECSLO-SDOCT of in vivo human retina showing raw SECSLO fundus images and SDOCT B-scans acquired at 20 kHz line-rate, an average of 20 co-registered fundus images, and SVP calculated from a volumetric OCT data set.
Volumetric data sets of in vivo human fundus were acquired using SDOCT over a FOV of 5 x 5 mm2 with 1024 pixels per A-scan and 1024 A-scans per B-scan. The SECSLO, with a FOV of 5 x 3 mm2, was centered on the SDOCT FOV and acquired with 1024 x 1024 pixels (lateral x spectral). The galvanometers were driven such that 200 interlaced frames were acquired over the entire SDOCT volume, 100 SECSLO fundus images interlaced with 100 SDOCT B-scans, with an overall imaging time of 10 seconds (Figs. 2 , 3). The raw data was then de-interlaced and the OCT B-scan spectral data were processed to show multimodal imaging of human fundus using SECSLO [Fig. 2(a)] and SDOCT [Fig. 2(b)]. Since both SECSLO fundus images and SDOCT B-scans were acquired using a shared optical path and interlaced frames were acquired at a frame-rate of 20 Hz, the de-interlaced raw images illustrate co-registered detection of patient motion between the SECSLO and SDOCT images (Fig. 3). Here, the raw SECSLO images show spatial intensity nonuniformity associated with the spectral shape of the illumination source [Fig. 2(a)]. The intensity of each SECSLO frame was normalized in post-processing by using the spectral intensity calculated from the average, along the laterally scanned dimension, of twenty sequential frames. These twenty sequentially acquired fundus images were then co-registered and averaged for improved SNR and reduced speckle [Fig. 2(c)], showing improved visibility of detailed structures and vasculature as a result of reduced noise. Sequential B-scans in the 5 x 5 mm2 volumetric SDOCT data set were also co-registered and summed axially to create a summed-voxel-projection (SVP) fundus image [Fig. 2(d)]. A comparison of the averaged SECSLO [Fig. 2(c)] and SVP [Fig. 2(d)] fundus images confirms co-registration of the SECSLO over the center 5 x 3 mm2 FOV of the SDOCT volume. Finally, the raw SECSLO and SDOCT data were post-processed to display a running average of 5 co-registered and averaged SECSLO fundus images displayed at an effective frame-rate of 2 Hz, and a 3D volumetric representation of the SDOCT data set (Fig. 4 ).
Fig. 2.
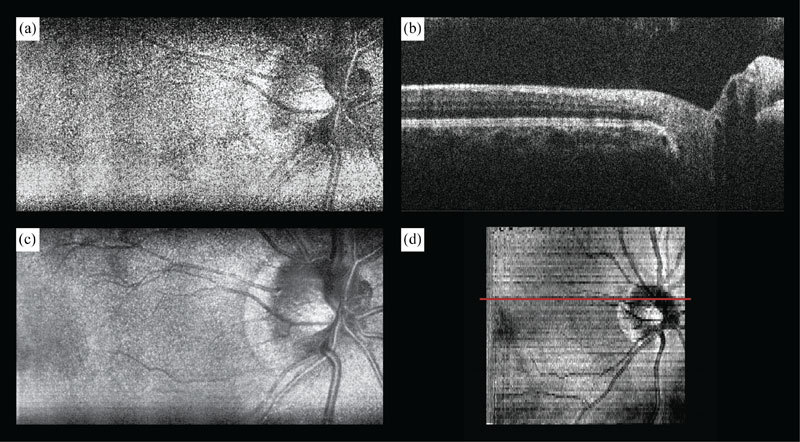
Interlaced SECSLO-SDOCT of in vivo human retina. (a) 5 x 3 mm2 (lateral x spectral) raw SECSLO fundus image acquired interlaced with (b) 5 x 5 x 1.8 mm3 (lateral x lateral x axial) raw SDOCT B-scan. (c) Co-registered and averaged 20 raw SECSLO frames demonstrating improved SNR and reduced speckle noise. (d) SVP of OCT volume acquired interlaced with SECSLO frames illustrating inherent co-registration between SECSLO and OCT images as a result of shared sample arm optical paths. Red line in SVP indicates position corresponding to B-scan shown in (b). All images were acquired with 1024 x 1024 pixels at 20 kHz line-rate. SECSLO-SDOCT volume was acquired with 200 frames, 100 fundus images interlaced with 100 B-scans. Illumination power = 700 μW.
Fig. 4.
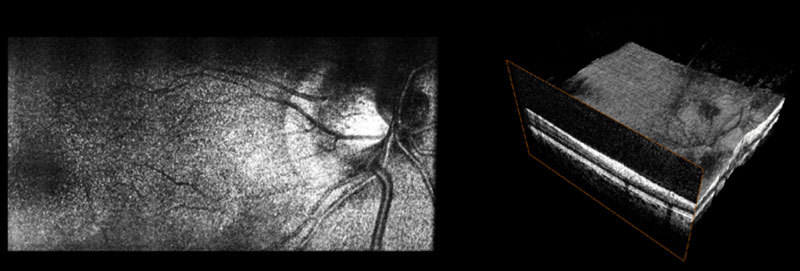
(Media 2 (7.6MB, AVI) ) Movie of post-processed interlaced SECSLO-SDOCT data of in vivo human retina showing running average of 5 co-registered SECSLO fundus images displayed at an effective frame-rate of 2 Hz and rendering of a volumetric SDOCT data set acquired at 20 kHz line-rate.
Since the SECSLO fundus images can be acquired at a much faster rate (10 Hz) and with higher resolution (1024 x 1024 pix.) as compared to the SDOCT SVP (0.1 Hz and 1024 x 100 pix., respectively), the SECSLO fundus images are better suited for motion estimation and lateral co-registration in post-processing. While the SECSLO fundus images provide no depth-resolved information, implying that sequential SDOCT B-scans will still need to be co-registered in depth, the shared optical path between the SECSLO and SDOCT have been demonstrated to provide inherently co-registered en face and depth-resolved fundus images, making this interlaced multimodal system uniquely appropriate for lateral motion tracking (Fig. 5 ). Sequential SECSLO fundus images (acquired at an effective frame rate of 10 Hz) were co-registered using an affine transformation algorithm in post-processing [13] and the resulting lateral motion of each frame is plotted (blue line). This motion can be tracked as a function of time in both lateral position (red dot) and angular rotation (red line). Similarly, these motion tracking methods were applied for motion compensation of interlaced SECSLO-SDOCT data (Fig. 6 ). A region-of-interest (red box) in a series of 100 5 x 3 mm2 (lateral x spectral) raw SECSLO fundus images were co-registered [Fig. 6(a)], and the resulting transformation matrices were used to compensate for bulk motion in an SDOCT volume acquired interlaced with the SECSLO fundus images. A 5 x 5 mm2 SDOCT SVP of motion compensated data showing registration artifacts [Fig. 6(c)] was interpolated for artifact reduction [Fig. 6(d)] and compared with an SVP generated without motion compensation[Fig. 6(b)], demonstrating the utility of real-time SECSLO fundus imaging as a method for motion tracking and image registration of SDOCT B-scans. In these data sets, discrete lateral discontinuities, as a result of saccades, were compensated using motion tracking (red arrow). Furthermore, accumulated lateral drifts during imaging, with total displacements of several hundred microns (Fig. 5), resulted in misrepresentations of the structural morphology in the raw SDOCT volume as evidenced by the distorted borders of the SVP (blue arrow), which were also compensated using the co-registered SECSLO fundus images. Motions artifacts during volumetric acquisition, depicted as SVP discontinuities in Fig. 6(c), are effectively regions of missing data that were not sampled by the OCT imaging beam. Interpolation, while demonstrated here as a simple method of removing these missing regions, could also mask structural information that may be diagnostically relevant. More rigorous alternatives to interpolation include mosaicking together a single volumetric data set by resampling several motion-corrected volumes or using the en face images as a method of real-time tracking to “fill in” these areas of missing data.
Fig. 5.
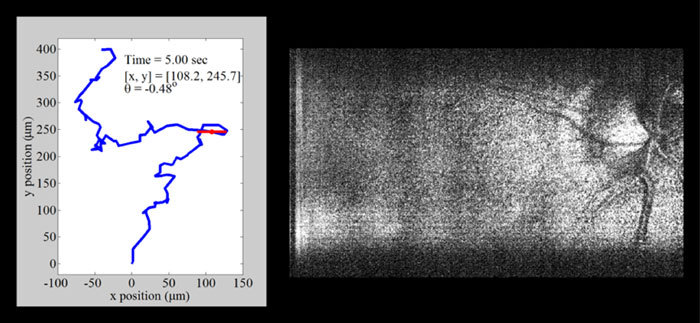
(Media 3 (9.7MB, AVI) ) Movie demonstrating motion tracking of interlaced SECSLO-SDOCT of in vivo human retina. Sequential SECSLO fundus images (acquired at an effective frame rate of 10 Hz) were co-registered using an affine transformation algorithm in post-processing and the resulting lateral motion is plotted (blue line). This motion can be tracked as a function of time in both lateral position (red dot) and angular rotation (red line).
Fig. 6.
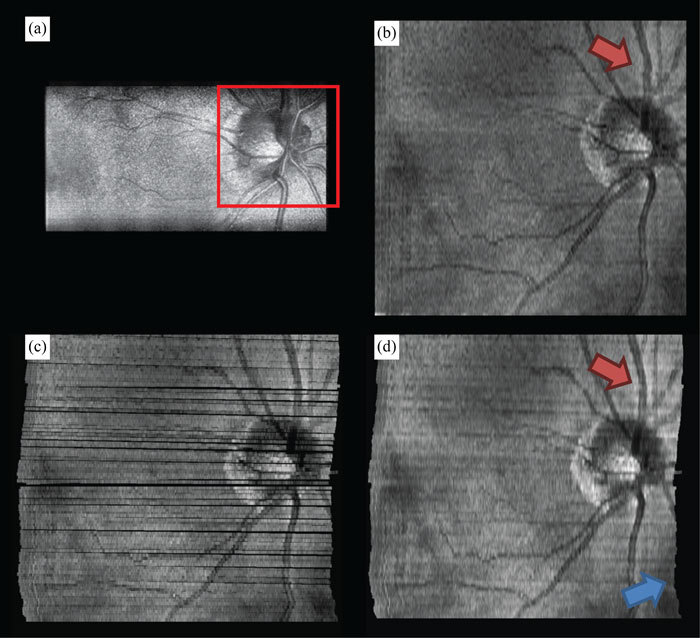
Motion compensated interlaced SECSLO-SDOCT of in vivo human retina. (a) A region-of-interest (red box) in a series of 100 5 x 3 mm2 (lateral x spectral) raw SECSLO fundus images were co-registered using an affine transformation. The resulting transformation matrices were used to compensate for bulk motion in an SDOCT volume acquired interlaced with the SECSLO fundus images. (b) 5 x 5 mm2 SDOCT SVP without motion compensation. (c) Maximum intensity projection of SDOCT SVP data following correction for bulk motion (black areas represent regions of data never acquired due to patient motion), and (d) interpolated motion compensated SVP demonstrating the utility of real-time SECSLO fundus imaging as a method for motion tracking and image registration of SDOCT B-scans. In these data sets, discrete lateral discontinuities, as a result of saccades, were compensated using motion tracking (red arrow). Furthermore, accumulated lateral drifts during imaging, with total displacements of several hundred microns (Fig. 5), resulted in misrepresentations of the structural morphology in the raw SDOCT volume as evidenced by the distorted borders of the SVP (blue arrow), which were also compensated using the co-registered SECSLO fundus images.
Finally, the driving signals of the galvanometers in the system may be adjusted for arbitrary scanning protocols. For example, real-time updated “smart” sampling waveforms could be used and uniquely catered for a specific range of lateral motion to provide faster acquisition of volumetric data sets that are less susceptible to motion artifacts. However, complex scanning protocols may be limited by the response time of the switch galvanometer in the present setup. Every time the sample-arm is switched between the SECSLO and SDOCT optical paths, the switch galvanometer rotates to its maximum angular position, which resulted in some ringing artifacts at the edges of the sequential frames [Fig. 2(a)–2(d)]. These response time delay artifacts may be mitigated by using a smaller galvanometer mirror or acousto-optic device, which have better large angular step response times. Since the shared optical paths in the sample-arm allows for a reduced number of physical optical elements, this system may be miniaturized to accommodate hand-held operation. This could have benefits for hand-held SDOCT imaging of uncooperative subjects, such as neonates [16], by using the video-rate fundus images provided by the SECSLO as a method of aiming and guiding SDOCT imaging. Finally, since the interlaced SECSLO-SDOCT system utilizes the same illumination source and detection spectrometer as conventional SDOCT systems, it may be easily adapted into existing systems and used as a less expensive alternative to some of the commercially available multimodal SLO-OCT systems.
5. Conclusions
We have demonstrated a combined SECSLO-SDOCT system for in vivo human imaging that allows for interlaced multimodal acquisition of both en face and depth-resolved fundus images. Interlaced SECSLO-SDOCT allows for high-speed, inherently co-registered imaging through the use of a shared SDOCT illumination source and spectrometer, along with a mostly shared sample-arm optical path. This system allows for a reduction in the overall complexity of the multimodal imaging system, thus allowing for the possibility of miniaturization of the device into a hand-held system. The inherent co-registration of both SECSLO and SDOCT also makes the system unique suited as a method of image aiming, guidance, and registration as well as motion tracking.
Acknowledgements
This research was supported by the National Institutes of Health (NIH), grant EY017393, the National Science Foundation (NSF), grant CBET-0933059, and the Hartwell Foundation.
References and links
- 1.Webb R. H., Hughes G. W., “Scanning laser ophthalmoscope,” IEEE Trans. Biomed. Eng. 28(7), 488–492 (1981). 10.1109/TBME.1981.324734 [DOI] [PubMed] [Google Scholar]
- 2.Webb R. H., Hughes G. W., Delori F. C., “Confocal scanning laser ophthalmoscope,” Appl. Opt. 26(8), 1492–1499 (1987). 10.1364/AO.26.001492 [DOI] [PubMed] [Google Scholar]
- 3.Webb R. H., Hughes G. W., Pomerantzeff O., “Flying spot TV ophthalmoscope,” Appl. Opt. 19(17), 2991–2997 (1980). 10.1364/AO.19.002991 [DOI] [PubMed] [Google Scholar]
- 4.Hammer D. X., Ferguson R. D., Ustun T. E., Bigelow C. E., Iftimia N. V., Webb R. H., “Line-scanning laser ophthalmoscope,” J. Biomed. Opt. 11(4), 041126 (2006). 10.1117/1.2335470 [DOI] [PubMed] [Google Scholar]
- 5.Podoleanu A. G. H., Dobre G. M., Cucu R. G., Rosen R. B., “Sequential optical coherence tomography and confocal imaging,” Opt. Lett. 29(4), 364–366 (2004). 10.1364/OL.29.000364 [DOI] [PubMed] [Google Scholar]
- 6.Rosen R. B., Hathaway M., Rogers J., Pedro J., Garcia P., Dobre G. M., Podoleanu A. G. H., “Simultaneous OCT/SLO/ICG imaging,” Invest. Ophthalmol. Vis. Sci. 50(2), 851–860 (2008). 10.1167/iovs.08-1855 [DOI] [PubMed] [Google Scholar]
- 7.N. V. Iftimia, D. X. Hammer, C. E. Bigelow, T. E. Ustun, A. H. Burbo, J. F. de Boer, and R. D. Ferguson, “Hybrid LSLO/SDOCT retinal imager,” in Proceedings of SPIE (SPIE, 2007), p. 642602. [Google Scholar]
- 8.Pircher M., Zawadzki R. J., Evans J. W., Werner J. S., Hitzenberger C. K., “Simultaneous imaging of human cone mosaic with adaptive optics enhanced scanning laser ophthalmoscopy and high-speed transversal scanning optical coherence tomography,” Opt. Lett. 33(1), 22–24 (2008). 10.1364/OL.33.000022 [DOI] [PMC free article] [PubMed] [Google Scholar]
- 9.Iftimia N. V., Hammer D. X., Bigelow C. E., Ustun T. E., de Boer J. F., Ferguson R. D., “Hybrid retinal imager using line-scanning laser ophthalmoscopy and spectral domain optical coherence tomography,” Opt. Express 14(26), 12909–12914 (2006). 10.1364/OE.14.012909 [DOI] [PubMed] [Google Scholar]
- 10.Nassif N. A., Cense B., Park B. H., Pierce M. C., Yun S. H., Bouma B. E., Tearney G. J., Chen T. C., de Boer J. F., “In vivo high-resolution video-rate spectral-domain optical coherence tomography of the human retina and optic nerve,” Opt. Express 12(3), 367–376 (2004). 10.1364/OPEX.12.000367 [DOI] [PubMed] [Google Scholar]
- 11.Wojtkowski M., Srinivasan V. J., Ko T., Fujimoto J. G., Kowalczyk A., Duker J., “Ultrahigh-resolution, high-speed, Fourier domain optical coherence tomography and methods for dispersion compensation,” Opt. Express 12(11), 2404–2422 (2004). 10.1364/OPEX.12.002404 [DOI] [PubMed] [Google Scholar]
- 12.Stopa M., Bower B. A., Davies E., Izatt J. A., Toth C. A., “Correlation of pathologic features in spectral domain optical coherence tomography with conventional retinal studies,” Retina 28(2), 298–308 (2008). 10.1097/IAE.0b013e3181567798 [DOI] [PubMed] [Google Scholar]
- 13.Thévenaz P., Ruttimann U. E., Unser M., “A pyramid approach to subpixel registration based on intensity,” IEEE Trans. Image Process. 7(1), 27–41 (1998). 10.1109/83.650848 [DOI] [PubMed] [Google Scholar]
- 14.Ferguson R. D., Hammer D. X., Paunescu L. A., Beaton S., Schuman J. S., “Tracking optical coherence tomography,” Opt. Lett. 29(18), 2139–2141 (2004). 10.1364/OL.29.002139 [DOI] [PMC free article] [PubMed] [Google Scholar]
- 15.Hammer D., Ferguson R. D., Iftimia N., Ustun T., Wollstein G., Ishikawa H., Gabriele M., Dilworth W., Kagemann L., Schuman J., “Advanced scanning methods with tracking optical coherence tomography,” Opt. Express 13(20), 7937–7947 (2005). 10.1364/OPEX.13.007937 [DOI] [PMC free article] [PubMed] [Google Scholar]
- 16.Scott A. W., Farsiu S., Enyedi L. B., Wallace D. K., Toth C. A., “Imaging the infant retina with a hand-held spectral-domain optical coherence tomography device,” Am. J. Ophthalmol. 147(2), 364–373, e2 (2009). 10.1016/j.ajo.2008.08.010 [DOI] [PubMed] [Google Scholar]
- 17.Vinekar A., Sivakumar M., Shetty R., Mahendradas P., Krishnan N., Mallipatna A., Shetty K. B., “A novel technique using spectral-domain optical coherence tomography (Spectralis, SD-OCT+HRA) to image supine non-anaesthetized infants: utility demonstrated in aggressive posterior retinopathy of prematurity,” Eye (Lond.) 24(2), 379–382 (2010). 10.1038/eye.2009.313 [DOI] [PubMed] [Google Scholar]
- 18.Tearney G. J., Shishkov M., Bouma B. E., “Spectrally encoded miniature endoscopy,” Opt. Lett. 27(6), 412–414 (2002). 10.1364/OL.27.000412 [DOI] [PubMed] [Google Scholar]
- 19.Tearney G. J., Webb R. H., Bouma B. E., “Spectrally encoded confocal microscopy,” Opt. Lett. 23(15), 1152–1154 (1998). 10.1364/OL.23.001152 [DOI] [PubMed] [Google Scholar]
- 20.Tao Y. K., Izatt J. A., “Spectrally encoded confocal scanning laser ophthalmoscopy,” Opt. Lett. 35(4), 574–576 (2010). 10.1364/OL.35.000574 [DOI] [PMC free article] [PubMed] [Google Scholar]
- 21.Boudoux C., Yun S. H., Oh W. Y., White W. M., Iftimia N. V., Shishkov M., Bouma B. E., Tearney G. J., “Rapid wavelength-swept spectrally encoded confocal microscopy,” Opt. Express 13(20), 8214–8221 (2005). 10.1364/OPEX.13.008214 [DOI] [PubMed] [Google Scholar]
- 22.Yelin D., Bouma B. E., Iftimia N. V., Tearney G. J., “Three-dimensional spectrally encoded imaging,” Opt. Lett. 28(23), 2321–2323 (2003). 10.1364/OL.28.002321 [DOI] [PubMed] [Google Scholar]
- 23.Yelin D., Bouma B. E., Tearney G. J., “Volumetric sub-surface imaging using spectrally encoded endoscopy,” Opt. Express 16(3), 1748–1757 (2008). 10.1364/OE.16.001748 [DOI] [PubMed] [Google Scholar]
- 24.Yelin D., Rizvi I., White W. M., Motz J. T., Hasan T., Bouma B. E., Tearney G. J., “Three-dimensional miniature endoscopy,” Nature 443(7113), 765 (2006). 10.1038/443765a [DOI] [PubMed] [Google Scholar]
- 25.Yelin D., White W. M., Motz J. T., Yun S. H., Bouma B. E., Tearney G. J., “Spectral-domain spectrally-encoded endoscopy,” Opt. Express 15(5), 2432–2444 (2007). 10.1364/OE.15.002432 [DOI] [PubMed] [Google Scholar]
- 26.Yelin D., Yun S. H., Bouma B. E., Tearney G. J., “Three-dimensional imaging using spectral encoding heterodyne interferometry,” Opt. Lett. 30(14), 1794–1796 (2005). 10.1364/OL.30.001794 [DOI] [PubMed] [Google Scholar]
- 27.Merman M., Abramov A., Yelin D., “Theoretical analysis of spectrally encoded endoscopy,” Opt. Express 17(26), 24045–24059 (2009). 10.1364/OE.17.024045 [DOI] [PubMed] [Google Scholar]
- 28.T. Wilson, Confocal microscopy (Academic Press, London; San Diego, 1990). [Google Scholar]
- 29.Lemire-Renaud S., Rivard M., Strupler M., Morneau D., Verpillat F., Daxhelet X., Godbout N., Boudoux C., “Double-clad fiber coupler for endoscopy,” Opt. Express 18(10), 9755–9764 (2010). 10.1364/OE.18.009755 [DOI] [PubMed] [Google Scholar]
- 30.Yelin D., Bouma B. E., Yun S. H., Tearney G. J., “Double-clad fiber for endoscopy,” Opt. Lett. 29(20), 2408–2410 (2004). 10.1364/OL.29.002408 [DOI] [PubMed] [Google Scholar]


