Abstract
We present a new near infrared optical probe for the sentinel lymph node detection, based on the recording of scattered photons. A two wavelengths setup was developed to improve the detection threshold of an injected dye: the Patent Blue V dye. The method used consists in modulating each laser diode at a given frequency. A Fast Fourier Transform of the recorded signal separates both components. The signal amplitudes are used to compute relative Patent Blue V concentration. Results on the probe using phantoms model and small animal experimentation exhibit a sensitivity threshold of 3.2 µmol/L, which is thirty fold better than the eye visible threshold.
OCIS codes: (170.3890) Medical optics instrumentation; (170.6510) Spectroscopy, tissue diagnostics
1. Introduction
The lymphatic system includes three distinct subsets: the lymphatic capillaries, lymphatic vessels and thoracic duct. Lymph is drained from the lymphatic capillaries to the lymph nodes where it penetrates to be filtered. The sentinel lymph node is defined as the first node that receives afferent lymphatic drainage from a tumour. These nodes have a spheroid shape with dimensions varying from 1 to 15 mm.
In 1960, E.A. Gould was the first to introduce the sentinel lymph node concept [1]. According to him, a tumour is drained preferentially in the direction of the first node risking a metastatic invasion. If this latter, called also sentinel lymph node is not invaded, all the axillary lymph nodes are negative. Indeed, its histological status is representative of the status of the other nodes of the chain [2]. The axillary chain is the most involved lymphatic chains (85%) in the lymph drainage of the breast. Thus, for breast cancer, when the tumor is invasive, the first approach consists in removing the entire lymph node from the axillary chain. An other procedure used in clinical routine is clearly defined as the sentinel node method: a lymphophilic tracer (radio-isotope [3] or/and dye [4]) is injected in the vicinity of the tumour or in the periareolar area [5]. A first detection of the sentinel node is determined percutaneously, usually with a nuclear probe. A second detection, carried out after skin incision in the armpit, involves both nuclear and optical (visual) analysis. Studies have shown that the sentinel node method is associated with less morbidity compared to the axillary dissection [6].
Detection of sentinel lymph node using other optical methods has been recently developed. One of them is a self-assembled complex of radiocolloid (99mTc) with fluorescent agent: the indocyanine green (ICG) for combined pre-and intraoperative imaging of sentinel lymph nodes [7,8]. Other techniques are now under development such as photoacoustic or fluorescence detection. On one hand, many studies propose the photoacousic approach to detect sentinel lymph nodes using tracers like nanorods [9] or nanobeacons [10]. These methods are promising but their applications in humans are still experimental. On the other hand, studies using fluorescent tracers on animal model have permitted the detection and the imaging of lymph node [11–13]. Moreover, the use of indocyanine green (ICG) has recently yielded the first imaging of lymphatic system of human and performed to investigate the clinical feasibility of ICG fluorescence imaging [14,15].
We propose an alternative based on a very simple optical device to detect and identify sentinel lymph nodes. This can be achieved through a colorimetric procedure using a dye. Patent Blue V [16] is the most frequently used dye in clinical routine. To detect the blue nodes surgeons usually rely on visual inspection. The use of the Patent Blue V dye for this experiment is a considerable asset for future clinical application. We designed an easy used probe, based on two laser diodes and a photodiode detector, to detect automatically the dye. We have demonstrated that the probe has a better sensitivity then the visual appreciation of the surgeon. Two experimental cases were developed to highlight the advantages of the probe: phantoms and small animal experimentation.
2. Theory
When a wave propagates in an absorbing and scattering medium, the decrease in intensity, IT, can be expressed using the modified Beer-Lambert law. In the following expressions, absorption by the Patent Blue V dye is discriminated from absorption by other chromophores present in the phantom/tissue under study. The backscattered light intensity detected by the detector can be written as:
| (1) |
where I0 is the intensity of light backscattered by a non absorbing sample, µaT the optical absorption coefficient of tissue, µaPB the optical absorption of the Patent Blue V, l the distance between the light source and detector and β the differential pathlenght factor which depends on the scattering and absorption optical properties of the medium. With where CPB is the dye concentration εPB is the molar extinction coefficient of the Patent Blue V dye
In a first step, when the absorption changes remain small as compared to the initial absorption, the product l.β is assumed to be constant during the experiment. When this approximation does not hold, a more complex model should be considered. In such cases, we used the one described by Contini and al [17], derived from the Patterson model, which express I as a function of the optical absorption and scattering properties of a homogeneous, semi-infinite medium:
| (2) |
where D is the diffusion coefficient, ,µ’s the reduced scattering coefficient.
Equation (1) shows that, if the tissue absorption coefficient is constant, variations in the backscattered signal can only be due to changes in Patent Blue V concentration. This can be monitored with a single-wavelength setup. If µaT varies during the detection process, either as a result of time variations or changes in the position of the probe, the two parameters µaPB and µaT should be measured separately, which requires at least a two-wavelength setup.
To determine the Patent Blue V concentration, we used the Eq. (1), with an added term ID to take into account for dark correction. ID is measured without scattered signal:
| (3) |
After an initial measurement on a non absorbing sample, , it is possible to compute the product of the total absorption coefficient times l.β:
| (4) |
If the initial measurement is performed on a sample without dye, we can express it as
| (5) |
We can compute the sum of the absorption by the dye µaPB and the variation of absorption by tissues :
| (6) |
Performing the measurement of R at two wavelengths allows the computation of the Patent Blue V concentration by solving a system of two linear equations with two unknowns. This linear system can be written as follow:
| (7) |
where , the molar extinction coefficients matrix with εij representing the molar absorption of chromophore (dye or tissue) i at the wavelength j and the computed vector of concentrations multiplied by β.l. The concentrations are the dye concentration and an expression of the tissue chromophores concentrations, according to the definition of their molar extinction coefficients.
3. Material and methods
3.1. Probe
The instrument is based on two laser diodes (LDM modules, ILEE) and a photodiode (S5106, HAMAMATSU). Both lasers are controlled via a National Instrument (NI USB-6008 OEM) card connected to a computer via a USB port. The signal from the photodiode is digitalized by the same card with a sampling frequency equal to 1000 Hz. The explored area is illuminated with a probe pen which includes the 2 optical fibers for emission and the receiving fiber, positioned as a triangle. Emission and reception fibers are 4 mm apart (Fig. 1 ).
Fig. 1.
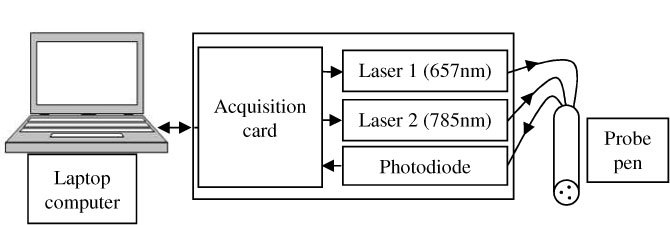
Schematic diagram of the setup.
The absorption spectrum of Patent Blue V exhibits maximum absorption at 638 nm. We implemented the first laser beam with a wavelength near to this maximum (657 nm), and, in order to detect optical absorption by tissues the second beam with a wavelength not absorbed by the dye (785 nm). The method used consists in modulating each laser diode at a given frequency, 15 Hz and 25 Hz for the laser diodes at 657 nm and 785 nm, respectively. A Fast Fourier Transform of the recorded signal separates both components. It also allows distinguishing them from the ambient light detected. The signal amplitudes at both wavelengths are then used to compute the relative values of the Patent Blue V concentration, as described in the above section.
3.2. Phantoms description
Preliminary studies were carried out on 1% Intralipid solutions to which Black India ink was added to simulate absorption and scattering by breast tissues [18]. We choose a reduced scattering coefficient µ’s equal to 0.89 mm−1 [19] and an absorption coefficient μa equal to 0.05 mm−1 at 650 nm. Patent Blue V (Bleu Patente V Sodique, Guerbet) was finally added by successive injections.
3.3. Small animal experimentation
In order to detect lymph nodes in vivo we have used an animal model with active nodes in a myelin basic protein (MBP) induced acute Experimental Allergic Encephalomyelitis (EAE) model of Lewis rat [20].
The emulsion was composed of a mixture of equal volumes of two solutions prepared separately: the complete Freund’s adjuvant (CFA) and the antigen solution. The complete Freund’s adjuvant was prepared from 4mg of Mycobacterium tuberculosis strain H37RA (Difco) per milliliter of incomplete Freund’s adjuvant (Sigma F5506). The antigen solution was prepared from MBP at 2mg/ml in phosphate buffered saline (PBS).
Rats were anesthetized with an intramuscular injection containing 100mg/kg of ketamine and 10mg.kg of xylazine and were inoculated subcutaneously in the hind limbs with the mixture of MBP/CFA.
Ten days after the injection of the mixture MBP/CFA we had made, after anesthesia of rat with isoflurane, the detection of lymph nodes. Patent Blue V was injected intradermically in the hind limbs. The dye was drained preferentially to the inguineal node, the popliteal node and the iliac node [21]. The rat was controlled during the experiment with a system of anesthesia and temperature control (MINERVE).
Two types of experiments had done. The first consisted in placing the probe on the skin, facing the selected node: inguinal node. We injected the Patent Blue V dye in the limbs and we recorded the signals during about 25 minutes. Several volumes were injected from 15µl to 50µL. During the second, the probe is moved to detect different nodes through the skin and fur.
4. Results
4.1. Phantom study results
The results presented on Fig. 2 correspond to the amplitude variations of backscattered signals at 657nm and 785nm during successive injections of Patent Blue V. When the dye concentration increases, we observe a rapid decrease of the signal intensity at 657nm. This result fulfills the modified Beer-Lambert law (blue plot). In this case we cannot see a significant difference with the Patterson model (red plot). Moreover, the intensity of the signal at 785nm remains relatively constant. The slight increase can be due to the gradual diluting in the solution. The vertical straight line at 1 µmol/L corresponds to the visibility threshold of the dye by the experimenters.
Fig. 2.
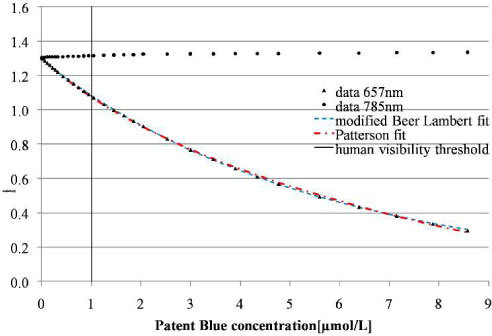
Backscattered signals at 657 and 785 nm recorded during successive injections of Patent Blue V: experimental results and data fitted using the Beer Lambert law and the Patterson model.
To demonstrate the relevance of the Patterson model, another experiment is illustrated in the Fig. 3 . This experiment consists to successive injections of Black Ink India in a solution of intralipid. In this graph we observe variations of the signal at 785nm. We fit our data with the modified Beer-Lambert law and the Patterson law. Both fitting curves were close to the experimental data but the modified Patterson model is more appropriate. Indeed, the residual error is four times lower, and the Patterson model takes into changes in the mean pathlength of light as the absorption increases.
Fig. 3.
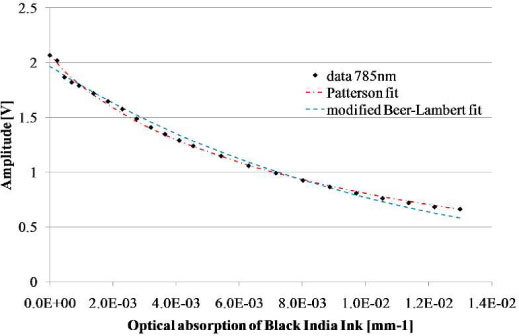
Comparison of the modified Beer-Lambert law and Patterson model applied on data recorded for different concentrations of black India Ink.
Two methods were used to determine the detection threshold of the probe. The first consisted in determining graphically the first value outside the noise of the initial measurement [Fig. 4(a) ]; the second is a graphical plot of ROC curve (Receiver Operating Characteristic) [22]: sensitivity (Se) versus 1- specificity (Sp). The groups of experiments correspond to the number of acquisitions performed in a time series for a given concentration dye. Solution without Patent Blue V dye was used as a reference group, and compared to the other groups obtained after dye injections. We can fully discriminate the third group from the first [Fig. 4(b)] despite of the presence of outliers. With both methods, the detection threshold was estimated to be lower than 3.2.10−2 µmol/L. The eye visible threshold was estimated at about 1 µmol/L (Fig. 2).
Fig. 4.
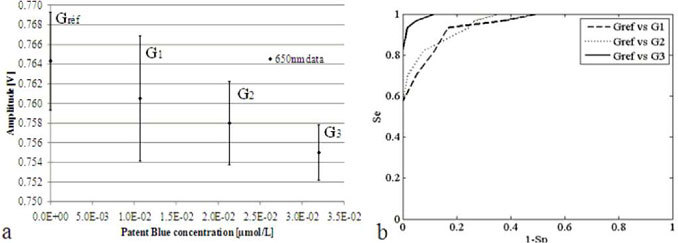
Determination of the detection threshold: a. comparison of successive amplitude of the backscattered signal, b. ROC curve analysis.
We have also considered variations in signal amplitude recorded with a fix probe at different distances from the Intralipid surface. Artifacts come from the reflected light on the sample surface. They can shad the detection, but we demonstrated that the design of the probe allow a significant detection up to a distance of 7 mm.
4.2. Animal experimentation results
Five Lewis rats were inoculated twice with a mixture MPB/CFA (100µL per limb) under anesthesia. After the first injection, all animals have developed acute EAE with inflammation nodes according to with the model [10]. The evolution of weights and clinical signs were correlated with the expectation on this model. Subsequently to the second inoculation, four rats have developed inflammation without apparent clinical signs. Indeed, after palpation we were able to note swollen inflamed nodes sizing about 5 mm.
Two types of measurements were carried out on the four rats bearing inflamed nodes. For each the results are represented graphically. The red curve represents the amplitude’s variations at 785nm, the green curves represent the variations of 650nm signal and the blue curves represents the variations of Patent Blue concentration multiplied by the β factor computed from Eqs. (6) and (7) with the extinction coefficients of tissues corresponding to blood with a saturation coefficient of hemoglobin in oxygen equal to 90%.
We propose in the Fig. 5 an example of result for Patent Blue V injected volume of 50µL. We observe the decrease of the intensity of the signal at 657nm thus the intensity of the signal at 785nm, which is not absorbed by the dye, staying constant during the experiment. The blue curve increases, emphasizes the passage and the accumulation of the dye in the node. The outliers on recorded data at 657nm and 785nm can be interpreted as respiratory movement artifacts.
Fig. 5.
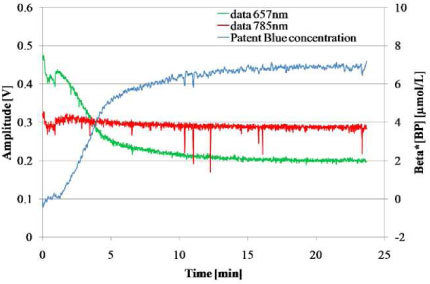
Time variations of the signals at 657 nm and 785 nm and computed relative concentration of dye. Patent Blue V volume injection = 50µL.
The second kind of experiment is shown in Fig. 6 . After an injection of 50µL of Patent Blue V, which is not visible by eye through the fur of the animal, the probe is moved to detect different nodes through the skin and fur.
Fig. 6.
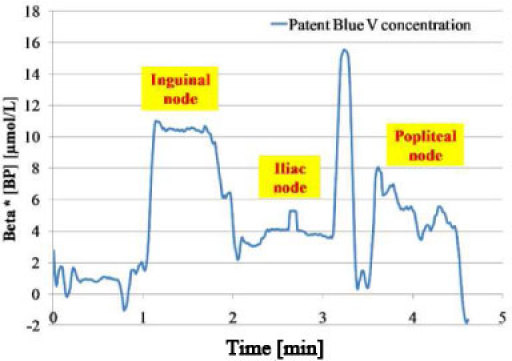
Research of nodes: computed Patent Blue V concentration times β for different positions of the probe.
During the first minute, the probe was on the skin but not facing a node. In this case, the computed value of the Patent Blue V concentration is close to zero. When the probe is moved upon the inguinal node, the accumulation of the dye in this node is illustrated from minute 1 to 2, by the decrease of the amplitude signal at 657nm, the relatively constant amplitude signal at 785nm and the computed value of Patent Blue V concentration (times β) increases to a value of 10µmol/L. The probe is then moved on the iliac node during the second minute and the popliteal node during the third.
The results show the variations of amplitude signal at 657nm in each case the amplitude signal at 785nm was relatively constant during all the experiment. This experiment has allowed us the determination of dye distribution in different nodes. Indeed, we were able to observe three distinct parts on the blue curve representing the three computed concentrations of the dye for three positions of the probe facing nodes.
5. Conclusion and prospects
The developed instrument presents the advantage of working with the Patent Blue V dye which is already used in clinical routine. Herein, we have demonstrated that the probe allows the detection of the dye at ambient light, both in a phantom model and in a small animal model. The phantom model allows us to determine the detection threshold of the probe. The probe in contact with the sample was able to detect concentration of blue as low as 3.2 10−2 µmol/L. During the animal experimentation, the probe has detected the dye accumulation and fixation on different nodes for a very few volume of Patent Blue dye (15µL) through the skin and the fur. Additionally, on the economic aspect, the instrumentation and the dye are available at reasonable cost.
This probe also demonstrates disadvantages such as the absence of quantification in heterogeneous medium, due to the use of the Beer-Lambert law, and the limited depth resolution. To solve these problems, the 4mm separation between the source and the detector can be modified if more depth penetration is needed and power of lasers can be adapted. Moreover, the use of diffuse optical tomography (DOT) could be an alternative to our approach since it should result both in an increase of depth detection and in an improvement of spatial resolution. However, this technique is hardly compatible with intraoperative imaging. One solution would be to use a non contact DOT system, which is still under development in our lab.
Following these results, a study has begun to test our probe in clinical environment. The medical probe based on this new technique allows helping the surgeon diagnostic during the node excision and to detect non eye visible blue node and thus, significantly reduce false negatives. The first measurements in ex vivo conditions, on axillary dissection or zonectomy, has given interesting results but also showed the limit of this very simple device.
In fact, this probe does not completely account the biological tissues absorption, especially absorption due to haemoglobin. Indeed, the two forms of haemoglobin (oxy and deoxy-haemoglobin) have a clearly different molar absorption coefficients at 657nm. At this wavelength, the absorption of the deoxy-haemoglobin is higher that the oxy-haemoglobin. Thus a decrease in blood oxygenation will result in an increase of the absorption at 657nm and will be interpreted by the probe as an increase of dye concentration. To correct this problem, a second probe, with four wavelengths, is being developed, based on the same physical principle. It will measure dye concentration taking into account the blood oxygen saturation
Acknowledgments
This work was performed with the financial assistance of the European convention “Nanomagdye” EP 7-NMP-2007-SMALL Nr214032, and thanks to a research grant from the ANRT (Agence Nationale pour la Recherche et la Technologie).
References and links
- 1.Gould E. A., Winship T., Philbin P. H., Kerr H. H., “Observations on a “sentinel node” in cancer of the parotid,” Cancer 13(1), 77–78 (1960). [DOI] [PubMed] [Google Scholar]
- 2.Cabanas R. M., “An approach for the treatment of penile carcinoma,” Cancer 39(2), 456–466 (1977). [DOI] [PubMed] [Google Scholar]
- 3.Krag D. N., Weaver D. L., Alex J. C., Fairbank J. T., “Surgical resection and radiolocalization of the sentinel lymph node in breast cancer using a gamma probe,” Surg. Oncol. 2(6), 335–340 (1993). 10.1016/0960-7404(93)90064-6 [DOI] [PubMed] [Google Scholar]
- 4.Giuliano A. E., Kirgan D. M., Guenther J. M., Morton D. L., “Lymphatic mapping and sentinel lymphadenectomy for breast cancer,” Ann. Surg. 220(3), 391–401 (1994). 10.1097/00000658-199409000-00015 [DOI] [PMC free article] [PubMed] [Google Scholar]
- 5.Garcia-Manero M., Olartecoechea B., Royo P., “Different injection sites of radionuclide for sentinel lymph node detection in breast cancer: single institution experience,” Eur. J. Obstet. Gynecol. Reprod. Biol. 06.024 (2010). [DOI] [PubMed] [Google Scholar]
- 6.Schijven M. P., Vingerhoets A. J. J. M., Rutten H. J. T., Nieuwenhuijzen G. A. P., Roumen R. M. H., van Bussel M. E., Voogd A. C., “Comparison of morbidity between axillary lymph node dissection and sentinel node biopsy,” Eur. J. Surg. Oncol. 29(4), 341–350 (2003). 10.1053/ejso.2002.1385 [DOI] [PubMed] [Google Scholar]
- 7.Buckle T., van Leeuwen A. C., Chin P. T. K., Janssen H., Muller S. H., Jonkers J., van Leeuwen F. W. B., “A self-assembled multimodal complex for combined pre- and intraoperative imaging of the sentinel lymph node,” Nanotechnology 21(35), 355101 (2010). 10.1088/0957-4484/21/35/355101 [DOI] [PubMed] [Google Scholar]
- 8.Park D. J., Kim H. H., Park Y. S., Lee H. S., Lee W. W., Lee H.-J., Yang H.-K., “Simultaneous indocyanine green and 99mTc-Antimoony sulfur colloid-guided laparoscopic sentinel basin dissection for gastric cancer,” Ann. Surg. Oncol. (2010), doi:. 10.1245/s10434-010-1221-y [DOI] [PubMed] [Google Scholar]
- 9.Song K. H., Kim C., Maslov K., Wang L. V., “Noninvasive in vivo spectroscopic nanorod-contrast photoacoustic mapping of sentinel lymph nodes,” Eur. J. Radiol. 70(2), 227–231 (2009). 10.1016/j.ejrad.2009.01.045 [DOI] [PMC free article] [PubMed] [Google Scholar]
- 10.Pan D., Pramanik M., Senpan A., Ghosh S., Wickline S. A., Wang L. V., Lanza G. M., “Near infrared photoacoustic detection of sentinel lymph nodes with gold nanobeacons,” Biomaterials 31(14), 4088–4093 (2010). 10.1016/j.biomaterials.2010.01.136 [DOI] [PMC free article] [PubMed] [Google Scholar]
- 11.Zhang C., Wang S., Xiao J., Tan X., Zhu Y., Su Y., Cheng T., Shi C., “Sentinel lymph node mapping by a near-infrared fluorescent heptamethine dye,” Biomaterials 31(7), 1911–1917 (2010). 10.1016/j.biomaterials.2009.11.061 [DOI] [PubMed] [Google Scholar]
- 12.Wunderbaldinger P., Turetschek K., Bremer C., “Near-infrared fluorescence imaging of lymph nodes using a new enzyme sensing activatable macromolecular optical probe,” Eur. Radiol. 13(9), 2206–2211 (2003). 10.1007/s00330-003-1932-6 [DOI] [PubMed] [Google Scholar]
- 13.Chu M., Wan Y., “Sentinel lymph node mapping using near-infrared fluorescent methylene blue,” J. Biosci. Bioeng. 107(4), 455–459 (2009). 10.1016/j.jbiosc.2008.11.011 [DOI] [PubMed] [Google Scholar]
- 14.Hojo T., Nagao T., Kikuyama M., Akashi S., Kinoshita T., “Evaluation of sentinel node biopsy by combined fluorescent and dye method and lymph flow for breast cancer,” Breast 19(3), 210–213 (2010). 10.1016/j.breast.2010.01.014 [DOI] [PubMed] [Google Scholar]
- 15.Hirche C., Murawa D., Mohr Z., Kneif S., Hünerbein M., “ICG fluorescence-guided sentinel node biopsy for axillary nodal staging in breast cancer,” Breast Cancer Res. Treat. 121(2), 373–378 (2010). 10.1007/s10549-010-0760-z [DOI] [PubMed] [Google Scholar]
- 16.Newton D. W., Breen P. J., Brown D. E., Mackie J. F., Jr, Kluza R. B., “Physicochemical characteristics of patent blue violet dye,” J. Pharm. Sci. 70(2), 122–127 (1981). 10.1002/jps.2600700203 [DOI] [PubMed] [Google Scholar]
- 17.Contini D., Martelli F., Zaccanti G., “Photon migration through a turbid slab described by a model based on diffusion approximation. I. Theory,” Appl. Opt. 36(19), 4587–4599 (1997). 10.1364/AO.36.004587 [DOI] [PubMed] [Google Scholar]
- 18.Flock S. T., Jacques S. L., Wilson B. C., Star W. M., van Gemert M. J. C., “Optical properties of Intralipid: a phantom medium for light propagation studies,” Lasers Surg. Med. 12(5), 510–519 (1992). 10.1002/lsm.1900120510 [DOI] [PubMed] [Google Scholar]
- 19.J. Moblay, and T. Vo-Dinh, Biomedical photonics handbook, (CRC Press, 2003), Chap. 2. [Google Scholar]
- 20.Namaer I. J., Steibel J., Poulet P., Armspach J. P., Mauss Y., Chambron J., “In vivo dynamic MR imaging of MBP-induced acute experimental allergic encephalomyelitis in Lewis rat,” Magn. Reson. Med. 24(2), 325–334 (1992). 10.1002/mrm.1910240213 [DOI] [PubMed] [Google Scholar]
- 21.Tilney N. L., “Patterns of lymphatic drainage in the adult laboratory rat,” J. Anat. 109(Pt 3), 369–383 (1971). [PMC free article] [PubMed] [Google Scholar]
- 22.Metz C. E., “Basic principles of ROC analysis,” Semin. Nucl. Med. 8(4), 283–298 (1978). 10.1016/S0001-2998(78)80014-2 [DOI] [PubMed] [Google Scholar]


