Abstract
The influence of chromatic aberration of an objective lens in two-photon fluorescence (TPF) endospectroscopy of scattering media has been systematically investigated through both experiments and numerical simulations. Experiments were carried out on a uniform 3D scattering gelatin phantom embedded with TiO2 granules (to mimic tissue scattering) and fluorescein-tagged polystyrene beads. It was found that fluorescence spectral intensity and lineshape varied as a function of depth when measured with a gradient-index (GRIN) lens which has severe chromatic aberration. The spectral distortion caused by the chromatic aberration became diminishing as the imaging depth increased. Ray tracing analysis and Monte Carlo simulations were carried out to study the interplay of chromatic aberration and scattering in the depth-resolved TPF spectra. The simulation results suggest that the collected fluorescence signals from deeper layers included more out-of-focus photons that experienced a few or multiple scatterings, which diminish the influence of chromatic aberration on the measured TPF spectra. The simulated collection efficiencies of TPF at different wavelengths and depths can be used to properly recover the true depth-resolved TPF spectra of a relatively uniform scattering medium.
OCIS codes: (300.6420) Spectroscopy, nonlinear; (290.0290) Scattering
1. Introduction
Nonlinear optical microscopy including two-photon fluorescence (TPF) and second harmonic generation (SHG) has been widely explored for high-resolution three-dimensional structural and functional tissue imaging [1–3]. Recently, there has been increasing interest in developing a fiber-optic nonlinear endomicroscopy technology to transform standard TPF/SHG microscopy for in vivo studies and clinical applications [4–10]. In a compact and flexible TPF/SHG endomicroscope, a single double-clad fiber (DCF) has been employed for both single-mode laser excitation delivery with the core and efficient TPF/SHG collection with the multimode inner clad (plus the core), which can make the overall diameter of the endomicroscope probe small enough to go through the accessory port of a standard endoscope [7,10]. However, one major challenge associated with such a single-fiber configuration is that the miniature objective lens needs to handle a wide optical spectrum from NIR excitation (e.g. 800 nm) to visible TPF/SHG wavelengths (e.g. 400-650 nm). If the imaging optics has chromatic aberration, the back focus of the TPF/SHG signals on the collection path will fall in front of the DCF tip [9]. As a result, the collection efficiency of the TPF/SHG signals from the focal volume inside the samples will be greatly reduced. Such loss is wavelength dependent, and will distort the fluorescence spectral lineshape, making it difficult to accurately interpret the measured nonlinear fluorescence spectrum.
In highly scattering biological tissues, the situation can become more complicated since the collected fluorescence signals might partially come from outside the focal volume due to a few or multiple scatterings. In this study, we investigate the combined effects of chromatic aberration and scattering on depth-resolved two-photon fluorescence spectra measured by a fiber-optic endomicroscope. Experiments and Monte Carlo simulations were carried out on a uniform 3D scattering gelatin phantom embedded with TiO2 granules (to mimic tissue scattering [11]) as well as fluorescent beads. It was found that TPF spectral lineshape varied as a function of depth when measured with a GRIN lens which has severe chromatic aberration. The spectral distortion caused by the chromatic aberration became diminishing as the imaging depth increased. The results suggest that the collected fluorescence signals include more out-of-focus photons that experience a few or multiple scatterings and those out-of-focus photons diminish the influence of chromatic aberration on the measured fluorescence spectra. An appropriate calibration method is thus required in depth-resolved TPF spectral measurements to restore the true depth-dependent fluorescence spectra.
2. Experimental setup and simulation scheme
2.1 Fiber-optic two-photon fluorescence endospectroscopy
Figure 1(a) shows the schematic of the excitation and collection beam path of the endospectroscopy probe. The single-mode core (5.1 μm diameter and 0.15 NA) of the DCF was used to delivery the excitation, while the inner clad layer (135 μm and 0.3 NA) was used for the collection of nonlinear optical signals. As can be seen, the back focus of the nonlinear optical signals will fall in front of the DCF tip when the imaging optics has chromatic aberration. For example, using a GRIN lens with a magnification of 0.5 (along the excitation direction from the fiber tip to the sample), the focal shift is about 1 mm for TPF signals at 450 nm, and the TPF collection efficiency is only 5% (for a transplant sample) compared to a perfect achromatic lens (with which the collection efficiency is assumed at 100% as a standard for the endomicroscope).To quantitatively analyze the effects of chromatic aberration and scattering, two focusing lens units were utilized in this study: one was a single GRIN lens (of 1.8 mm diameter from NSG, PCH-180-020-083), and the other was a perfect achromatic lens composed of two microscope objective lenses (10x/0.2NA and 20x/0.4NA from Zeiss, Epiplan). Both configurations had a magnification of 0.5 from the DCF tip to sample, an NA of 0.3 for the excitation on the sample (which is determined by the DCF core NA~0.15 and the magnification), and an effective collection NA of 0.4 from the sample (which is limited by the maximal NA of the lenses, not by the DCF inner clad NA~0.3 or the magnification).
Fig. 1.
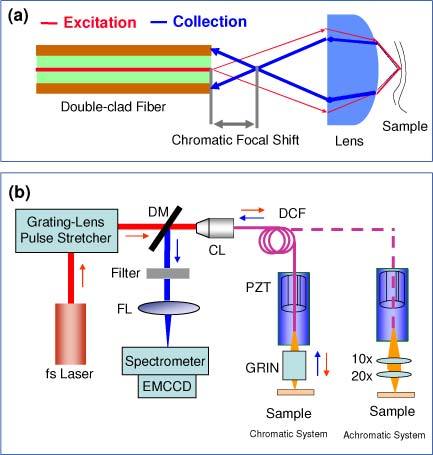
(a) Schematic of the beam paths of double-clad fiber based endospectroscopy probe; (b) Schematic of the endospectroscopy system with chromatic and achromatic lenses. DM: dichroic mirror; FL: focusing lens; CL: coupling lens; DCF: double-clad fiber; PZT: piezoelectric transducer. In the aberrated system, a GRIN lens was used as the focusing unit. In the perfect achromatic system, a 10x/0.2NA Zeiss microscope objective was used to collimate the light from DCF, and a 20x/0.4 NA Zeiss microscope objective was used to focus the light to the sample.
Figure 1(b) shows the schematic of the fiber-optic endospectroscopy system. The fs laser (e.g. centered at 800 nm) was firstly launched into a standard grating/lens pair for pulse dispersion compensation, and then coupled into the core of DCF. The TPF signals were collected back through the same DCF, separated from the excitation light at the proximal end of the probe by a dichroic mirror, then directed to a spectrometer and detected with an EMCCD. A miniature PZT based fiber-optic resonant scanner was used [7,10,12], producing a scanning area of a diameter 160 µm in the focal plane with a frame rate of ~3 Hz. The fluorescence spectral signals were averaged over 1 second (about 3 frames) at a given depth. Depth-resolved fluorescence spectral measurements were achieved by moving the probe with respect to the sample with a precision translation stage. The combined effects of chromatic aberration and scattering on depth-resolved two-photon fluorescence spectra were investigated using a uniform tissue phantom made of gelatin embedded with 4.8-µm beads tagged with fluorescein. To mimic the background scattering in biological tissues (normal squamous epithelium), the phantom was also mixed with TiO2 granules at a concentration of 1 mg/ml.
2.2 Simulation Scheme
Figure 2 shows the two-photon excitation and collection geometry used for the simulation, which is equivalent to the depth-resolved endospectroscopy system. The simulation model was split into four parts: (1) the distribution of the excitation photons at 800 nm inside the sample based on Monte Carlo simulation; (2) the production of the TPF photons at 400-650 nm that is determined from the square of the excitation intensity distribution while assuming uniform two-photon absorption cross section for simplicity; (3) the propagation of the TPF photons at 400-650 nm inside the sample based on Monte Carlo simulation; and (4) the collection of TPF photons that escape from the sample based on the geometrical ray tracing simulation.
Fig. 2.
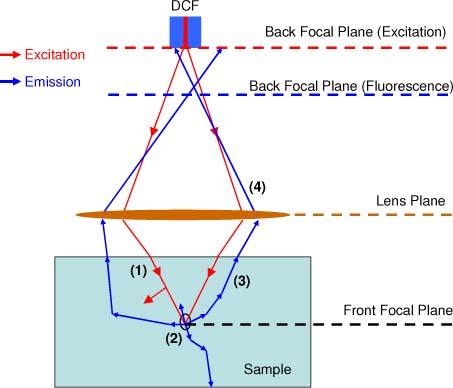
Geometry of the two-photon excitation and collection used in the combined ray-tracing simulation and Monte Carlo model.
In calculating the excitation light distribution (as indicated by the red lines in Fig. 2), photons were launched from the single-mode core of the DCF into the tissue in a focused beam geometry by an objective lens. The distribution and the initial directions of the excitation photons on the sample surface were determined by the NA and diameter of the DCF core, so that in the absence of tissue scattering, the intensity profile at the focus would approximate a diffraction-limited spot. After the excitation photons were launched into the sample, they propagated with a variable weight according to standard Monte Carlo methods for scattering (based on a random step and directional cosine) and absorption (based on a loss of the weight at each scattering event) [13,14].
When the excitation intensity distribution inside the sample were established, the corresponding two-photon absorption profiles inside the sample were calculated by the square of the excitation intensity (i.e., the weight of excitation photons) [15,16]. The emitted TPF photons were firstly isotropic, and then traveled according to the standard Monte Carlo simulation process again (as indicated by the blue lines in Fig. 2). For each TPF photon exiting from the top surface of the sample (with a refractive index of 1.4), the coordinate at which it reached the lens and the detector plane can be computed by the last directional cosine and the geometric ray trace [11]. A TPF photon was finally counted as detected if its position in the detector plane fell within the acceptance angle and area of the inner clad and the core of the DCF. We dumped enough excitation photons to the sample and make sure that the collected TPF photons had an uncertainty of less than 1%. Here, during the analysis of geometrical ray tracing, only the chromatic aberration of the lenses was taken into account. The pulse duration (~250 fs) was not considered in the simulation as it is much shorter than fluorescence collection time per image pixel (a few microseconds). For the GRIN lens, the chromatic focal shifts at some typical TPF wavelengths were calculated based on geometric ray tracing simulation [11] and listed in Table 1 . The optical properties (including absorption coefficient µa, scattering coefficient µs, and anisotropy g) of the uniform tissue phantom (similar to normal non-keratinized squamous epithelium) at the excitation and TPF wavelengths are also listed in Table 1, which is based on a combination of references in the literature [17–20].
Table 1. Optical properties of the phantom and the chromatic focal shift of the GIRN lens used in the simulations at the excitation and emission wavelengths.
| Wavelength (nm) |
|||||||
|---|---|---|---|---|---|---|---|
| Property | 800 | 650 | 600 | 550 | 500 | 450 | 400 |
| µa (cm−1) | 1.11 | 1.31 | 1.47 | 1.54 | 1.90 | 2.52 | 3.32 |
| µs (cm−1) | 23.1 | 26.8 | 28.7 | 31.9 | 34.7 | 39.4 | 42.6 |
| g | 0.970 | 0.955 | 0.953 | 0.948 | 0.943 | 0.940 | 0.937 |
| Chromatic focal shift (mm) of GRIN lens | 0 | 0.322 | 0.421 | 0.547 | 0.715 | 0.932 | 1.225 |
3. Results and discussions
3.1 Experimental results
Figure 3(a) shows representative depth-resolved fluorescence spectra of the fluorescent phantom measured by the endomicroscope equipped with the GRIN lens at imaging depths of 0 (surface), 100 and 200 µm. The spectra (without considering the wavelength dependent transmission efficiency of the imaging and detection system) were normalized individually at the wavelength of 540 nm. Although the transmission efficiency of the lenses is needed in order to recover the real spectrum [21], the spectral distortion due to the transmission efficiency should be the same for all depths, and thus the calibration of the transmission efficiency is not considered in this study. As can be seen, with the increase of the sampling depth, TPF signals relatively increase at shorter wavelength (470-540 nm) and decrease at longer wavelengths (540-610 nm). By contrast, depth-resolved TPF spectra measured with the achromatic objective lens exhibit almost no change (data not shown), suggesting that scattering alone (without chromatic aberration) do not cause significant depth-dependent spectral variations. Thus, the depth-resolved TPF spectra acquired with a GRIN lens (or a generic lens with chromatic aberration) in Fig. 3(a) is modulated under the interplay of the wavelength-dependent chromatic aberration and scattering, suggesting scattering takes effect only when chromatic aberration exists. Considering shorter wavelengths experience strong scattering, there is a better chance for those photons to reach shallower depths (before the focal point) through scattering, which will then be imaged back to the DCF tip by a chromatic lens. As for an achromatic lens, it always sees the photons scattered back from the focal point. In comparison, a chromatic lens will thus see an increase on the shorter wavelength side, but not with an achromatic lens.
Fig. 3.
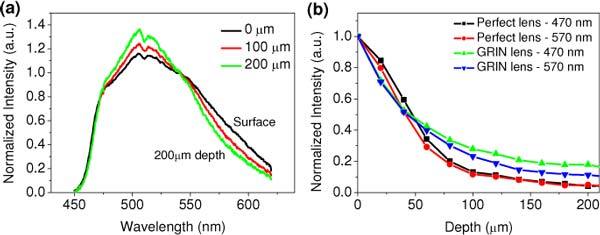
(a) Normalized depth-resolved TPF spectra of the fluorescent beads phantom when measured with the GRIN lens; (b) Normalized depth-dependent TPF intensities at 470 nm and 570 nm when measured with the GRIN lens and achromatic microscope objective lens.
Figure 3(b) shows the normalized depth-resolved fluorescence intensities as a function of depth at two typical wavelengths (i.e., 470 nm and 570 nm) measured with the GRIN lens and the achromatic lens. As shown, there is not much difference between the depth-dependent intensities at 470 nm and 570 nm measured with the achromatic lens. However, the depth-dependent intensities at both wavelengths measured with the GRIN lens exhibit lower attenuation compared with the achromatic lens. It is also noted that the depth-dependent intensities at 470 nm show slow attenuation compared to 570 nm when measured with the GRIN lens. These intensity decay trends indicate that large chromatic aberration in GRIN lens at shorter wavelengths, which correspond to larger focal shifts, will collect more out-of-focus photons (again at shorter wavelengths) that experience a few or multiple scatterings; thus short wavelength photons become to contribute more due to higher scattering at short wavelengths.
Figure 4(a) compares the normalized TPF spectra from the superficial layer of the phantom measured respectively by the GRIN lens and the achromatic lens. Assuming the spectrum measured with the achromatic lens is a true one, we can see that the spectrum measured with the GRIN lens is severely distorted with higher signals at longer wavelengths. It is consistent with that the GRIN lens has less chromatic aberration (focal shift) and thus better endomicroscopy collection efficiency at longer wavelengths. However, the spectra from deeper layer (at 240 µm depth) acquired with the GRIN lens and the achromatic lens are almost identical, as shown in Fig. 4(b). The diminishing influence of the chromatic aberration on the fluorescence spectra at deeper layers suggest that the system could detect more out-of focus TPF photons that experience a few or multiply scatterings than those directly from the focal volume.
Fig. 4.
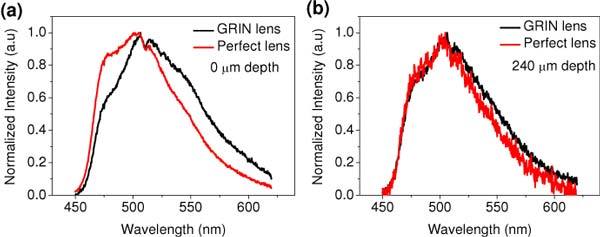
Normalized TPF spectra of the beads phantom measured with the GRIN lens and the achromatic microscope objective lens from (a) surface and (b) 240 µm depth.
3.2 Simulation results
To quantitatively analyze the interplay of the chromatic aberration and scattering, combined Monte Carlo and ray tracing simulations were performed to investigate the wavelength-dependent depth-resolved TPF intensities measured with the GRIN lens and the DCF in turbid samples. Figures 5(a) and (b) show the representative simulation results on the absolute and normalized depth-resolved TPF photons at three typical wavelengths (i.e., 400, 500, and 650 nm) collected with the GRIN lens, respectively. The simulated depth-resolved TPF photons at the wavelength of 650 nm collected by the perfect lens (i.e., without chromatic aberration) are also shown in the figures as references. As can be seen from Fig. 5(a), absolute TPF photons collected by the GRIN lens at all depths and wavelengths is much less compared to the achromatic lens; and using the GRIN lens, the absolute TPF photons at shorter wavelength is far less than those at longer wavelength. Obviously, this trend is caused by the chromatic aberration of the GRIN lens with which a shorter wavelength corresponds to a larger chromatic focal shift. But in the meanwhile, it is interesting to note that the normalized depth-resolved TPF intensities exhibit wavelength dependent, as shown in Fig. 5(b). TPF photons collected with the achromatic lens show a faster attenuation compared to the GRIN lens, and with a GRIN lens TPF at longer wavelengths (e.g. 650 nm) show a faster attenuation compared to shorter wavelengths (e.g. 400 nm). These intensity decay trends are consistent with the experimental results (see Fig. 3b), indicating that larger chromatic aberration in GRIN lens at shorter wavelengths will relatively reduce the number of photons coming directly from the focal volume to be collected, and instead more out-of-focus photons, which experience a few or multiple scatterings with the increase of the imaging depth, are collected.
Fig. 5.
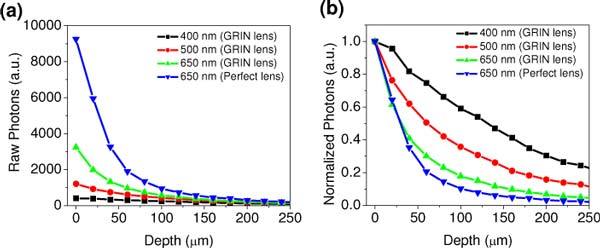
Simulated depth-resolved TPF photons at 400, 500, and 650 nm collected with a GRIN lens and TPF photons at 650 nm collected with an achromatic lens: (a) total detected photons; (b) after normalization.
In order to understand the origin of the combined influences of the chromatic aberration and scattering, we simulated the contributions of the two kinds of TPF photons (i.e., directly from the focus or experiencing multiple scatterings) to the total collected photons. As representative simulation results, Figs. 6(a) and (b) show the depth-dependent collected TPF photons with single scattering and multiple scatterings (2-20 events) respectively at 650 nm and 400 nm. With less chromatic focal shift at 650 nm, the collected photons at the imaging depths of 0-100 µm are dominated by those directly coming from the focal volume (with single scattering event); whereas the collected photons between single scattering and multiple scatterings are comparable at the imaging depths of 120-200 µm. By contrast, with a larger chromatic focal shift at 400 nm, at increased imaging depths (except at the superficial layer from 0 to 40 µm) the collected photons are dominated by those experiencing multiple scattering. Overall, chromatic aberration makes the detection less sensitive to the photons that directly come from the focal volume, and relatively more photons that experience multiple scatterings will be collected, which slows down the attenuation of the total TPF photons with the increase of imaging depth.
Fig. 6.
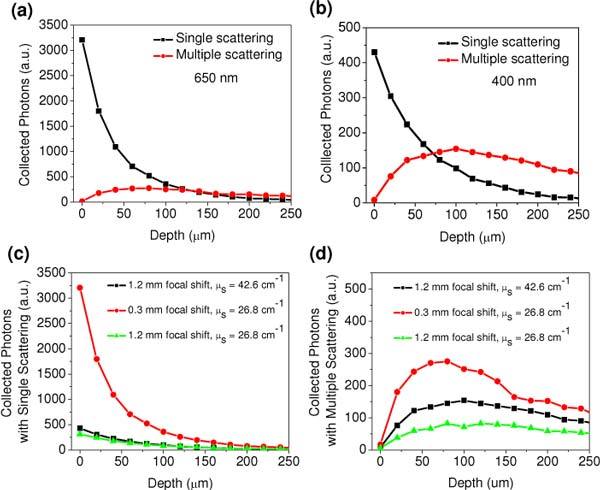
(a & b) Simulated TPF photons with single scattering and multiple scattering at (a) 650 nm and (b) 450 nm; (c & d) Simulated TPF photons at different chromatic focal shifts (0.3 and 1.2 mm) and scattering coefficients (26.8 and 42.6 cm−1) with (c) single scattering event and (d) multiple scattering events.
To further investigate the interplay of the chromatic aberration and scattering, we simulated the depth-resolved fluorescence with different combinations of chromatic focal shift and scattering coefficient including (c1) the parameters at 400 nm: focal shift = 1.2 mm and μs = 42. 6 cm−1; (c2) the parameters of 650 nm: focal shift = 0.3 mm and μs = 26.8 cm−1; (c3) a focal shift of 1.2 mm and a μs of 26.8 cm−1. Figures 6(c) and (d) compare the collected depth-resolved photons with single scattering and with multiple scattering, respectively. Comparing the results on c2 and c3 in Figs. 6(c-d), it is obvious that larger chromatic focal shift at the same scattering coefficient will cause larger loss in the collection of photons with single scattering (maximally by a factor of ~10) compared to the photons with multiple scattering (maximally by a factor of ~4). As a result, the depth-dependent attenuation is slower at larger chromatic aberration (e.g. at 400 nm with GRIN lens as shown in Fig. 5(b)). Comparing the results on c1 and c3, it is also reasonable that there is almost not difference between different scattering coefficients in the collection of the photons with single scattering (Fig. 6(c)), whereas more multiply scattering photons are collected with a higher scattering coefficient (Fig. 6(d)). Therefore, a larger scattering coefficient (at shorter wavelengths) will further slow down the attenuation of the depth-resolved TPF intensity (e.g., at 650 nm and 400 nm with GRIN lens as shown in Fig. 5(b)). Overall, this simulation result verifies the assumption stated in the experimental results, namely, larger chromatic aberration in a GRIN lens at shorter wavelengths will preferentially collect more multiply scattered photons over ballistic photons (again at shorter wavelengths) .
These intensity decay trends also indicate that the collection efficiency of the TPF photons using a lens with chromatic aberration over an achromatic lens in scattering medium is not only wavelength-dependent, but also depth dependent. Figure 7(a) quantitatively describes the simulated collection efficiency of the TPF photons at the whole spectrum and several typical depths of 0, 100 and 240 µm. As shown, at the tissue surface, the collection efficiency of the TPF at 650 nm is ~35%, whereas at 400 nm it is only ~3%; while at 240 μm depths, the collection efficiency of the TPF increases ~2 folds to 74% at 650 nm and ~9 folds to ~28% at 400 nm. The relatively increased collection efficiency at shorter wavelengths in greater depths is consistent with the experimental results. Again, this phenomenon is caused by the chromatic aberration of the GRIN lens with the presence of multiple scattering effects.
Fig. 7.
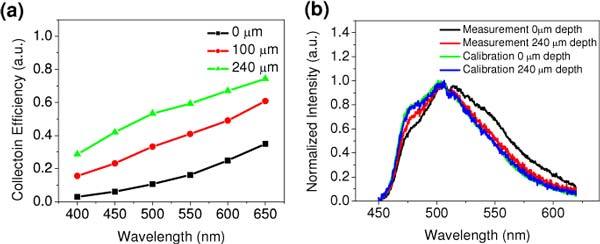
(a) Simulated collection efficiency of the TPF photons from the surface, 100 µm and 240 µm depth. The collection efficiency is defined as the ratio of the chromatic system to the achromatic system at each wavelength and depth. (b) Measured and calibrated depth-resolved TPF spectra acquired with the GRIN lens.
This wavelength-dependent collection efficiency will cause different spectral distortion at different imaging depths (i.e., less distortion at deeper layer), which will lead to difficulty in the interpretation of the spectral features (like tissue autofluorescence) and the related biochemical information (like tissue’s redox ratio). An appropriate calibration method is thus required in depth-resolved TPF spectral measurements to restore the true depth-dependent fluorescence spectra. For a given depth, after dividing the measured spectral data by the simulated collection efficiency of the GRIN lens (in Fig. 7a), the measured depth-resolved fluorescence spectra could be calibrate/restored. As shown in Fig. 7(b), the calibrated spectral lineshapes at the two depths are almost identical and close to the one measured with the achromatic lens. Overall, the fluorescence spectral distortion due to the dual effects of chromatic aberration and scattering is complicated, but could be quantitatively analyzed/corrected with the numerical simulations.
In order to reduce the adverse effect of the chromatic aberration of the GRIN lens and to increase the collection efficiency, we can use a DCF with larger inner diameter (e.g. ~200 µm), or add a short piece of multimode fiber at the tip of the DCF (e.g. 350 µm long). As we have demonstrated, the short piece of multimode fiber does not affect the excitation beam, but it will guide more nonlinear optical signals to the DCF since it shortens the distance between the back focal point and the fiber collector surface [9]. To investigate how the two methods will change the distortion of the depth-resolved TPF in a scattering medium, the collected TPF photons as a function of wavelength and depth were simulated at different collector configurations, i.e., (1) DCF with 135 µm inner diameter; (2) DCF with 135 µm inner diameter plus a 350 µm long MMF collector; (3) DCF with 200 µm inner diameter.
It was found that the MMF and larger DCF involve different mechanisms in the enhancement of the collection efficiency measured with a GRIN lens comparing to an achromatic lens. When using the DCF of a 200 µm inner-clad diameter, the enhanced collection efficiency (by a factor of ~2 over the DCF with 135 µm diameter) does not exhibit strong depth- and wavelength- dependence, as shown in Fig. 8 (a) . This result suggests that a DCF with a different collection area will not change the degree of the spectral distortion. However, with the MMF collector, the enhanced collection efficiency is a function of both wavelength and imaging depth, as can be seen from Fig. 8 (b). At the tissue surface, the factor of the enhancement varies from 1.8 at 400 nm to 3.5 at 650 nm (the plateau from 550 to 650 nm shows that there is not any loss in the collection efficiency compared to an achromatic lens), whereas at the image depth of 100 µm, the enhancement just gradually increases from ~1.5 at 400 nm to ~2 at 650 nm. This difference indicates that a MMF collector will result in larger spectral distortion at sample surface, and further increase the variation of the depth-resolved spectral lineshape. Actually, the MMF moves the back focus of the GRIN lens on the return path closer to the collector surface, and thus equivalently makes the imaging optics less chromatic aberration, which significantly increases the collection efficiency of the photons that directly come from the focal volume. However, the chromatic focal shift is an exponential function of wavelength, and the MMF (not long enough to correct all wavelengths) relatively increases the collection efficiency of the photons at longer wavelength. Overall, DCF and MMF collector plays different roles in the enhancement of the collection efficiency, which causes different depth-dependent spectral distortions.
Fig. 8.
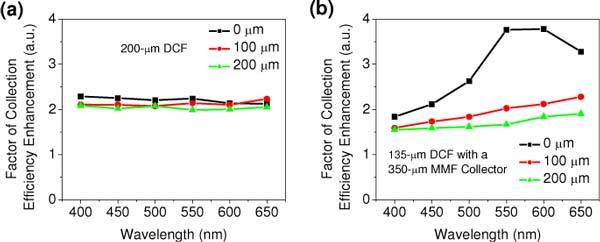
(a) Factor of collection efficiency enhancement of TPF spectral signals from the surface, 100 µm and 240 µm depth when using (a) a double-clad fiber with 200 µm inner clad; and (b) a 350 um long multimode fiber collector over a double-clad fiber with 135 µm inner clad.
4. Conclusion
In summary, chromatic aberration of imaging optics in TPF endospectroscopy of scattering phantom has been systematically investigated through both experiments and numerical simulations. The distortion of the depth-resolved TPF spectral lineshape and intensities reveals that scattering can overwhelm the chromatic aberration when imaging deeper layers, where the measured TPF signals consist of more a few or multiply scattered out-of-focus photons rather than those directly from the focal volume by single scattering. The spectral distortion varies as a function of chromatic focal shift, imaging depth and collection configuration. And thus, an appropriate calibration method is required in depth-resolved TPF spectral measurements to restore the true fluorescence spectra. We found the true depth-dependent fluorescence spectra can be restored by normalizing the measured spectral data with the simulated wavelength-dependent collection efficiency of the focusing unit. This method in principle works well in a relatively homogeneous turbid medium. Ultimately a miniature achromatic lens is highly desirable for a nonlinear optical imaging endomicroscope in order to minimize the distortion in the depth-resolved two-photon fluorescence measurements in turbid tissues.
Acknowledgments
The authors gratefully acknowledge the grant support from the National Institutes of Health (CA120480 and CA116442) and the National Science Foundation (Career Award -XDL).
References and Links
- 1.Denk W., Strickler J. H., Webb W. W., “Two-photon laser scanning fluorescence microscopy,” Science 248(4951), 73–76 (1990). 10.1126/science.2321027 [DOI] [PubMed] [Google Scholar]
- 2.Guo Y. C., Ho P. P., Savage H., Harris D., Sacks P., Schantz S., Liu F., Zhadin N., Alfano R. R., “Second-harmonic tomography of tissues,” Opt. Lett. 22(17), 1323–1325 (1997). 10.1364/OL.22.001323 [DOI] [PubMed] [Google Scholar]
- 3.Zipfel W. R., Williams R. M., Christie R., Nikitin A. Y., Hyman B. T., Webb W. W., “Live tissue intrinsic emission microscopy using multiphoton-excited native fluorescence and second harmonic generation,” Proc. Natl. Acad. Sci. U.S.A. 100(12), 7075–7080 (2003). 10.1073/pnas.0832308100 [DOI] [PMC free article] [PubMed] [Google Scholar]
- 4.Levene M. J., Dombeck D. A., Kasischke K. A., Molloy R. P., Webb W. W., “In vivo multiphoton microscopy of deep brain tissue,” J. Neurophysiol. 91(4), 1908–1912 (2004). 10.1152/jn.01007.2003 [DOI] [PubMed] [Google Scholar]
- 5.Jung J. C., Mehta A. D., Aksay E., Stepnoski R., Schnitzer M. J., “In vivo mammalian brain imaging using one- and two-photon fluorescence microendoscopy,” J. Neurophysiol. 92(5), 3121–3133 (2004). 10.1152/jn.00234.2004 [DOI] [PMC free article] [PubMed] [Google Scholar]
- 6.Flusberg B. A., Jung J. C., Cocker E. D., Anderson E. P., Schnitzer M. J., “In vivo brain imaging using a portable 3.9 gram two-photon fluorescence microendoscope,” Opt. Lett. 30(17), 2272–2274 (2005). 10.1364/OL.30.002272 [DOI] [PubMed] [Google Scholar]
- 7.Myaing M. T., MacDonald D. J., Li X. D., “Fiber-optic scanning two-photon fluorescence endoscope,” Opt. Lett. 31(8), 1076–1078 (2006). 10.1364/OL.31.001076 [DOI] [PubMed] [Google Scholar]
- 8.Fu L., Jain A., Xie H. K., Cranfield C., Gu M., “Nonlinear optical endoscopy based on a double-clad photonic crystal fiber and a MEMS mirror,” Opt. Express 14(3), 1027–1032 (2006). 10.1364/OE.14.001027 [DOI] [PubMed] [Google Scholar]
- 9.Wu Y. C., Xi J. F., Cobb M. J., Li X. D., “Scanning fiber-optic nonlinear endomicroscopy with miniature aspherical compound lens and multimode fiber collector,” Opt. Lett. 34(7), 953–955 (2009). 10.1364/OL.34.000953 [DOI] [PMC free article] [PubMed] [Google Scholar]
- 10.Wu Y. C., Leng Y. X., Xi J. F., Li X. D., “Scanning all-fiber-optic endomicroscopy system for 3D nonlinear optical imaging of biological tissues,” Opt. Express 17(10), 7907–7915 (2009). 10.1364/OE.17.007907 [DOI] [PMC free article] [PubMed] [Google Scholar]
- 11.Cang H., Sun T., Li Z. Y., Chen J. Y., Wiley B. J., Xia Y. N., Li X. D., “Gold nanocages as contrast agents for spectroscopic optical coherence tomography,” Opt. Lett. 30(22), 3048–3050 (2005). 10.1364/OL.30.003048 [DOI] [PubMed] [Google Scholar]
- 12.Liu X. M., Cobb M. J., Chen Y. C., Kimmey M. B., Li X. D., “Rapid-scanning forward-imaging miniature endoscope for real-time optical coherence tomography,” Opt. Lett. 29(15), 1763–1765 (2004). 10.1364/OL.29.001763 [DOI] [PubMed] [Google Scholar]
- 13.Dunn A. K., Smithpeter C., Welch A. J., Richards-Kortum R., “Sources of contrast in confocal reflectance imaging,” Appl. Opt. 35(19), 3441–3446 (1996). 10.1364/AO.35.003441 [DOI] [PubMed] [Google Scholar]
- 14.Schmitt J. M., Ben-Letaief K., “Efficient Monte Carlo simulation of confocal microscopy in biological tissue,” J. Opt. Soc. Am. A 13(5), 952–961 (1996). 10.1364/JOSAA.13.000952 [DOI] [PubMed] [Google Scholar]
- 15.Dunn A. K., Wallace V. P., Coleno M., Berns M. W., Tromberg B. J., “Influence of optical properties on two-photon fluorescence imaging in turbid samples,” Appl. Opt. 39(7), 1194–1201 (2000). 10.1364/AO.39.001194 [DOI] [PubMed] [Google Scholar]
- 16.Beaurepaire E., Oheim M., Mertz J., “Ultra-deep two-photon fluorescence excitation in turbid media,” Opt. Commun. 188(1-4), 25–29 (2001). 10.1016/S0030-4018(00)01156-1 [DOI] [Google Scholar]
- 17.Qu J. N., Macaulay C., Lam S., Palcic B., “Optical properties of normal and carcinomatous bronchial tissue,” Appl. Opt. 33(31), 7397–7405 (1994). 10.1364/AO.33.007397 [DOI] [PubMed] [Google Scholar]
- 18.Drezek R., Sokolov K., Utzinger U., Boiko I., Malpica A., Follen M., Richards-Kortum R., “Understanding the contributions of NADH and collagen to cervical tissue fluorescence spectra: modeling, measurements, and implications,” J. Biomed. Opt. 6(4), 385–396 (2001). 10.1117/1.1413209 [DOI] [PubMed] [Google Scholar]
- 19.Collier T., Arifler D., Malpica A., Follen M., Richards-Kortum R., “Determination of epithelial tissue scattering coefficient using confocal microscopy,” IEEE J. Quantum Electron. 9(2), 307–313 (2003). 10.1109/JSTQE.2003.814413 [DOI] [Google Scholar]
- 20.Chang S. K., Arifler D., Drezek R., Follen M., Richards-Kortum R., “Analytical model to describe fluorescence spectra of normal and preneoplastic epithelial tissue: comparison with Monte Carlo simulations and clinical measurements,” J. Biomed. Opt. 9(3), 511–522 (2004). 10.1117/1.1695559 [DOI] [PubMed] [Google Scholar]
- 21.König K., Ehlers A., Riemann I., Schenkl S., Bückle R., Kaatz M., “Clinical two-photon microendoscopy,” Microsc. Res. Tech. 70(5), 398–402 (2007). 10.1002/jemt.20445 [DOI] [PubMed] [Google Scholar]


