Abstract
With an optical fiber probe, we acquired spectra from swine tissue between 500 and 1600 nm by combining a silicon and an InGaAs spectrometer. The concentrations of the biological chromophores were estimated by fitting a mathematical model derived from diffusion theory. The advantage of our technique relative to those presented in previous studies is that we extended the commonly-used wavelength ranges of 500 and 1000 nm to include the range of 1000 to 1600 nm, where additional water and lipid absorption features exist. Hence, a more accurate estimation of these two chromophores is expected when spectra are fitted between 500 and 1600 nm than between 500 and 1000 nm. When extending the UV-VIS wavelength range, the estimated total amount of chromophores approached 100% of the total as present in the probed volume. The confidence levels of the water and lipid related parameters increases by a factor of four.
OCIS codes: (170.6935) Tissue characterization, (300.6170) Spectra, (170.3660) Light propagation in tissues
1. Introduction
Diffuse optical spectroscopy (DOS) has been widely used as a tool for determining optical properties of tissue. Such tools are investigated as an aid for detecting cancers [1–4], for monitoring changes in tissue optical properties that reflect morphological and physiological changes [5], and for monitoring therapy response for instance in photodynamic therapy [6]. Several methods exist to extract optical properties of tissue-like diffuse media such as time-resolved [7,8], frequency-domain [9], spatially-resolved continuous wave [10,11], combined frequency-domain and continuous wave broadband diffuse optical spectroscopy [3], and empirical models based on Monte-Carlo simulations and experimental phantoms of known optical properties [5,12,13].
Most of the studies [2,14–19] focused on the estimation of chromophore concentrations in the ultraviolet and visible wavelength range (typically between 350 and 800 nm) where deoxygenated and oxygenated hemoglobin are the main optical absorbers. Measurements in breast [2,14,15] or on the skin [16] showed absorption from additional chromophores such as beta-carotene and melanin, respectively. Several studies used wavelength ranges extended up to 1000 nm [3,17,18] in order to determine concentrations of water and lipid, which have distinct absorption peaks at 972 and 930 nm, respectively [18,19]. These studies [3,17–19] used probes with fiber separations up to 1.7 cm. For probes with much shorter separation between the collecting and emitting fibers, the absorption dips in the reflectance due to lipid and water will also be much smaller since the transmitted light decays exponentially with the path length and the absorption coefficient (Beer’s law). Thus, measurements of water and lipid content in this wavelength region using photon pathlengths of a few mm only will not be very accurate. Extending the commonly used wavelength range of 500 to 1000 nm up to 1600 nm enables the measurement of additional absorption peaks of water and lipid with absorption values that are an order of magnitude higher than those in the lower wavelength region. Although not extensively reported, not constraining the fitting parameters [17] often leads to an estimated summed volume of chromophores significantly different from a total of 100%. This could either mean that there is a biological entity within the probed volume that does not have optical absorption peaks (e.g. melanin) or that the model requires modifications. The present paper aims to investigate if the use of this extended wavelength region increases the accuracy of the measurement without constraining any of the fit parameters.
The applicability of an analytical solution that derives from diffusion theory to determine the optical properties was extensively studied and validated for wavelength ranges below 1000 nm [10,11]. In a former study [20], the absorption coefficients of water and lipid between 900 and 1600 nm (I900→1600) were measured and the applicability of the diffusion theory model to this wavelength range was validated for phantom measurements with known amounts of water and lipid.
To investigate whether having an additional spectrometer that can measure in the infrared up to 1600 nm can effectively improve the estimation of water and lipid concentrations, we compared the values of the parameters derived from the fits applied for two different wavelength ranges: the classical range from 500 to 1000 nm (I500→1000) and the extended range from 500 to 1600 nm (I500→1600). Measurements on in vivo swine tissues were performed with combined silicon and InGaAs spectrometers and were analyzed by fitting an analytical model to the two wavelength ranges of interest. In order to assess the improvements to the fits when adding the InGaAs spectrometer, we compared the confidence intervals [21] of the estimated parameters obtained from both fits.
2. Methods
2.1 Instrumentation
A schematic diagram of the setup is shown in Fig. 1 . The setup consists of an optical probe with three optical fibers with a NA of 0.22, a spectrometer with a silicon detector (Andor Technology, DU420A-BRDD), a spectrometer with an InGaAs detector (Andor Technology, DU492A-1.7) and a tungsten halogen broadband light source with an integrated shutter (Ocean Optics, HL-2000-HP). The optical probe has a diameter of 1.3 mm and its distal end is polished at an angle of 20 degrees in order to ease its insertion in the animals. The probe contains three 200 μm core diameter optical fibers with axis of symmetry parallel to the axis of symmetry of the probe. One optical fiber is connected to a light source. The second and third optical fibers are connected to the spectrometer with a silicon detector and the spectrometer with an InGaAs detector, respectively. The silicon detector is a matrix of 1024 by 255 pixels with pixel size of 26x26 microns whereas the InGaAs detector is a single array of 512 pixels with a pixel size of 500x50 microns. The spectral resolution for the silicon and InGaAs detectors are 4 and 10 nm, respectively. At the tip of the probe, the three optical fibers distal ends form an isosceles triangle in such a way that both collecting fibers were embedded side by side with a center-to-center distance of 370 microns and separated by a distance of 2.48 mm from the emitting fiber.
Fig. 1.
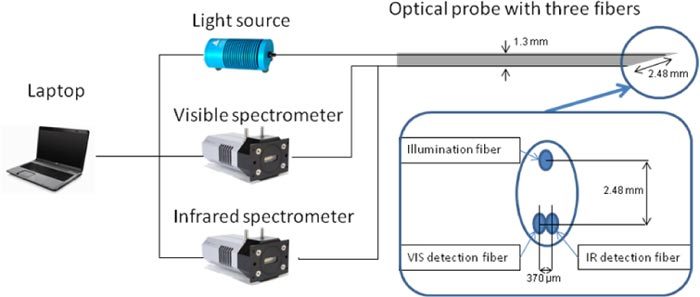
Sketch of the optical setup: it consists of a halogen lamp that is connected to a fiber and two spectrometers that are connected to two separate fibers that are located next to each other at the tip of the probe.
2.2 Data acquisition and pre-processing
The calibration and the generation of the spectra acquired with the InGaAs spectrometer was described elsewhere [20]. Briefly, the calibration procedure consisted of assigning a wavelength value to each pixel of the detector, then measuring a white reflectance standard to compensate for the spectral shape of the light emitted by the lamp and the wavelength-dependant sensitivity of the detector and the optics in the grating of the system; and a background measurement to compensate for the dark current and electric offsets of the detector. The tissue spectra are computed by dividing the measured spectra in tissue corrected for background by the calibration measurement of the white reflectance standard. We applied the same process for the spectra acquired with the silicon spectrometer. The spectra obtained from both spectrometers have an overlapping wavelength range between 900 and 1000 nm which was used to compute the matching factor to form continuous spectra from 500 and 1600 nm. For all the acquired spectra, the matching factor should be ideally equal to one but is on average 0.9 ± 0.3. This is due to the fact that the light is collected via two separate fibers and in an inhomogeneous medium there might be a sampling error. To avoid this artifact, one single fiber should be connected to a fiber splitter in order to collect the light from the same sampling volume. However, using a fiber splitter will reduce the light transmission by more than 50% and thus longer integration times might be needed to achieve a good signal-to-noise ratio making real-time feedback impossible.
2.3 Tissue measurements
Measurements were performed on three anaesthetized swine after approval from the internal review board of the animal lab facility. The swine were originally dedicated for a different clinical study; however we were allowed to perform our measurements. Spectra were taken at different locations within the animals, where the position of the tip of the optical probe was confirmed by X-ray or ultrasound imaging. Tissue boundaries were avoided in order to measure in volumes as homogenous as possible.
The integration time for a single spectrum acquisition ranges from a quarter of a second to two seconds but most spectra were acquired with an integration time of one second yielding to a signal-to-noise ratio of 200:1 and 120:1 for the Silicon and InGaAs detector, respectively. However, all measurements on the white reflectance standard for calibration were made with an integration time of two seconds. For both spectrometers, the integration time was kept the same. In total, we obtained 296 spectra including 143 measurements on various fatty layer structures (from which 56 subcutaneous fat in the back of the pig and 87 visceral fat in the epidural space) and 153 muscle measurements in the back of the three animals.
2.4 Analytical model
The acquired spectra were fitted with the analytical model developed by Farrell et al. [10] which has the absorption coefficient and the reduced scattering coefficient, in cm−1, as input arguments. In a previous work [20], this model was described and used to estimate water and lipid concentration and its validity was shown in the 900-1600 nm wavelength range.
A double power law function was used to describe the wavelength dependence of the reduced scattering (cf. Equation (1)). The first law corresponds to the contribution of Mie scattering [22–24] whereas the second power law corresponds to the contribution of Rayleigh scattering which can be significant in the visible wavelength range [25]. The reduced scattering is expressed in cm−1 and is a function of wavelength:
| (1) |
In Eq. (1), is a normalization wavelength set to 800 nm and the parameter a corresponds to the reduced scattering amplitude at this specific wavelength. The reduced scattering corresponds to the sum of Mie and Rayleigh scattering and, therefore, is defined as the Mie-to-Rayleigh fraction of the scattering. The reduced scattering slope of the Mie scattering is denoted b and is related to the particle size [26].
The main chromophores that absorb in the visible and near infrared are hemoglobin derivatives in the blood (deoxy-hemoglobin and oxy-hemoglobin) [27,28], water and lipid [18,20,29]. Instead of modeling the absorption coefficient as the sum of absorption coefficients weighted by the respective concentrations of the four chromophores of interest, we decided to express the absorption coefficient as:
| (2) |
The absorption coefficients of hemoglobin in blood, water and lipid are , and , respectively; and are depicted in Fig. 2 . The absorption coefficient of blood is multiplied by the blood volume fraction , where and correspond to the concentration of deoxygenated and oxygenated hemoglobin, respectively; and a correction factor that accounts for the effect of pigment packaging [30] and alters for the shape of the absorption spectrum. The correction factor is given by
Fig. 2.
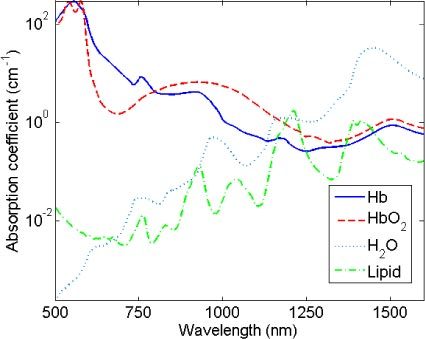
Absorption coefficient of deoxygenated hemoglobin (full line), oxygenated hemoglobin (dashed line), water (dotted line) and lipid (dashed-dotted line) from 500 to 1600 nm.
| (3) |
where R corresponds to the effective vessel radius. The absorption coefficient of hemoglobin in blood is given by
| (4) |
Here and represent the basics extinction coefficient spectra of oxygenated and deoxygenated hemoglobin, respectively, assuming a blood hemoglobin content of 150 g/l (typical value for human blood). The oxygenated hemoglobin fraction in the total amount of hemoglobin is noted and is commonly known as the blood oxygen saturation. Similarly and where and correspond to the concentration of lipid (density of 0.86g/ml) and water, respectively. They correspond to the total amount of water and lipid in the probed volume and the lipid fraction within this volume, respectively. This way of relating the water and lipid parameters in the expression of the absorption coefficient defined in Eq. (2) rather than estimating separately the water and lipid volume fraction corresponds to a minimization of the covariance of the basis functions for fitting resulting in a more stable fit.
From the acquired spectra we derive eight parameters: a, b, , R, , , and. Hence three parameters define the reduced scattering coefficient, and five components the absorption coefficient, from which three are related to blood and the two other to water and lipid. Although not commonly used when fitting beyond 500 nm, a Rayleigh scattering term and the correction factor for pigment packaging were used [17]. According to an F-test with p<0.001 [31], the fit is improved for 64% and 89% of the data when considering Rayleigh scattering and the pigment packaging factor in the model, respectively. The spectra were fitted over the 500-1000 nm and 500-1600 nm wavelength ranges using a non constrained nonlinear least-squares Levenberg-Marquardt fitting algorithm. The confidence intervals on the estimated parameters at a confidence level of 99% were assessed from the square roots of the diagonal elements of the covariance matrix [21].
A detailed study on the validation and calibration of the model in the 900-1600 nm wavelength range was described in Ref. 20 based on phantom experiments. Given the extensive literature descriptions of the model validation in the 500-1000 nm wavelength range [10,11], only a validation comparable to the one in Ref. 10 was performed to make sure that the model estimates the correct blood volume faction with our setup. A set of phantoms that consist of human blood diluted in a scattering solution (80 mg of oil-free scattering powder in PBS) were prepared to obtain blood volume fractions of 0.5, 1, 5 and 10% of a total phantom volume of 10 ml for each dilution. As soon as the blood was extracted from the subject, a blood oxygen saturation of 98.9% was measured with a blood gas analyzer (RapidPoint 405) before the preparation of the phantoms. When comparing the estimated blood volume fractions with the actual values, a linear regression of equation y = 0.97x-0.01 was obtained (R2 = 0.993). A blood oxygen saturation of 96.1 ± 2.3% was estimated which is in good agreement with the value estimated by the blood gas analyzer.
3. Results and discussion
Figure 3 shows typical diffuse optical spectra measured on a muscle and a fat layer respectively with the corresponding fit over I500→1600. Moreover, it also shows the residual.
Fig. 3.
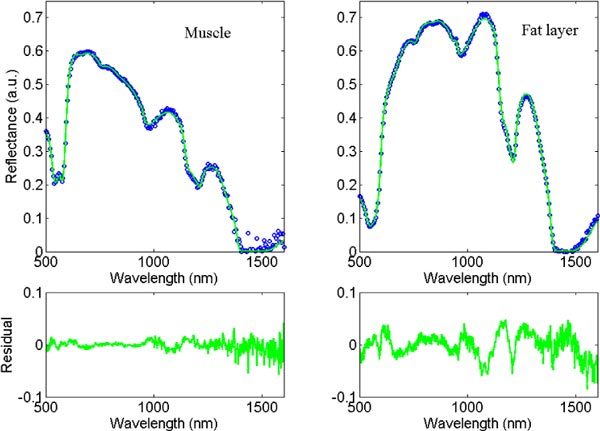
Typical measurement of muscle and fat layer (dotted line), and the corresponding fits and residuals between 500 and 1600 nm (full line).
When measuring with a silicon spectrometer, it is possible to estimate the amount of water and lipid due to the absorption peaks of these two chromophores that exist in the 900 to 1000 nm wavelength range. However it is interesting to investigate whether any advantages arise from adding an InGaAs spectrometer to accurately estimate the amount of water and lipid. Table 1 summarizes the average values that are estimated from fitting at I500→1000 (Fit 1) and I500→1600 (Fit 2) and their respective average confidence intervals. It is clear from Table 1 that the total amount of chromophores (i.e. + ) is closer to 100% when the fit is applied over I500→1600. As a matter of comparison, there is a significant difference (t-test, p<0.05) from a 100% total amount of chromophores for 67% of the spectra fitted over I500→1000 and only 28% when fitted over I500→1600.
Table 1. Average estimated parameters and the corresponding average confidence intervals for fat layers and muscle as derived from fitting over I500→1000 (Fit 1) and I500→1600 (Fit 2).
| Fat layers (n = 143) | Muscle (n = 153) | ||||
|---|---|---|---|---|---|
| Parameters | Fit 1 1000 | Fit 2 1600 | Fit 1 1000 | Fit 2 1600 | |
| a (cm−1) | 5.2 ± 1.7 | 6.3 ± 0.7 | 4.0 ± 1.0 | 4.6 ± 0.4 | |
| b | 0.7 ± 0.3 | 0.8 ± 0.1 | 0.7 ± 0.3 | 0.6 ± 0.1 | |
| (%) | 98 ± 8 | 98 ± 6 | 93 ± 10 | 87 ± 6 | |
| R (μm) | 23 ± 9 | 15 ± 5 | 27 ± 8 | 19 ± 4 | |
| (%)(*) | 1.0 ± 0.3 | 0.8 ± 0.1 | 2.4 ± 0.6 | 2.0 ± 0.2 | |
| (%) | 21 ± 5 | 21 ± 7 | 27 ± 5 | 25 ± 5 | |
| (%)(*) | 112 ± 30 | 95 ± 5 | 114 ± 42 | 89 ± 5 | |
| (%) | 60 ± 5 | 68 ± 1 | 10 ± 13 | 18 ± 3 | |
(*)Significant difference from 100% of the sum with p<0.05 for 67% of all the spectra when Fit 1 is applied and 28% of the spectra when Fit 2 is applied.
Among the 28% of the spectra for which the total amount of chromophores is statistically different from 100%, a few spectra gave numbers statistically higher than 100% when fitting between 500 and 1600 nm. A number of effects might be the cause of this. The temperature of the animals decreased during the measurement sessions thus the water temperature in the body decreased. Therefore, the absorption coefficient of water which is temperature dependant need to be adapted in the fitting [20]. Moreover the type of lipid that is used in the fit is from beef fat and not from swine. As lipid is composed of different types of fat such as unsaturated, monosaturated and polysaturated fat; the beef fat can be chemically different from swine fat. This difference in fat provides differences in absorption coefficient of lipid [20]. As it can be seen in the residual curve of the fat layer measurement in Fig. 3, the largest deviations are around 1100 and 1200 nm where the main difference in absorption values of fat exists as presented in Fig. 8 of reference [20].
Figure 4 compares for each single spectrum the total volume fraction of water and lipid for both wavelength ranges. The solid and dashed lines correspond to the mean and standard deviation. It is clear from Fig. 4 that fitting the measurement data between 500 and 1600 nm reduces the standard deviation of the data by a factor of four compared to the smaller wavelength range. Moreover, Table 1 clearly shows an improvement on the confidence interval for the estimation of the total amount of water and lipid volume fraction and for the lipid fraction within this total volume.
Fig. 4.
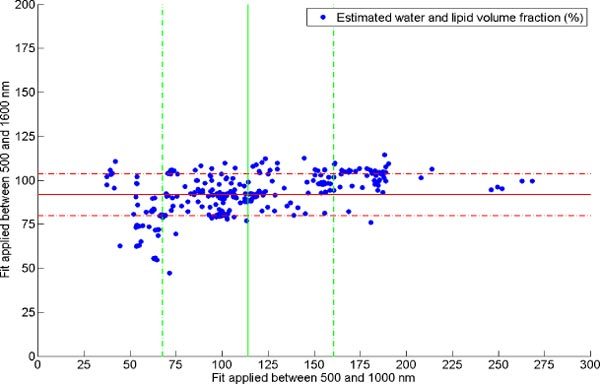
Estimated water and lipid volume fraction (dots) when fitting between 500 and 1000 nm versus 500 and 1000 nm and the respective mean and standard deviation.
Figure 5 shows in a log-log scale for each of the parameters, , and the comparison of the confidence intervals for the two wavelength ranges of interest. Computing the average of the ratio of the confidence intervals obtained for both fits shows that extending the wavelength range up to 1600 nm narrows the confidence intervals of the water and lipid related parameters on average by a factor of four and the total blood volume fraction of a factor of two whereas no improvements are seen for the blood saturation levels.
Fig. 5.
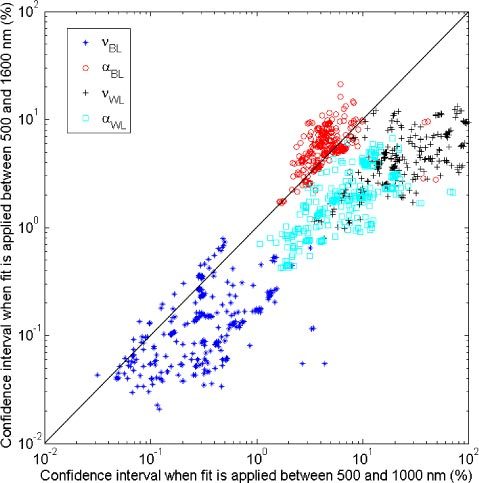
Comparison of confidence intervals obtained when fit is applied between 500 and 1000 nm and 500 and 1600 nm of the blood volume fraction (stars), blood saturation (circles), water and lipid volume fraction (crosses) and lipid fraction in the total volume (squares).
A Spearman’s rank correlation test [17] is performed to assess the correlation between the values obtained for the two different wavelength ranges. Such a test determines whether strong correlation exists between the estimated parameters for both wavelength ranges. However, there could be high correlation despite a different dispersion (statistical variability) of the values and therefore a statistical test is required to determine whether the standard deviations of the estimated values are of the same order for both fits. The Levene’s test [32] was applied to investigate whether there are significant differences between the dispersion of the estimated parameters from both fits. Table 2 provides the Spearman’s rank correlation coefficient for each parameter and indicates which parameters have significant differences with respect to the values and the dispersion of the values based on the analysis of variance and Levene’s tests. The confidence intervals of the Spearman’s correlation coefficients were computed by using a Fisher’s z-transformation [32] with p<0.05. From Table 2, it is clear that adding the 900-1600 nm data induces statistical differences for and . One can notice that the lipid fraction parameter is the only parameter that does show significant difference in values but not in dispersion. As seen in Table 1, the lipid fraction estimated over I500→1000 is smaller than when fitting over I500→1600. However the values do vary between 0 and 100% and therefore there is a non-significant difference in the dispersion of the estimated value for this parameter. From Table 2, the Spearman’s correlation factors are considered to be high (above 0.8) except for the scattering related parameter and the water and lipid volume fraction.
Table 2. Spearman’s correlation rank for each estimated parameter and parameters that show significant differences in value and dispersion.
| Parameters | Spearman’s correlation factor of the estimated values | Significant difference of the estimated parameters values with p<0.05 for the analysis of variance test | Significant difference of the dispersion of the estimated parameters with p<0.05 for the Levene’s test |
|---|---|---|---|
| a (cm−1) | 0.75 ± 0.05 | + | + |
| b | 0.22 ± 0.10 | - | - |
| (%) | 0.55 ± 0.08 | + | + |
| R (μm) | 0.82 ± 0.03 | - | - |
| (%) | 0.81 ± 0.04 | - | - |
| (%) | 0.87 ± 0.02 | - | - |
| (%) | 0.50 ± 0.09 | + | + |
| (%) | 0.90 ± 0.02 | + | - |
Although there is a significant difference in the reduced scattering amplitude values a for both fits, their correlation factor is only as high as 0.75 and not more. It is thus interesting to know the cause of this effect. For this purpose, a t-test was performed for all the estimated values of reduced scattering to know which data points give significant differences with p<0.05. Figure 6.a. depicts the data points for which there is no significant difference in the estimated reduced scattering amplitude values for both fits (blue stars) and those for which there is difference (red diamonds) according to the t-test. From Fig. 6.a, it can be seen that the values which are different all have low reduced scattering amplitudes. By plotting the corresponding water and lipid volume fractions that were estimated (cf. Figure 6.b.), we observe that the values that show significant differences in the reduced scattering amplitudes mainly corresponds to the spectra for which was estimated to be larger than 100% when the fit is applied between 500 and 1000 nm. When fitting up to 1600 nm, the estimated for these spectra approaches 100% and the reduced scattering amplitude becomes higher. Thus when the reduced scattering amplitude of the measured tissues is low (i.e. smaller than the inverse of the fiber distance separation of 5cm−1), its covariance with is high which leads to an incorrect estimation of the latter parameter. Besides, a change in the estimated reduced scattering amplitudes also induces a change in the estimation of the blood volume fraction (cf. Figure 6.c.). The amount of blood is overestimated when fitting over the 500 to 1000 nm wavelength range in case of low reduced scattering samples. Otherwise, the blood volume fraction values are not altered whilst the amount of water and lipid volume fraction is improved.
By fitting up to 1600 nm where additional absorption features of water and lipid exist, the covariance with the reduced scattering as defined in Eq. (1) is smaller and still allows for a reliable fit when the reduced scattering coefficient is low. In case the fit is performed between 500 and 1000 nm, for small reduced scattering values, the scattering is underestimated whereas the absorption due to water, lipid and blood is overestimated.
Fig. 6.
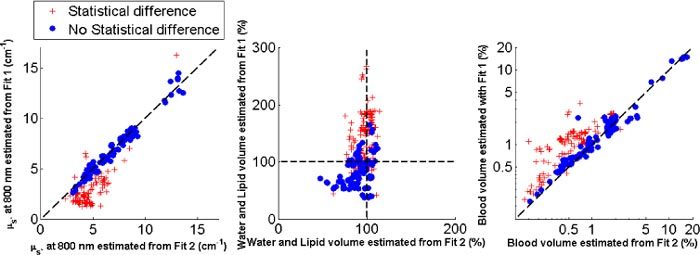
Comparison of the estimated reduced scattering amplitude when fit is applied between 500 and 1000 nm (Fit 1) and 500 and 1600 nm (Fit 2) where the circles correspond to no statistical difference in absolute values and the crosses with statistical differences (a). The corresponding water and lipid volume fractions shows larger deviation from 100% when Fit 1 is applied (b). The corresponding blood volume fraction shows overestimations of the values when Fit 1 is applied (c).
4. Conclusion
We have presented a comparison on the estimation of the absorption and reduced scattering related parameters when fits are applied to spectra measured in the commonly used wavelength range of 500 to 1000 nm acquired with a silicon detector and the wavelength range of 500 to 1600 nm obtained when adding an InGaAs spectrometer. The fitting procedure was deliberately performed without constraining the values. Judging on the confidence intervals computed for each estimated parameter, having an additional spectrometer to measure up to 1600 nm provides up to four time higher confidence on the estimation of the water and lipid related parameters due to the presence of additional absorption features above 1000 nm. The blood volume fraction showed a factor of two improvement in the confidence intervals when fitting up to 1600 nm. The covariance between the reduced scattering amplitude and the water and lipid volume fraction is high for low reduced scattering amplitudes leading to errors in the estimation of absorbers if the fit is applied between 500 and 1000 nm.
Acknowledgments
The authors are grateful to Gert ‘t Hooft, Jasper Klewer, Gerald Lucassen, Jeroen Horikx, Walter Bierhoff and Martin B. van der Mark from Philips Research and Stephen C. Kanick from Erasmus Medical Center for their valuable feedback in the manuscript preparation phase. The authors thank Robert Dürichen for his help to perform the measurements. This work is supported by a European Commission Marie Curie contract MEST-CT-2004-007832.
References and links
- 1.Bard M. P., Amelink A., Hegt V. N., Graveland W. J., Sterenborg H. J. C. M., Hoogsteden H. C., Aerts J. G. J. V., “Measurement of hypoxia-related parameters in bronchial mucosa by use of optical spectroscopy,” Am. J. Respir. Crit. Care Med. 171(10), 1178–1184 (2005). 10.1164/rccm.200501-046OC [DOI] [PubMed] [Google Scholar]
- 2.Volynskaya Z., Haka A. S., Bechtel K. L., Fitzmaurice M., Shenk R., Wang N., Nazemi J., Dasari R. R., Feld M. S., “Diagnosing breast cancer using diffuse reflectance spectroscopy and intrinsic fluorescence spectroscopy,” J. Biomed. Opt. 13(2), 024012 (2008). 10.1117/1.2909672 [DOI] [PubMed] [Google Scholar]
- 3.Cerussi A. E., Shah N., Hsiang D., Durkin A., Butler J., Tromberg B. J., “In vivo absorption, scattering, and physiologic properties of 58 malignant breast tumors determined by broadband diffuse optical spectroscopy,” J. Biomed. Opt. 11(4), 044005 (2006). 10.1117/1.2337546 [DOI] [PubMed] [Google Scholar]
- 4.Brown J. Q., Wilke L. G., Geradts J., Kennedy S. A., Palmer G. M., Ramanujam N., “Quantitative optical spectroscopy: a robust tool for direct measurement of breast cancer vascular oxygenation and total hemoglobin content in vivo,” Cancer Res. 69(7), 2919–2926 (2009). 10.1158/0008-5472.CAN-08-3370 [DOI] [PMC free article] [PubMed] [Google Scholar]
- 5.Amelink A., Sterenborg H. J. C. M., Bard M. P. L., Burgers S. A., “In vivo measurement of the local optical properties of tissue by use of differential path-length spectroscopy,” Opt. Lett. 29(10), 1087–1089 (2004). 10.1364/OL.29.001087 [DOI] [PubMed] [Google Scholar]
- 6.Amelink A., van der Ploeg van den Heuvel A., de Wolf W. J., Robinson D. J., Sterenborg H. J. C. M., “Monitoring PDT by means of superficial reflectance spectroscopy,” J. Photochem. Photobiol. B 79(3), 243–251 (2005). 10.1016/j.jphotobiol.2005.01.006 [DOI] [PubMed] [Google Scholar]
- 7.Andersson-Engels S., Berg R., Persson A., Svanberg S., “Multispectral tissue characterization with time-resolved detection of diffusely scattered white light,” Opt. Lett. 18(20), 1697–1699 (1993). 10.1364/OL.18.001697 [DOI] [PubMed] [Google Scholar]
- 8.Pifferi A., Torricelli A., Taroni P., Bassi A., Chikoidze E., Giambattistelli E., Cubeddu R., “Optical biopsy of bone tissue: a step toward the diagnosis of bone pathologies,” J. Biomed. Opt. 9(3), 474–480 (2004). 10.1117/1.1691029 [DOI] [PubMed] [Google Scholar]
- 9.Fantini S., Francechini-Fantini M. A., Maier J. S., Walker S. A., Barbieri B., Gratton E., “Frequency-domain multichannel optical detector for noninvasive tissue spectroscopy and oximetry,” Opt. Eng. 34(1), 32–42 (1995). 10.1117/12.183988 [DOI] [Google Scholar]
- 10.Farrell T. J., Patterson M. S., Wilson B., “A diffusion theory model of spatially resolved, steady-state diffuse reflectance for the noninvasive determination of tissue optical properties in vivo,” Med. Phys. 19(4), 879–888 (1992). 10.1118/1.596777 [DOI] [PubMed] [Google Scholar]
- 11.Zonios G., Perelman L. T., Backman V. M., Manoharan R., Fitzmaurice M., Van Dam J., Feld M. S., “Diffuse reflectance spectroscopy of human adenomatous colon polyps in vivo,” Appl. Opt. 38(31), 6628–6637 (1999). 10.1364/AO.38.006628 [DOI] [PubMed] [Google Scholar]
- 12.Reif R., A’Amar O., Bigio I. J., “Analytical model of light reflectance for extraction of the optical properties in small volumes of turbid media,” Appl. Opt. 46(29), 7317–7328 (2007). 10.1364/AO.46.007317 [DOI] [PubMed] [Google Scholar]
- 13.Zonios G., Bassukas I., Dimou A., “Comparative evaluation of two simple diffuse reflectance models for biological tissue applications,” Appl. Opt. 47(27), 4965–4973 (2008). 10.1364/AO.47.004965 [DOI] [PubMed] [Google Scholar]
- 14.van Veen R. L. P., Amelink A., Menke-Pluymers M., van der Pol C., Sterenborg H. J. C. M., “Optical biopsy of breast tissue using differential path-length spectroscopy,” Phys. Med. Biol. 50(11), 2573–2581 (2005). 10.1088/0031-9155/50/11/009 [DOI] [PubMed] [Google Scholar]
- 15.Bigio I. J., Bown S. G., Briggs G., Kelley C., Lakhani S., Pickard D., Ripley P. M., Rose I. G., Saunders C., “Diagnosis of breast cancer using elastic-scattering spectroscopy: preliminary clinical results,” J. Biomed. Opt. 5(2), 221–228 (2000). 10.1117/1.429990 [DOI] [PubMed] [Google Scholar]
- 16.Zonios G., Dimou A., “Modeling diffuse reflectance from semi-infinite turbid media: application to the study of skin optical properties,” Opt. Express 14(19), 8661–8674 (2006). 10.1364/OE.14.008661 [DOI] [PubMed] [Google Scholar]
- 17.van Veen R. L. P., Verkruysse W., Sterenborg H. J. C. M., “Diffuse-reflectance spectroscopy from 500 to 1060 nm by correction for inhomogeneously distributed absorbers,” Opt. Lett. 27(4), 246–248 (2002). 10.1364/OL.27.000246 [DOI] [PubMed] [Google Scholar]
- 18.van Veen R. L. P., Sterenborg H. J. C. M., Pifferi A., Torricelli A., Chikoidze E., Cubeddu R., “Determination of visible near-IR absorption coefficients of mammalian fat using time- and spatially resolved diffuse reflectance and transmission spectroscopy,” J. Biomed. Opt. 10(5), 054004 (2005). 10.1117/1.2085149 [DOI] [PubMed] [Google Scholar]
- 19.Merritt S., Gulsen G., Chiou G., Chu Y., Deng C., Cerussi A. E., Durkin A. J., Tromberg B. J., Nalcioglu O., “Comparison of water and lipid content measurements using diffuse optical spectroscopy and MRI in emulsion phantoms,” Technol. Cancer Res. Treat. 2(6), 563–569 (2003). [DOI] [PubMed] [Google Scholar]
- 20.Nachabé R., Hendriks B. H. W., Desjardins A. E., van der Voort M., van der Mark M. B., Sterenborg H. J. C. M., “Estimation of lipid and water concentrations in scattering media with diffuse optical spectroscopy from 900 to 1,600 nm,” J. Biomed. Opt. 15(3), 037015 (2010). 10.1117/1.3454392 [DOI] [PubMed] [Google Scholar]
- 21.Amelink A., Robinson D. J., Sterenborg H. J. C. M., “Confidence intervals on fit parameters derived from optical reflectance spectroscopy measurements,” J. Biomed. Opt. 13(5), 054044 (2008). 10.1117/1.2982523 [DOI] [PubMed] [Google Scholar]
- 22.van Staveren H. J., Moes C. J. M., van Marie J., Prahl S. A., van Gemert M. J. C., “Light scattering in Intralipid-10% in the wavelength range of 400-1100 nm,” Appl. Opt. 30(31), 4507–4514 (1991). 10.1364/AO.30.004507 [DOI] [PubMed] [Google Scholar]
- 23.Gardner C. M., Jacques S. L., Welch A. J., “Light transport in tissue: Accurate expressions for one-dimensional fluence rate and escape function based upon monte carlo simulation,” Lasers Surg. Med. 18(2), 129–138 (1996). [DOI] [PubMed] [Google Scholar]
- 24.Bargo P. R., Prahl S. A., Goodell T. T., Sleven R. A., Koval G., Blair G., Jacques S. L., “In vivo determination of optical properties of normal and tumor tissue with white light reflectance and an empirical light transport model during endoscopy,” J. Biomed. Opt. 10(3), 034018 (2005). 10.1117/1.1921907 [DOI] [PubMed] [Google Scholar]
- 25.Saidi I. S., Jacques S. L., Tittel F. K., “Mie and Rayleigh modeling of visible-light scattering in neonatal skin,” Appl. Opt. 34(31), 7410–7418 (1995). 10.1364/AO.34.007410 [DOI] [PubMed] [Google Scholar]
- 26.Zonios G., Dimou A., “Light scattering spectroscopy of human skin in vivo,” Opt. Express 17(3), 1256–1267 (2009). 10.1364/OE.17.001256 [DOI] [PubMed] [Google Scholar]
- 27.W. G. Zijlstra, A. Buursma, and O. W. Van Assendelft, Visible and Near Infrared Absorption Spectra of Human and Animal Haemoglobin (Utrecht, The Netherlands, VSP Publishing, 2000). [Google Scholar]
- 28.Roggan A., Friebel M., Dörschel K., Hahn A., Müller G., “Optical properties of circulating human blood in the wavelength range of 400-2500 nm,” J. Biomed. Opt. 4(1), 36–46 (1999). 10.1117/1.429919 [DOI] [PubMed] [Google Scholar]
- 29.Hale G. M., Querry M. R., “Optical constants of water in the 200-nm to 200-μm wavelength region,” Appl. Opt. 12(3), 555–563 (1973). 10.1364/AO.12.000555 [DOI] [PubMed] [Google Scholar]
- 30.Verkruysse W., Lucassen G. W., de Boer J. F., Smithies D. J., Nelson J. S., van Gemert M. J. C., “Modelling light distributions of homogeneous versus discrete absorbers in light irradiated turbid media,” Phys. Med. Biol. 42(1), 51–65 (1997). 10.1088/0031-9155/42/1/003 [DOI] [PubMed] [Google Scholar]
- 31.P. R. Bevington, and D. K. Robinson, Data Reduction and Error Analysis for the Physical Sciences (McGraw-Hill, New York, 1969). [Google Scholar]
- 32.D. Sheskin, Handbook of Parametric and Non parametric Statistical Procedures (Chapman and Hall/CRC, 2007). [Google Scholar]


