

Abstract
Nonsense-mediated mRNA decay (NMD) is a surveillance system that eliminates transcripts with premature termination codons. In this study, we show that mRNAs targeted by NMD are also suppressed at the translational level. The low translational efficiency (TE) is a consequence of multiple features acting in concert, including low translation initiation rate, mediated by 5′ secondary structure and by use of weak initiation sites, and low translation elongation speed, mediated by low codon usage bias. Despite low elongation rates, NMD transcripts show low ribosome density in the coding sequence, probably owing to low initiation rates, high abortion rates or rapid transit of the ribosome following initiation failure. The low TE is observed in the absence of NMD and is not explained by low transcript abundance. Translational inefficiency is flexible, such that NMD targets have increased TE upon starvation. We propose that the low TE predisposes to NMD and/or that it is part of a mechanism for regulation of NMD transcripts.
Keywords: nonsense-mediated mRNA decay, translation efficiency, translation repression
Introduction
Nonsense-mediated mRNA decay (NMD) is a eukaryotic system to remove transcripts with premature termination codons (Chang et al, 2007), with a significant proportion (1–10%) of a transcriptome being affected. As the ribosome processes the transcripts, when it stalls on a premature stop codon, the NMD machinery is activated and the mRNA destroyed (Brogna and Wen, 2009).
Although the NMD effectors are conserved from yeast to mammals, the mechanisms to recognize the targets vary among species (Brogna and Wen, 2009). In yeast, the recognition of NMD targets depends on 3′ UTR length (Kebaara and Atkin, 2009), the sequence motif (Zhang et al, 1995) or upstream ORF (Guan et al, 2006). Unlike mammals, in yeast NMD occurs both during nuclear export and in the cytoplasm, and is not restricted to the pioneer round of translation (Johansson et al, 2007). More generally, the degradation by NMD is not 100% effective and is condition dependent (Zetoune et al, 2008), tending to be absent when ribosomal movement across mRNAs is slow (e.g., starvation conditions; Mendell et al 2004). What happens to those mRNAs that could be targeted by NMD but are not subject to NMD, and does their fate differ as conditions change? Are they likely to be efficiently translated? Perhaps NMD targets are adapted to inhibit translation as well as to induce mRNA degradation. Alternatively, inefficient translation could predispose a transcript to attract the NMD machinery. In this study, we test the hypothesis that during conditions consistent with NMD operating, NMD transcripts are also translationally inefficient.
Multiple factors are known to affect the efficiency of translation, of which codon usage bias is possibly the most important (Brockmann et al, 2007), as codons for which the cognate tRNA is rare tend to stall ribosomes (Wen et al, 2008). The secondary structure in the transcript can also influence ribosomal velocity and in turn affect the efficiency of translational initiation and elongation (Kudla et al, 2009; Tuller et al, 2010b). In particular, the structure of the 5′ UTR near the start codon impacts translation initiation, probably by interrupting ribosome docking and/or start codon recognition (Kudla et al, 2009; Gu et al, 2010). Third, and potentially related, the sequence in the vicinity of the initiation codon determines the optimality of initiation (Miyasaka, 1999). A transcript with an optimal start codon context tends to be better translated and prevents the ribosome from passing swiftly along the transcript without commensurate translation. We examine these factors in yeast NMD targets.
Results and Discussion
NMD targets show lower translational efficiency
We collated the data from three studies (He et al, 2003; Guan et al, 2006; Johansson et al, 2007) to define NMD targets in budding yeast Saccharomyces cerevisiae. We partitioned the ORFs into three sets: NMD targets in all studies (‘Inter', short for intersection), targets in at least one study (‘Union') and never targets (‘Non-NMD') (see Supplementary Figure S1). We find no functional bias for NMD targets (Supplementary Methods S1). The targets conform to expectations of targets of NMD such as long 3′ UTR (Supplementary Result S1 and Supplementary Figure S2; Kebaara and Atkin, 2009; Zhang et al, 2009). The defined targets here include both direct and indirect NMD targets (Guan et al, 2006).
We used two estimates for translational efficiency (TE) in our analyses. One is based on the ribosome density, as previously defined (Ingolia et al, 2009), the other being the ratio of protein abundance to mRNA levels (Tuller et al, 2007; Supplementary Data set S1).
NMD targets show significantly lower TE than non-NMD ORFs (Figure 1A; Wilcoxon rank-sum test, WRST, P<2.2e−16), this being most profound for the ‘Inter' set. The same results are observed when using the ratio of protein to mRNA levels (Figure 1B, WRST, P=0.000254 and <2.2e−16 for ‘Inter' and ‘Union', respectively) or if the putative targets identified by each experiment independently are examined (Supplementary Figure S3A, B and Supplementary Table S1). A permutation test confirms results (Supplementary Figure S4). Results are unaffected (WRST, P<2.2e−16) when both introns and uORFs are considered. Employing a data set based on polysomal separation on sucrose gradients (Arava et al, 2003), we additionally find that NMD targets (‘Union' set) have lower ribosome occupancy, lower numbers of associated ribosomes per transcript and lower ribosome density even if only ribosome-associated transcripts are considered (Supplementary Figure S5 and Supplementary Result S2).
Figure 1.

Lower translational efficiency in NMD targets and sensitivity to NMD is negatively correlated with translational efficiency. (A) Both ‘Inter' and ‘Union' sets of NMD targets show a lower TE (P<2.2e−16) using ribosome-based TE estimate. (B) The same as (A), but using the ratio of protein to mRNA level to estimate TE. (C) Direct NMD targets have lower translational efficiency than indirect targets (one-tailed wilcoxon rank-sum test, P=0.0663 and 0.005503 for ‘Both' and ‘Either' sets, respectively) and the latter has lower translational efficiency than non-NMD ORFs (P<2.2e−16). The red horizontal line in each plot gives the median value of non-NMD ORFs. TE of NMD targets are correlated with (D) the increased expression fold after NMD inhibition (Spearman's ρ=−0.2697, P=2.68E−07), (E) the downregulation fold after Upf2 activation (ρ=−0.2082, P=5.77E−4) and (F) the associated Upf1p enrichment magnitude (ρ=−0.0488, P=0.3567).
As the ‘Union' set gives similar results to the ‘Inter' set and to avoid any small sample bias, we chose the ‘Union' set as the NMD targets in the following analysis (unless mentioned otherwise). Meanwhile, we use ribosome-profiling based data for TE, as this measure is available for more ORFs and because the ratio of protein to mRNA levels can be affected by other factors, such as protein degradation (Belle et al, 2006).
Is TE reduction associated with NMD particular to direct targets or are both direct and indirect targets affected? To examine this, we divided the NMD targets into direct and indirect targets by reference to two studies (Guan et al, 2006; Johansson et al, 2007). Three NMD target sets are generated: direct targets in both studies (‘Both', n=43), direct targets in either study (‘Either', n=131), and indirect targets in both studies (‘Indirect', n=181; see Materials and methods). Both direct NMD target sets have slightly but (marginally) significantly lower TE than indirect targets (Figure 1C; one-side WRST, P=0.0663 and 0.0055 for ‘Both' and ‘Either' sets, respectively). When compared with non-NMD ORFs, all of them show significantly lower TE (Figure 1C, P<2.2e−16).
As the defined direct targets are often technically more sensitive to NMD change (Guan et al, 2006; Johansson et al, 2007), the above result predicts that targets with greater change in abundance after NMD manipulation should be more translationally suppressed. As expected, genes with greater increase in mRNA abundance after NMD inhibition have lower TE (Figure 1D; Spearman's ρ=−0.2697, P=2.68E−07). Similarly, the decreased fold change of mRNA expression after reactivation of Upf2 is negatively correlated with TE (Figure 1E, Spearman's ρ=−0.2082, P=0.0006). We also examined the relationship between the enrichment of Upf1p binding and the TE. In principle, the more Upf1p associated with an mRNA, the higher impact of NMD is expected on it. We observe, however, only a very weak non-significant negative correlation between Upf1p enrichment and TE (Figure 1F, spearman's ρ=−0.0488, P=0.3567). This suggests that binding of Upf1p is not always related to NMD, consistent with previous observation (Johansson et al, 2007).
As NMD genes tend to be lowly expressed (Supplementary Figure S6), might the above results simply reflect a difference in TE between highly and lowly expressed genes? As there is a non-significant relationship between the mRNA abundance and TE (Supplementary Figure S7 and Supplementary Table S2, Spearman's correlation, ρ=0.0215, P=0.1683), this is an unlikely explanation. Indeed, the difference in TE between NMD and non-NMD targets remains robust with expression level as a covariate (ANCOVA, P<2.2e−16) or when comparing the TE of NMD targets to non-NMD ORFs with lower expression (Supplementary Figure S8). The low TE of NMD targets is not simply a side consequence of low expression.
NMD targets have sequence features that in concert suppress translation
The above results suggest that NMD targets show lower TE than the genome average. This could be owing to inefficiency at many levels. The secondary structure of mRNA may affect ribosome movement (Kudla et al, 2009; Tuller et al, 2010b), especially the secondary structure near the start codon (Hall et al, 1982; Kudla et al, 2009) and in turn affect translation initiation (ribosome docking or AUG recognition). When the 5′ end of the mRNA has condensed into a relatively stable secondary structure, approaching the start codon is hard, the mRNA needing to be unraveled before the mRNA can be threaded into the ribosome (Kozak, 2005; Wen et al, 2008). Following Kudla et al (2009), we found that the subregion centered at −4 gives the most significant correlation between folding free energy and TE (Supplementary Figure S9). Therefore, we use folding free energy in this window to represent the effect of secondary structure near the start codon. The folding energy at this subregion of the NMD targets is significantly lower than that of non-NMD ones (Figure 2A, WRST, P=0.0001). On average, NMD targets have a more condensed structure in this region, consistent with an inability to initiate translation. When we examined the folding free energy for the 200 nts near the start codon, NMD targets do not show ebb that appears in non-NMD ORFs (Figure 2B).
Figure 2.

NMD targets have sequence features that in concert suppress translation. NMD targets show (A) lower folding free energy near the start codon (−25 to 16 nts relative to first base of start codon, which is at position 0) (Wilcox rank-sum test, P=0.000124), but (B) higher folding energy following that region. (C) NMD targets also have lower initiation codon adaptation sores (Wilcoxon rank-sum test, P=0.001148) and (D) lower codon usage bias (CAI) (Wilcoxon rank-sum test, P<2.2e−16).
We also found that NMD targets have a lower folding free energy when controlling for mRNA abundance (Supplementary Table S2, ANCOVA, P=0.0047), even though the highly expressed genes have higher folding free energy (Supplementary Table S2, Spearman's ρ=0.1353, P=1.45e−15). The free energy difference alone does not fully explain why NMD mRNAs have low efficiency (Table Ia).
Table 1. ANCOVA of translation efficiency on NMD with (a) folding free energy centered at −4 and (b) initiation codon adaptation index as a covariate, respectively.
| Coefficienta | P-value | |
|---|---|---|
| aCoefficient is the raw values and not comparable among variables. | ||
| bIn the model, NMD and non-NMD were given 1 and 0, respectively. Thus, a negative coefficient means NMD group has smaller values. | ||
| (a) Folding free energy | ||
| Folding free energy centered at −4 | 0.060292 | <2e−16 |
| NMDb | −1.074439 | <2e−16 |
| Intercept | −1.50631 | <2e−16 |
| (b) Initiation codon adaptation index | ||
| Initiation codon adaptation score | 0.60668 | 6.14E−11 |
| NMDb | −1.06463 | <2e−16 |
| Intercept | −1.95885 | <2e−16 |
Another important factor affecting translation is the start codon context, notably, the Kozak sequence (Kozak, 2005). While not explicitly factoring in local mRNA structure, optimality of initiation context scores nonetheless captures aspects of secondary structure, as there is a positive correlation between initiation score and free folding energy (Spearman's rank correlation, ρ=0.1397, P=2.26e−14). This suggests that the optimality of start codon context might be partly explained by loose structures induced by these optimal initiation sequences.
NMD targets also have lower AUG context adaptation index score (Figure 2C; WRST, P=0.0011). This suggests that NMD targets are also poor at ensuring that ribosomes start translation. As AUG adaptation index score and mRNA abundance are positively correlated (Supplementary Table S2, Spearman's ρ=0.1979, P<2.2e−16), poor initiation is possibly just a general feature for lowly expressed genes. When the mRNA abundance is used as a covariate, there is indeed no difference between NMD and non-NMD ORFs (Supplementary Table S2, ANCOVA, P=0.233). We conclude that NMD targets have low AUG adaptation scores, but no lower than expected, given their low transcript abundance. The weakness of the AUG adaptation scores fails to explain all of the low efficiency (Table Ib).
Besides suppressing initiation, low TE is also, in principle, consistent with fast ribosome movement across an NMD mRNA mediated by optimal codons, thus leading to ribosomes rapidly exiting a given mRNA (Tuller et al, 2010a). If this were the case and under the assumption of the same translation initiation rate, we would expect NMD mRNAs to have high codon usage bias, with codons matching the most abundant tRNAs. However, a priori high codon bias is an unlikely explanation for low TE for several reasons, not least that high codon bias is associated with abundant transcripts (see Supplementary Result S3 and Supplementary Figure S10).
When we compared the NMD and non-NMD targets, we found lower codon usage bias scores for NMD targets (using three codon bias measures) (Figure 2D and Supplementary Figure S11, WRST, P<2.2e−16). This is also true when mRNA abundance is used as a covariate (Supplementary Table S3), suggesting that the low bias is not simply a consequence of low expression per se. Rapid translation mediated by optimal codons is unlikely to explain low ribosome rates on NMD transcripts. Low ribosome density is probably caused by lower translation initiation rate for NMD targets, including lower docking and start codon recognition rate, as shown in above analyses, and/or abortion of translation. We, however, also found that NMD targets show lower ribosome density in CDS after accounting for low mRNA level and initiation rate (Supplementary Result S4 and Supplementary Figure S12). The result suggests that a lower initiation rate is not the sole reason for lower ribosome densities. There might thus be higher rates of stalling at the ATG followed by abortion of translation or rapid movement of ribosomes without translation.
As we have observed a positive correlation between codon usage bias and TE (Supplementary Figure S13), can codon usage alone account for the observed low TE of NMD targets? We compared the TEs after controlling the codon usage bias. We divided all the genes into four groups based on the codon adaptation index (CAI) values. Each group has no significant difference in CAI between NMD and non-NMD ORFs (Table II). However, there is significantly lower TE for NMD targets in each group (Supplementary Figure S14 and Table II). In addition, TE is significantly affected by NMD status when codon usage bias is used as a covariate (ANCOVA, P<2.2e−16; Table III). This is also true when the mRNA abundance is a covariate (ANCOVA, P<2.2e−16). Codon usage bias alone is not able to fully account for the lower TE. Multivariate analysis demonstrates that the above factors contribute independently to TE (Table IV).
Table 2. Translational efficiency comparison between NMD and non-NMD ORFs when CAI is controlled.
| Quarter1 | Quarter 2 | Quarter 3 | Quarter 4 | |
|---|---|---|---|---|
| Number of ORFs | 1218 | 1218 | 1187 | 1200 |
| NMD targets | 276 | 224 | 139 | 93 |
| P-value (CAI) | 0.2971 | 0.1754 | 0.3625 | 0.0811 |
| P-value (translational efficiency) | <2.2e−16 | <2.2e−16 | <2.2e−16 | 4.15E−13 |
Table 3. ANCOVA of translational efficiency on NMD with codon usage as covariate.
| CAI | CBI | FOP | ||||
|---|---|---|---|---|---|---|
| Coefficienta | P-value | Coefficienta | P-value | Coefficienta | P-value | |
| aCoefficient is the raw values and not comparable among variables. | ||||||
| bIn the model, NMD and non-NMD were given 1 and 0, respectively. Thus, a negative coefficient means NMD group has smaller values. | ||||||
| Codon usage index | 3.3597 | <2e−16 | 2.59969 | <2e−16 | 4.39982 | <2e−16 |
| NMDb | −0.94335 | <2e−16 | −0.9019 | <2e−16 | −0.90523 | <2e−16 |
| Intercept | −2.18901 | <2e−16 | −1.86774 | <2e−16 | −3.67126 | <2e−16 |
Table 4. Multivariate analysis of translational efficiency against related factors.
| Factorsa | Coefficientb | P-value |
|---|---|---|
| aTo avoid colinearity of covariates, we do not include initiation AUG context score here, because it is correlated to codon usage bias (Supplementary Table S4 and Miyasaka (1999)). | ||
| bCoefficient is the raw values and not comparable among variables. | ||
| cA similar result was obtained when the mRNA or protein abundance was substituted for CAI in the analysis (data not shown) | ||
| dIn the model, NMD and non-NMD were given 1 and 0, respectively. Thus, a negative coefficient means NMD group has smaller values. | ||
| Folding free energy centered at −4 | 0.02926 | 9.01E−06 |
| CAIc | 3.30431 | <2e−16 |
| NMDd | −0.9492 | <2e−16 |
| Intercept | −2.03023 | <2e−16 |
The physiological consequences of low TE for NMD targets
What is the physiological relevance of low TE of NMD transcripts? Low TE of NMD targets may be a pre-step before being degraded, what we call the coupled suppression or degradation model (Box 1). This is possible because as, in mammalian cells, translation suppression happens before degradation (Isken et al, 2008). If so, the low TE may be restricted to those targets subject to decay finally, and those escaping NMD may show normal TE. An alternative possibility is that the low TE is part of a mechanism to regulate (not simply to suppress) NMD targets at the translational level (Box 1, regulation model). Compared with mRNA regulation, translation regulation may be a quicker mode (Beyer et al, 2004; Brockmann et al, 2007).
Two models of the biological consequences for the translation repression of NMD targets.
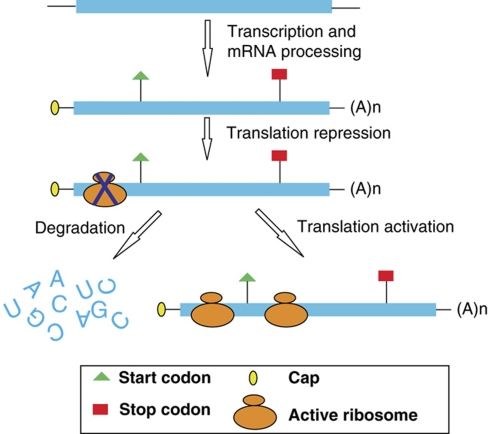 |
In one case, the mRNA is delivered to mRNA degradation machinery after translation repression. In contrast, it is also possible that translationally repressed mRNAs can be reactivated for translation when needed.
To differentiate these models we performed two tests. First, we asked if the mRNA samples used in studies were still being degraded by NMD. If low TE that we observed is just a preamble to NMD, then NMD should be active in our samples. If so, we expect the ratio of mRNA read density in UTRs to that in CDS to be significantly lower for NMD targets (Supplementary Result S5). The result is inconsistent with this prediction (Figure 3A and B), suggesting that the mRNA sample may only contain transcripts escaping NMD. Consistent with this, the mRNA decay half-lives of NMD targets are also longer than non-NMD ORFs (Figure 3C), suggesting that NMD is not operating because NMD should speed up mRNA decay (Guan et al, 2006). Both results suggest that the low TE here is a property of NMD targets in the absence of NMD and thus argues against the coupled suppression/degradation model.
Figure 3.

Evidence for mRNA sequence samples free of NMD activity. No significant difference between NMD and non-NMD targets for the ratio of 5′ (A) and 3′ (B) UTR to CDS mRNA read densities (Wilcoxon rank-sum test, P=0.1467 and 0.2468, respectively). (C) NMD targets also show longer decay half-lives based on previous data (Wang et al, 2002) (Kolmogorov–Smirnov tests, P=5.72E−9).
Can low TE of NMD targets be modulated under some conditions, such as starvation? Employing TE data from nutrient poor conditions (Ingolia et al, 2009), we find that the TE of NMD targets is significantly increased. There are significantly more NMD targets that show ⩾2-fold increase of TE than non-NMD ORFs (Table V; Fisher's exact test, P=0.0214). Considering all ORFs, NMD targets have a greater fold change (Supplementary Figure S15). The increase is also significant after accounting for the baseline TE (ANCOVA, P=0.0004) and may not relate to NMD activity change (Supplementary Figures S16 and S17).
Table 5. More translationally upregulated ORFs in NMD targets.
| Upregulated | Downregulated | Changeda | ||||
|---|---|---|---|---|---|---|
| Yes | No | Yes | No | Yes | No | |
| a‘Changed' includes both up- and downregulated ORFs. | ||||||
| NMD | 23 | 421 | 5 | 439 | 28 | 416 |
| Non-NMD | 92 | 2985 | 68 | 3009 | 160 | 2917 |
| P-value | 0.0214 | 0.1551 | 0.3114 | |||
The above results are consistent with a model in which some genes have increased TE upon starvation, of which a disproportionate number are NMD transcripts, but that the change in TE is not particular to NMD transcripts. When, however, we only consider the ORFs with ⩾2-fold increase of TE, NMD targets have larger change fold (WRST, P<0.01), suggesting that condition specificity alone cannot explain increase of TE for NMD targets. The above results suggest that the low TE of NMD targets is not an early step in the mRNA decay pathway, but that NMD targets are regulated at the TE level.
How the increase in TE upon starvation happens is unclear. Modifying RNA secondary structure to increase translation initiation or shifting the tRNA pool to the codons used in NMD targets (Elf et al, 2003; Dittmar et al, 2005) are possible explanations. In principle, these are subject to experimental manipulation.
Conclusions
In this study, we found that NMD targets are not only suppressed at the mRNA level, but also suppressed at the translational level in the absence of NMD, with poor initiation and slow translation. The low overall TE and the skewed values of the affecting factors (except for start codon context) cannot be accounted for by weak selection on low-abundance transcripts. Whether the low TE is an evolved feature to enable translational suppression of transcripts that are already regulated by NMD, or because transcripts with low TE are more likely to be targeted by NMD, is unresolved.
The factors we identified here cannot explain all the variation of TE. Other factors, such as mRNA location (Parker and Sheth, 2007) and mRNA export from the nucleus, may also be relevant. On the other hand, it is possible that NMD effectors may be involved in this repression, but the role is independent of mRNA decay. There is some evidence for this. ORFs bound by UPF1P, but not responsive to UPF2 activation, may not be subject to NMD (Johansson et al, 2007). This set of ORFs, compared with non-NMD ones, have significantly lower TE (Supplementary Figure S3, P=2.24E−12). Consistent with this, ORFs bound by more UPF1P are more translationally repressed (Figure 1F), although not significantly so. Moreover, UPF1P can target normal mRNAs to the P-body (Sheth and Parker, 2006), suggesting delayed translation. Therefore, NMD factors may be involved in translational repression. If so, the NMD pathway may have been misnamed. If, indeed, there proves to be overlap between the components of NMD and the translational suppression observed here, it might be better to consider the whole system the prevention of translation pathway, of which NMD is one subcomponent.
Materials and methods
Data collection
NMD target genes
To define the NMD target gene set in budding yeast, we collated three previous published NMD target lists (He et al, 2003; Guan et al, 2006; Johansson et al, 2007). These studies are based on bench experiments and compare the wild and NMD mutant strains using different approaches. Generally, the genes upregulated after inhibition of NMD effectors are considered as NMD targets. Further, some studies distinguish the direct and indirect targets of the NMD pathway. In the study by Guan et al (2006), the authors compared the mRNA decay rates and identified direct targets based on a statistical model. In the study by Johansson et al (2007), direct targets are those bound by phosphorylated UPF1 (UPF1p) and downregulated when UPF2 was inactivated. The NMD targets are divided into three sets: direct targets in both studies (‘Both', n=43), direct targets in either study (‘Either', n=131) and indirect targets in both studies (‘Indirect', n=181). Note that for the Upf1p associated direct targets, we only chose the ones downregulated after UPF2 activation (Johansson et al, 2007), as those without downregulation may not be regulated by NMD. The direct/indirect target classification is not necessarily unambiguous (Johansson et al, 2007). To evaluate the NMD sensitivity of different targets, we also downloaded the change folds during NMD manipulation from the corresponding supplements. When multiple values were given for a certain ORF, only the one giving the maximum change was kept (see Supplementary Data set S1).
Translation efficiency data
We downloaded the ribosome-profiling data from a previous large scale next-generation RNA sequencing study (Ingolia et al, 2009). As described in that paper, we estimate the relative protein expression rate (the number of proteins per time period) as the ribosome footprint read counts, scaled by feature length and the total number of CDS-aligned reads (rpkM, reads per kilobase per million reads). Similarly, the mRNA abundance is estimated as the mRNA fragment-derived reads, scaled by the feature length and the total number of CDS-aligned reads (rpkM). Then we define the relative TE as the ratio of protein expression rate to mRNA abundance. This represents the potential translational activity for a given mRNA; i.e., the higher the TE, the more protein copies translated from a certain mRNA in a given period. We did not normalize the TE values, because the scaling does not affect the relative difference between two genes or two groups of genes. In ANCOVA, we used the log2 (TE), as this better approximates normality. To improve the accuracy, we require the total number of reads to exceed 127 when calculating TE, as suggested in Ingolia et al (2009). When necessary, the mRNA abundance was estimated as log2(rpkM) of mRNA reads in all the analyses (see Supplementary Data set S1).
To examine the reads distribution along an mRNA sequence, we mapped all the reads (both ribosome and mRNA) to the CDS and UTR, based on the given genomic positions for each read. Reads uniquely mapped to only one position were used in our study. All the CDSs were oriented by reference to the start codon, such that the start codons are aligned at position 0, and the downstream codons increase one by one while the upstream ones numbered as −1,−2 and so on. At each codon, we summed up all the reads mapped on them and divided it by the number of sequences having information at that codon. The ribosome and mRNA read densities were calculated separately for NMD and non-NMD ORFs. The TE at each codon was given by the ratio of ribosome to mRNA read counts.
To assess the ribosomal occupancy, we downloaded the data based on polysomal separation on sucrose gradients (Arava et al, 2003). In that study, after treatment with cycloheximide, mRNAs free of or with varying numbers of bound ribosomes are fractionated into 14 aliquots. The mRNA amounts in each fraction were evaluated by a microarray expression system. This data set provides a set of 5071 genes passing quality selection, and information on numbers of bound ribosomes, the proportion of mRNA free of ribosomes and ribosome density for each mRNA (Arava et al, 2003; see http://genome-www.stanford.edu/yeast_translation/index.shtml for more information and downloadable data).
The ratio of protein abundance to mRNA levels is also used as an alternative estimate for TE. For protein abundance, we assembled the data from two sources. One is to measure protein abundance as the summed ion density by mass spectrometry (de Godoy et al, 2008), from which the data are available for 4033 ORFs. The other is based on the immunodetection of common tag-labeled proteins expressed from the natural chromosome locations (Ghaemmaghami et al, 2003), where there are 3868 proteins available. The mRNA expression level for each ORF is measured using mRNA sequence reads; i.e., log2(rpkM) as above. Then the ratio of protein to mRNA abundance was calculated for each ORF. The mass spectrometry-derived protein abundance is also used in other analyses when protein levels are necessary.
mRNA decay rate
Wang et al (2002) measured each mRNA decay rate by a time course microarray analysis, after transcription shut-off for all the ORFs in budding yeast. The data can be downloaded from http://genome-www.stanford.edu/turnover/. We extracted the mRNA decay half-life for each ORF, and then compared them between NMD and non-NMD ORFs.
Budding yeast genes and codon usage data
We downloaded all annotation information of the yeast ORFs from SGD database (SGD project. ‘Saccharomyces Genome Database' http://downloads.yeastgenome.org/, 15 June 2009), which includes the ORF genomic positions and protein length. To control the quality, we only kept the verified ORFs in our analysis, which contains 4823 ORFs with 732 being NMD targets (Union set). Codon usage for each ORF was also downloaded from SGD database. There are three parameters for codon bias evaluation: CAI (Sharp and Li, 1987), codon bias index (Bennetzen and Hall, 1982) and frequency of optimal codon (Ikemura, 1981). All of these three parameters give higher values for highly expressed genes.
Calculation of folding free energy
We employed the method in Kudla et al (2009) to calculate the folding free energy in a sliding window manner. Briefly, given a mRNA sequence, we extracted a sequence segment of 42 nt, and input it into program hybrid-ss-min in package UNAFold (Markham and Zuker, 2008) to obtain the predicted minimum folding energy. We start this from the −42 nt position until 150 nt (where the first position of the start codon was assigned at position 0). If the 5′ UTR is shorter than 42 nt, we started from the first nucleotide of this sequence. Then we correlated the free energy values at each position with the corresponding TE to calculate Spearman's correlation coefficient and P-value. The window starting at −4 gave the most significant correlation coefficient, similar to the position in Escherichia coli (Kudla et al, 2009).
Initiation codon context score calculation
The method in Miyasaka (1999) was used to evaluate the translation optimality at the initiation codon. Based on this, six bases before and three bases after the AUG start codon were extracted from each ORF and then scored against the matrix compiled from highly expressed genes. Higher values suggest better translation initiation.
Statistical analysis
All the statistical analyses in this work were performed in R (http://www.R-project.org; R Development Core Team, 2009).
Supplementary Material
Supplementary Information, Supplementary figures S1–17, Supplementary tables S1–4
Acknowledgments
We greatly thank Drs Dangsheng Li, Sunwei Guo, Jianguo Geng, Ping Wang and Jie Zhang for comments and discussions on our study, and Joshua B Plotkin, Saverio Brogna and Mike Zuker for advice. We also greatly thank three anonymous referees for their valuable comments. This work was supported by the National Natural Science Foundation of China (30871356), the National High Technology Research and Development Program of China (2006AA02A301), the National Basic Research Program of China (2011CB510102) and the Knowledge Innovation Program of the Chinese Academy of Sciences (KSCX1-YW-22). LDH is a Royal Society Wolfson Research Merit Award Holder. Author contributions:Analysis design: XK, LDH and ZZ; data analyses: ZZ; paper writing: LDH, ZZ and XK; data collection: LZ, LH, YZ and HX; analysis tools: ZZ, YL, XC and XY.
Footnotes
The authors declare that they have no conflict of interest.
References
- Arava Y, Wang Y, Storey JD, Liu CL, Brown PO, Herschlag D (2003) Genome-wide analysis of mRNA translation profiles in Saccharomyces cerevisiae. Proc Natl Acad Sci USA 100: 3889–3894 [DOI] [PMC free article] [PubMed] [Google Scholar]
- Belle A, Tanay A, Bitincka L, Shamir R, O'Shea EK (2006) Quantification of protein half-lives in the budding yeast proteome. Proc Natl Acad Sci USA 103: 13004–13009 [DOI] [PMC free article] [PubMed] [Google Scholar]
- Bennetzen JL, Hall BD (1982) Codon selection in yeast. J Biol Chem 257: 3026–3031 [PubMed] [Google Scholar]
- Beyer A, Hollunder J, Nasheuer HP, Wilhelm T (2004) Post-transcriptional expression regulation in the yeast Saccharomyces cerevisiae on a genomic scale. Mol Cell Proteomics 3: 1083–1092 [DOI] [PubMed] [Google Scholar]
- Brockmann R, Beyer A, Heinisch JJ, Wilhelm T (2007) Posttranscriptional expression regulation: what determines translation rates? PLoS Comput Biol 3: e57. [DOI] [PMC free article] [PubMed] [Google Scholar]
- Brogna S, Wen J (2009) Nonsense-mediated mRNA decay (NMD) mechanisms. Nat Struct Mol Biol 16: 107–113 [DOI] [PubMed] [Google Scholar]
- Chang YF, Imam JS, Wilkinson ME (2007) The nonsense-mediated decay RNA surveillance pathway. Ann Rev Biochem 76: 51–74 [DOI] [PubMed] [Google Scholar]
- de Godoy LM, Olsen JV, Cox J, Nielsen ML, Hubner NC, Frohlich F, Walther TC, Mann M (2008) Comprehensive mass-spectrometry-based proteome quantification of haploid versus diploid yeast. Nature 455: 1251–1254 [DOI] [PubMed] [Google Scholar]
- Dittmar KA, Sorensen MA, Elf J, Ehrenberg M, Pan T (2005) Selective charging of tRNA isoacceptors induced by amino-acid starvation. EMBO Rep 6: 151–157 [DOI] [PMC free article] [PubMed] [Google Scholar]
- Elf J, Nilsson D, Tenson T, Ehrenberg M (2003) Selective charging of tRNA isoacceptors explains patterns of codon usage. Science 300: 1718–1722 [DOI] [PubMed] [Google Scholar]
- Ghaemmaghami S, Huh WK, Bower K, Howson RW, Belle A, Dephoure N, O'Shea EK, Weissman JS (2003) Global analysis of protein expression in yeast. Nature 425: 737–741 [DOI] [PubMed] [Google Scholar]
- Gu W, Zhou T, Wilke CO (2010) A universal trend of reduced mRNA stability near the translation-initiation site in prokaryotes and eukaryotes. PLoS Comput Biol 6: e1000664. [DOI] [PMC free article] [PubMed] [Google Scholar]
- Guan Q, Zheng W, Tang S, Liu X, Zinkel RA, Tsui KW, Yandell BS, Culbertson MR (2006) Impact of nonsense-mediated mRNA decay on the global expression profile of budding yeast. PLoS Genet 2: e203. [DOI] [PMC free article] [PubMed] [Google Scholar]
- Hall MN, Gabay J, Debarbouille M, Schwartz M (1982) A role for mRNA secondary structure in the control of translation initiation. Nature 295: 616–618 [DOI] [PubMed] [Google Scholar]
- He F, Li X, Spatrick P, Casillo R, Dong S, Jacobson A (2003) Genome-wide analysis of mRNAs regulated by the nonsense-mediated and 5′ to 3′ mRNA decay pathways in yeast. Mol Cell 12: 1439–1452 [DOI] [PubMed] [Google Scholar]
- Ikemura T (1981) Correlation between the abundance of Escherichia coli transfer RNAs and the occurrence of the respective codons in its protein genes: a proposal for a synonymous codon choice that is optimal for the E. coli translational system. J Mol Biol 151: 389–409 [DOI] [PubMed] [Google Scholar]
- Ingolia NT, Ghaemmaghami S, Newman JR, Weissman JS (2009) Genome-wide analysis in vivo of translation with nucleotide resolution using ribosome profiling. Science 324: 218–223 [DOI] [PMC free article] [PubMed] [Google Scholar]
- Isken O, Kim YK, Hosoda N, Mayeur GL, Hershey JW, Maquat LE (2008) Upf1 phosphorylation triggers translational repression during nonsense-mediated mRNA decay. Cell 133: 314–327 [DOI] [PMC free article] [PubMed] [Google Scholar]
- Johansson MJ, He F, Spatrick P, Li C, Jacobson A (2007) Association of yeast Upf1p with direct substrates of the NMD pathway. Proc Natl Acad Sci USA 104: 20872–20877 [DOI] [PMC free article] [PubMed] [Google Scholar]
- Kebaara BW, Atkin AL (2009) Long 3′-UTRs target wild-type mRNAs for nonsense-mediated mRNA decay in Saccharomyces cerevisiae. Nucleic Acids Res 37: 2771–2778 [DOI] [PMC free article] [PubMed] [Google Scholar]
- Kozak M (2005) Regulation of translation via mRNA structure in prokaryotes and eukaryotes. Gene 361: 13–37 [DOI] [PubMed] [Google Scholar]
- Kudla G, Murray AW, Tollervey D, Plotkin JB (2009) Coding-sequence determinants of gene expression in Escherichia coli. Science 324: 255–258 [DOI] [PMC free article] [PubMed] [Google Scholar]
- Markham NR, Zuker M (2008) UNAFold: software for nucleic acid folding and hybridization. Methods Mol Biol 453: 3–31 [DOI] [PubMed] [Google Scholar]
- Mendell JT, Sharifi NA, Meyers JL, Martinez-Murillo F, Dietz HC (2004) Nonsense surveillance regulates expression of diverse classes of mammalian transcripts and mutes genomic noise. Nat Genet 36: 1073–1078 [DOI] [PubMed] [Google Scholar]
- Miyasaka H (1999) The positive relationship between codon usage bias and translation initiation AUG context in Saccharomyces cerevisiae. Yeast 15: 633–637 [DOI] [PubMed] [Google Scholar]
- Parker R, Sheth U (2007) P bodies and the control of mRNA translation and degradation. Mol Cell 25: 635–646 [DOI] [PubMed] [Google Scholar]
- R Development Core Team (2009) R: A Language and Environment for Statistical Computing. R Foundation for Statistical Computing: Vienna, Austria [Google Scholar]
- Sharp PM, Li WH (1987) The codon Adaptation Index—a measure of directional synonymous codon usage bias, and its potential applications. Nucleic Acids Res 15: 1281–1295 [DOI] [PMC free article] [PubMed] [Google Scholar]
- Sheth U, Parker R (2006) Targeting of aberrant mRNAs to cytoplasmic processing bodies. Cell 125: 1095–1109 [DOI] [PMC free article] [PubMed] [Google Scholar]
- Tuller T, Carmi A, Vestsigian K, Navon S, Dorfan Y, Zaborske J, Pan T, Dahan O, Furman I, Pilpel Y (2010a) An evolutionarily conserved mechanism for controlling the efficiency of protein translation. Cell 141: 344–354 [DOI] [PubMed] [Google Scholar]
- Tuller T, Kupiec M, Ruppin E (2007) Determinants of protein abundance and translation efficiency in S. cerevisiae. PLoS Comput Biol 3: e248. [DOI] [PMC free article] [PubMed] [Google Scholar]
- Tuller T, Waldman YY, Kupiec M, Ruppin E (2010b) Translation efficiency is determined by both codon bias and folding energy. Proc Natl Acad Sci USA 107: 3645–3650 [DOI] [PMC free article] [PubMed] [Google Scholar]
- Wang Y, Liu CL, Storey JD, Tibshirani RJ, Herschlag D, Brown PO (2002) Precision and functional specificity in mRNA decay. Proc Natl Acad Sci USA 99: 5860–5865 [DOI] [PMC free article] [PubMed] [Google Scholar]
- Wen JD, Lancaster L, Hodges C, Zeri AC, Yoshimura SH, Noller HF, Bustamante C, Tinoco I (2008) Following translation by single ribosomes one codon at a time. Nature 452: 598–603 [DOI] [PMC free article] [PubMed] [Google Scholar]
- Zetoune AB, Fontaniere S, Magnin D, Anczukow O, Buisson M, Zhang CX, Mazoyer S (2008) Comparison of nonsense-mediated mRNA decay efficiency in various murine tissues. BMC Genet 9: 83. [DOI] [PMC free article] [PubMed] [Google Scholar]
- Zhang S, Ruiz-Echevarria MJ, Quan Y, Peltz SW (1995) Identification and characterization of a sequence motif involved in nonsense-mediated mRNA decay. Mol Cell Biol 15: 2231–2244 [DOI] [PMC free article] [PubMed] [Google Scholar]
- Zhang Z, Xin D, Wang P, Zhou L, Hu L, Kong X, Hurst LD (2009) Noisy splicing, more than expression regulation, explains why some exons are subject to nonsense-mediated mRNA decay. BMC Biol 7: 23. [DOI] [PMC free article] [PubMed] [Google Scholar]
Associated Data
This section collects any data citations, data availability statements, or supplementary materials included in this article.
Supplementary Materials
Supplementary Information, Supplementary figures S1–17, Supplementary tables S1–4